NOAA Teacher At Sea
Robert Ulmer
Aboard NOAA Ship Rainier
Underway from June 15 to July 3, 2013
Current coordinates: N 56⁰35.547’, W 134⁰36.925’
(approaching Red Bluff Bay in Chatham Strait)
Mission: Hydrographic survey
Geographical area of cruise: Southeast Alaska, including Chatham Strait and Behm Canal, with a Gulf of Alaska transit westward to Kodiak
Log date: June 19, 2013
Weather conditions: 10.93⁰C, less than 0.5 km visibility in thick fog, 95.42% relative humidity, 1013.38 mb of atmospheric pressure, light variable winds (speed of less than 3 knots with a heading between 24⁰ and 35⁰)
Explorer’s Log: Survey, sample, and tide parties
Scientists are explorers, wandering the wilderness of wonder and curiosity their with eyes and minds wide open to events, ideas, and explanations that no other humans may have previously experienced. And by definition, explorers — including scientists — also are builders, as they construct novel paths of adventure along their journeys, built always upon the strong foundations of their own reliable cognitions and skill sets.

Starting from their own observations of the world around them, prior knowledge, and context, scientists inject creativity and insight to develop hypotheses about how and why things happen. Testing those ideas involves developing a plan and then gathering relevant data (pieces of information) so that they can move down the path of whittling away explanations that aren’t empirically supported by the data and adding to the collective body of knowledge, so that they and others might better fathom the likely explanations that are behind the phenomena in question.

Because progress along the scientific path of discovery and explanation ultimately depends on the data, those data must be both accurate and precise. Often these terms are confused in regular conversation, but each word has its own definition.

Accuracy is a description of the degree of closeness or proximity of measurements of a quantity to the actual value of that quantity. A soccer player who shoots on goal several times and has most of his shots reach the inside of the net is an accurate shooter. Likewise, a set of measurements of the density of a large volume of seawater is more accurate if the sample data all are near the actual density of that seawater; a measurement that is 0.4% higher than the actual density of the water is just as accurate as another measurement of the same water that is 0.4% below the actual density value.

Precision (also called reproducibility or repeatability), on the other hand, is the degree to which repeated measurements under unchanged conditions show the same results. If every shot attempted by the soccer player strikes the left goalpost four feet above the ground, those shots aren’t necessarily accurate – assuming that the player wants to score goals – but they are very precise. So, similarly, a set of measurements of seawater density that repeatedly is 5.3% above the actual density of the water is precise (though not particularly accurate).

The NOAA teams that conduct hydrographic surveys, collect seafloor samples, and gather data about tide conditions must be both accurate and precise because the culmination of their work collecting data in the field is the production of nautical charts and tide reports that will be used around the world for commerce, recreation, travel, fisheries management, environmental conservation, and countless other purposes.

Hydrographic surveys of some sort have been conducted for centuries. Ancient Egyptian hieroglyphs show men aboard boats using ropes or poles to fathom the depths of the water. In 1807, President Thomas Jefferson signed a mandate establishing the Survey of the Coast. Since that time, government-based agencies (now NOAA’s Office of Coast Survey) have employed various systems of surveying depths, dangers, and seabed descriptions along the 95,000 miles of navigable U.S. coastlines, which regularly change due to attrition, deposition, glaciation, tectonic shifts, and other outside forces.

For most of that history, data were collected through a systematic dropping of weighted lines (called “lead lines”) from boats moving back and forth across navigable channels at points along an imaginary grid, with calibration from at least two shore points to assure location of the boat. Beyond the geometry, algebra, and other mathematics of measurement and triangulation, the work was painstakingly slow, as ropes had to be lowered, hauled, and measured at every point, and the men ashore often traveled alongside the boat by foot across difficult and dangerous terrain. However, the charts made by those early surveys were rather accurate for most purposes.

The biggest problem with the early charts, though, was that no measurements were made between the grid points, and the seafloor is not always a smooth surface. Uncharted rocks, reefs, or rises on the seabed could be disastrous if ships passed above them.


Starting in the 1990s, single-beam sonar became the primary mechanism for NOAA’s surveys. Still looking straight down, single-beam sonar on large ships and on their small “launch vessels” (for areas that couldn’t be accessed safely by larger craft) provided a much more complete mapping of the seafloor than the ropes used previously. Sonar systems constantly (many times per second) ping while traveling back and forth across and along a channel, using the speed and angle of reflection of the emitted sound waves to locate and measure the depth of bottom features.

Sound waves travel at different speeds through different materials, based on the temperature, density, and elasticity of each medium. Therefore, NOAA also deploys CTD devices through columns of surveyed waterways to measure electrical conductivity (which indicates salinity because of ionization of salts dissolved in the water, thus affecting solution density), temperature (which usually is colder at greater depths, but not necessarily, especially considering runoff from glaciers, etc.), and depth (which generally has a positive-variation relationship with water pressure, meaning more pressure – and thus, greater density – as depth below the surface increases).

The most modern technology employed by NOAA in its hydrographic surveys uses multi-beam sonar to give even more complete coverage of the seafloor by sending sound waves straight downward and fanned outward in both directions as the boat travels slowly forward. Even though sonar beams sent at angles don’t reflect as much or as directly as those sent straight downward, uneven surfaces on the seabed do reflect some wave energy, thus reducing the occurrence of “holidays” (small areas not well-defined on charts, perhaps named after unpainted bits of canvas in portraits because the painter seemed to have “taken a holiday” from painting there).


But that’s not all. To help sailors make decisions about navigation and anchoring – and often giving fishermen and marine biologists useful information about ecology under the waterline – NOAA also performs systematic samples of the types of materials on the sea floor at representative points in the waterways where it conducts surveys. Dropping heavy metallic scoop devices on lines* dozens of meters long through waters at various locations and then hauling them back aboard by winch or hand-over-hand to inspect the mud, sand, silt, gravel, rocks, shells, plants, or animals can be physically demanding labor but is necessary for the gathering of empirical data.
* A note about terminology from XO Holly Jablonski: Aboard the ship, lines have a job. Think of a “rope” as an unemployed line.
Additionally, Earth’s moon and sun (along with several underground factors) affect the horizontal and vertical movement of water on Earth’s surface, especially due to their gravitational pulls as Earth spins on its axis and orbits the sun and as the moon orbits Earth. Therefore, information about tides is extremely important to understanding the geography of nautical navigation, as the points below the waterline are identified on charts relative to the mean low water mark (so sailors know the least amount of clearance they might have beneath their vessels), and points above the waterline are identified relative to the mean high water mark (including notation of whether those object sometimes are fully submerged).


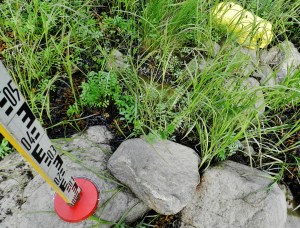
To gather accurate and precise data about tidal influences on local waters, NOAA sends tides-leveling shore parties and dive teams into difficult conditions – commonly climbing up, down, and across rock faces, traversing dense vegetation, and encountering local wildlife (including grizzly bears here in Alaska!) – to drill benchmarks into near-shore foundation rocks, install (and later remove) tidal gauges that measure changing water heights and pressures, and use sophisticated mathematics and mechanics to verify the levels of those devices.

Needless to say, this description is significantly less detailed than the impressively intricate work performed at every level by NOAA’s hydrographic scientists, and in the end, all of the collected data described in the paragraphs above – and more, like the velocity of the sonar-deploying vessel – must be analyzed, discussed, and interpreted by teams of scientists with broad and deep skills before the final nautical charts are published for use by the public.

As you choose where and how to proceed in your own journeys, remember that you can be more confident about your decision-making by using information that is both accurate and precise. And keep exploring, my friends.

Did You Know?

Every ship in the NOAA fleet also is a voluntary mobile weather station, and so are many other seagoing vessels around the world. For many years ships have been required to report their locations and identities on a regular basis to agencies like the U.S. Coast Guard and local or regional harbormasters. Those periodic reports were (and still are) vital for local traffic control on the waters and for helping to provide quick response to emergency situations on vessels at sea.

Eventually, someone insightful realized that having the ships also provide weather reports from their positions along with those identity-and-location reports would make a much richer and broader network of timely data for the National Weather Service, which is another branch of the National Oceanic and Atmospheric Administration. As NWS adds the weather data from those many boats to the data gathered at land-based NWS stations and from voluntary land-based reporters of conditions, their models and forecasts become stronger.
(For more info about being a volunteer weather observer or volunteering with NOAA in some other capacity related to oceans, fisheries, or research, please visit www.volunteer.noaa.gov.)
Especially because weather conditions are the results of interactions among local phenomena, regional climate, and the global systems, building more accurate and precise forecast models depends on information from everywhere, but the result is that everyone benefits from the better forecasts, too.


The volunteer opportunities seem really interesting, especially the Cooperative Observer Program (COOP). Maintaining a weather station could be fascinating, especially for aspiring scientists! Even though it was many years ago, I still remember how exciting it was when my family found (and returned) a weather balloon from NOAA’s National Weather Service.
Jas, given how much she loves to observe and contemplate the weather and scenery around her home, I’ll bet your mom would be a great volunteer COOP/NWS weather data collector. And the Smithsonian has some pretty cool volunteer opportunities for citizen scientists, too, at http://www.si.edu/volunteer/. Maybe Reece and I could participate in the Neighborhood Nest Watch or the Tree Banding Project at home or when we hike, for example. I think that many people would like to contribute — whether in fields of science or just in making the world a better place by offering their time, effort, skills, and expertise to their own communities — if they just could find outlets that match their interests. Maybe these links that I’ve posted will help some folks to find those outlets or get them started on finding their own volunteer opportunities elsewhere.
Loving it all and learning too.l So proud. Love Gr. Mad
Thanks, Grandma Madeline. I’m just following in footsteps before me.