NOAA Teacher at Sea Virginia Warren
Mission: Acoustic and Trawl Survey of Walleye Pollock
Geographical Area of Cruise: Shelikof Strait
on NOAA ship Oscar Dyson
Date: 3/25/2016
Science and Technology Log:
This slideshow requires JavaScript.
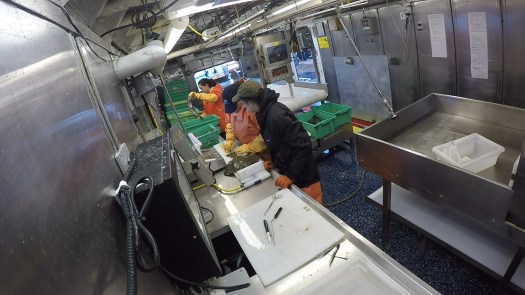
I created the video below to document some of my activities aboard the Oscar Dyson during my 2016 Teacher at Sea research trip.
In this video, Virginia opens with exciting footage from the front of the Oscar Dyson’s bow as they transit through Alaska’s Shelikof Strait. Interspersed, she shares various steps involved in processing the fish caught in the survey: sorting the catch by species (0:34), collecting the pollock into bins (1:00), making an incision to determine the sex of the pollock (1:07), measuring the pollocks’ lengths and taking biological samples (1:33), removing the otoliths (2:23 and 3:29), preserving the otoliths for analyzing on shore (3:12), and measuring and recording other fish using the Ichthystick and the CLAMS computer program (3:57). Virginia also takes the opportunity to show off some interesting species—lumpsucker fish (2:18), starry flounder (2:53), and salmon (3:53). Finally, Virginia gives a brief tour of the deck (4:38) and finishes with a photo of her wearing a survival (or “Gumby”) suit (5:02.)
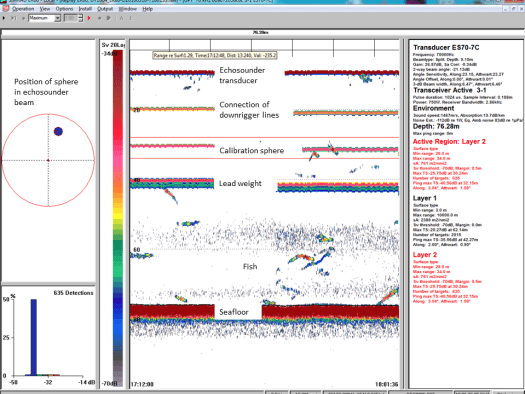
My students know a good bit about my previous Teacher at Sea experience out of Woods Hole, Massachusetts where we used the HabCam to look at the ocean floor. With that knowledge in mind a couple of my students asked me if there was a way that we were able to look at the fish while they were still in the water. The simple answer to that question is yes. While my previous TAS experience used the HabCam, the Oscar Dyson uses a CamTrawl. The CamTrawl is attached to the net and it records pictures as fish enter the cod end of the net.
Image from the CamTrawl
CamTrawlNick and Ryan Attaching the CamTrawl to the Net
After each trawl we would use custom software written in MATLAB to measure lengths of pollock while they were in the water. This program uses the pictures taken from the CamTrawl during the trawl to measure the length of the fish. The CamTrawl takes two pictures at different angles so that most of the time we can see the same fish from two different angles. Fish length irregularities occur in the MATLAB program when it selects nets or two fish at one time to length, so therefore a person has to go back and check to make sure that the program has selected valid fish to length. As the fish pictures come up on the MATLAB screen the person rating the fish selects the fish when the yellow box around the fish covers most of the fish from both angle camera shots of the CamTrawl.
A Screen in MATLAB that Shows Valid Fish Lengths
The above picture shows three different fish that were valid choices for length measurement. The pictures on the left show one camera angle and the pictures on the right show the other camera angle. When both angles have a valid fish with the correct placement of the yellow box, the person selecting the fish will click the fish to tell the program to use that fish in the measurement data.
Interview With a NOAA Survey Technician: Alyssa Pourmonir
Alyssa Pourmonir inside the Wet Lab
How did you come to be in NOAA Corps? (or what made you decide to join NOAA Corps and not another military branch.
I am not in the NOAA Corps, instead I am a civilian government employee under the title of Survey Technician. I was in the US Coast Guard for 3 years where I took many courses related to navigation, leadership, and ship life. I feel my background in the Coast Guard has allowed me to excel in this demanding environment.
What is your educational/working background?
I have been lucky to have the opportunity to be in the Coast Guard which taught me many professional skills and built me up to be stronger and more independent. I also spent an entire summer forecasting for the weather in Pennsylvania. Here I gained an abundance of practice presenting the weather on the green screen and performing on live television for WNEP TV. Before coming to Alaska for this job, I worked as a consultant at NASA Stennis Space Center performing remote sensing analysis of forests using data from the MODIS and VIIRS data.
Academically, I have a BS in Marine Environmental Science from SUNY Maritime College, although most of my college experience took place at the US Coast Guard Academy.
How long have you been in NOAA Corps?
I’m not in the NOAA Corps, but I have worked for NOAA for almost 2 years as a Survey Technician. May 2014 to present.
How long have you been on the Dyson?
June 2014 to present.
How long do you usually stay onboard the ship before going home?
In the past 2 years I have visited my family one time. Partly because I wish to send money home so my family can struggle a little less and hopefully enjoy a life with less debt; especially as my father passes retirement age. He has worked several full time jobs at a time for many years just to support my mom and sisters. Potentially, his work ethic and care giving nature is what I try to embody each day.
Have you worked on any other NOAA ships? If so, which one and how long did you work on it?
Nope
What is your job description on the Dyson?
On the NOAA Oscar Dyson, I am a crew member who acts as a liaison to the scientific personnel on board. I work up to 12 hours each day, 7 days per week maintaining the scientific data, equipment, and lab spaces on board. I also work alongside the scientists, deck department, and bridge watch standers to collect data by completing many different oceanographic or fishing operations.
How is your science job on the Dyson different from the NOAA Scientists that you work with?
As a crew member, I facilitate a positive environment with the needed resources for the scientists to fulfill their data analysis and data collection. I also work alongside the scientists to process the fishing catch in our lab. So you can imagine me suited up with the scientists analyzing the fish’s reproduction development stages and extracting otoliths.
What is the best part of your job?
I get to explore and work in the infamous Bering Sea Alaska, Gulf of Alaska, and Aleutian Island chain which most people can’t even imagine doing. Here in Alaska, I do not have the luxuries found in Continental US, so I believe out here there is a great opportunity for character building. It takes someone pretty amazing to live out here and do what we do.
What is the most difficult part of your job?
Being in remote places and not seeing family or friends, but also being so far away that it is super expensive to try to see them.
Do you have any career highlights or something that stands out in your mind that is exceptionally interesting?
I began my BS absolutely hating biology. I dislike and do not eat seafood. I was skittish and would let my partners do all of the dissections during classes, and I felt that I knew nothing about biology. As a Marine Environmental Science major I decided to take as many biology electives as I could. I went from the lowest grade in my classes to someone who received one of the highest grades in each class. I graduated just one class shy of a minor in Marine Biology and now toss around fish on the NOAA Ship Oscar Dyson, a fisheries research vessel. While my first day I would jump when the fish would move unexpectedly, now I can analyze characteristics of the fish with little alarm and much confidence. It is amazing how I enjoy biology now. I hope to encourage others to confidently try new things, for with a little practice and hard work you may accomplish anything or overcome fears you may not have realized you had.
Do you have any advice for students who want to pursue a career with NOAA?
If you wish to pursue a career with NOAA, be sure to work hard to learn as much as you can, but also come out of your comfort zone to pursue as many volunteer or paid jobs that will give you work experience that correlates with your interests. Time management and resilience is often my secret to success.
Personal Log:
I had a fabulous time aboard NOAA Ship Oscar Dyson and I’m very thankful to NOAA giving me the opportunity to travel to Alaska and learn from their scientists!!!
This slideshow requires JavaScript.
My flight home started on a small plane from Kodiak to Anchorage.
Ravn Alaska’s Bombardier DHC-8-100
After the plane got into the air and was flying away from Kodiak, we were treated to a flyby of the Kodak Harbor and even got to see the Dyson outside of the harbor as we flew away.
Aerial view of the Kodiak Harbor
We flew into Anchorage, Alaska and I was amazed at the beauty of the mountains in Alaska!
Mountains Outside the Anchorage, Alaska Airport
A little while before sunset I caught a plane from Anchorage to the Chicago, O’Hare airport. The scenery and sunset leaving Alaska was beautiful!!!! I hope this won’t be the last time I get to come to Alaska, because it is a beautiful, adventure-filled part of the United States.
This slideshow requires JavaScript.
It was good to be back on land again when we got back to Kodiak, but I do miss being on the ocean!!
Bow of the Oscar DysonNOAA Ship Oscar Dyson
Finally back on land in front of the NOAA Ship Oscar Dyson!
This experience was wonderful for me, however for my students this experience was invaluable. I was able to communicate and share my experiences with them through email almost daily and they were also able to read my TAS blogs as they were posted. If they don’t learn anything else from my experiences in Alaska, which I know that they will, I hope they will learn that the world is theirs to explore, study, and learn about no matter how small the town is that they come from!!
NOAA Teacher at Sea Virginia Warren
Mission: Acoustic and Trawl Survey of Walleye Pollock
Geographical Area of Cruise: Shelikof Strait
on NOAA ship Oscar Dyson
Date: 3/20/16 – 3/22/16
Data from the Bridge (3/21/16):
Sky: Snow
Visibility: 8 to 10 nautical miles (at one point it was more like 2 to 3 nautical miles)
Wind Speed: 23 knots
Sea Wave Height: 4 – 6 feet
Sea Water Temperature: 5° C (41°)
Air Temperature: 0° C (32° F)
Barometric (Air) Pressure: 994.3 Millibars
Science and Technology Log:
The purpose of this research survey is to collect data on walleye pollock (Gadus chalcogrammus) that scientists will use when the survey is complete to help determine the population of the pollock. This data also helps scientists decide where and when to open the pollock fishery to fishermen. Data collection such as this survey are critical to the survival and health of the pollock fishery.
As I mentioned in a previous blog post, we use an AWT (Aleutian Wing Trawl) to complete the pollock survey. The AWT has two doors that glide through the water and hold the net open. The cod end of the net is where all of the fish end up when the trawl is complete.
Scale model of the Aleutian Wing Trawl (AWT) net courtesy of NOAA Scientist Kresimir Williams (Source: TAS Melissa George)
Codend of the Net – This is where all the fish are when the trawl is brought up.
Trawl Door
After the trawl is brought back onto the boat, the cod end of net is dumped onto a hydraulic table. The hydraulic table is then lifted up so that it angles the fish down a shoot into the Wet Lab on a conveyor belt.
The door to the shoot is opened allowing fish from the table outside to be dumped down the shoot and on to the conveyor belt inside.
Kim and Virginia sorting fish on the conveyor belt.
Once the pollock come through the shoot and onto the conveyor belt, the first thing that we do is pick out every type of animal that is not a pollock. So far we have found lots of eulachons (Thaleichthys pacificus), jellyfish (Cnidaria), isopods, and squid. We have even found the occasional chinook salmon (Oncorhynchus tshawytscha), rock fish (Sebastes spp.), and a lumpsucker (Cyclopteridea). The pollock continue to roll down the conveyor belt into a plastic bin until the bin is full. Then the bin of pollock are weighed.
Contents of the Trawl
This slideshow requires JavaScript.
The data from every fish we sample goes into a computer system called CLAMS. CLAMS stands for Catch Logger for Acoustic Midwater Survey. While we are taking samples of the fish our gloves get covered in fish scales and become slimy, so to be able to enter the data into the CLAMS system without causing damage there is a touch screen on all of the computers in the Wet Lab.
CLAMS computer system with a touch screen.
Once the pollock are weighed, a sample of the fish are taken to be sexed. To sex the fish, we use a scalpel to slice into the side of the fish. The picture of the chart below shows what we are looking for to determine if a pollock is male or female. Once we know what sex the fish is, we put it into a bin that says “Sheilas” for the female fish and “Blokes” for the male fish.
This chart of the Maturity Scale for Walleye Pollock is hanging in the Wet Lab.
Up-close of the Maturity Scale for female pollock.
Up-close of the Maturity Scale for male pollock.
Kim showing Virginia what to look for when sexing the fish.
Once the fish are in their correct male/female bin, they are then measured for their length using an Ichthystick.
The Ichthystick has a magnet under the board. When the fish is placed on top of the board, a hand held magnet is placed at the fork of the fish tale. Where the hand held magnet is attracted to the magnet under the board tells the computer the length of the fish and the data is automatically stored in the CLAMS program.
IchtystickGetting the length of the starry flounder using the Ichthystick.
The next station is where the stomach, ovaries, and otoliths are removed from the fish and preserved for scientists to research when the survey is over. The ovaries of a female fish are weighed as well. Depending on the size of the ovaries, they may be collected for further research. Once all of the data has been collected from the fish, a label is printed with the data on it. This label is placed in the bag with the stomach or ovaries sample. Kim completes a special project for this survey. She is a stomach content analysist, so she collects stomachs from a sample of fish that will be taken back to her lab to analyze the stomach content of what she collected. She puts the stomach and the label with the fish’s information, into a bag that is placed in a solution of formalin that preserves the samples.
This slideshow requires JavaScript.
The next step is to get the otoliths out of the fish. A knife is used to cut across the head of the pollock. Otoliths are used to learn the age of the fish. The otoliths are placed in a glass vile that has a barcode number that can be scanned and put with all of the fish’s information in CLAMS. This number is used to keep track of the fish data for when the otoliths get analyzed later on.
Getting the Otoliths
This slideshow requires JavaScript.
We also collect length, weight, sex, and stomach samples from other fish that come up in the trawl as well.
Interview with a NOAA Corps Officer: Ensign Caroline Wilkinson Caroline is a Junior NOAA Corps Officer on board the NOAA ship Oscar Dyson. She is always very helpful with any information asked of her and always has a smile on her face when she does so. Thank you Caroline for making me feel so welcomed on board the Dyson!
Ensign Caroline Wilkinson
How did you come to be in NOAA Corps? (or what made you decide to join NOAA Corps and not another military branch?
I graduated from college in May of 2015. I was looking for a job at a career fair at my school and discovered the NOAA Corps. I had heard of NOAA, but didn’t know a lot about NOAA Corps. I wanted to travel and NOAA Corps allowed me that opportunity. I was unsure what type of work I wanted to do, so I decided to join and explore career options or make a career out of NOAA Corps.
What is your educational/working background?
I went to the University of Michigan where I received an undergraduate degree in ecology and evolutionary biology and a minor in physical oceanography.
How long have you been in NOAA Corps?
July of 2015 I started basic training. Training was at the Coast Guard academy in a strict military environment. We had navigation and ship handling classes seven hours a day.
How long have you been on the Dyson?
I have been here since December of 2015.
How long do you usually stay onboard the ship before going home?
We stay at sea for two years and then in a land assignment for 3 years before heading back to sea.
Have you worked on any other NOAA ships? If so, which one and how long did you work on it?
Nope, no other ships. I had no underway experience except a five-day dive trip in Australia.
Where have you traveled to with your job?
We were in Newport, Oregon and then we went to Seattle, Washington for a couple of weeks. Then we went to Kodiak and then to Dutch Harbor.
What is your job description on the Dyson?
I’m a Junior Officer, the Medical Officer, and the Environmental Compliance Officer. As a junior officer I am responsible for standing bridge watch while underway. As a Junior Officer I am responsible for standing 8 hours of watch, driving the ship, every day. As medical officer, we have over 150 drugs onboard that I am responsible for inventorying, administering, and ordering. I also perform weekly health and sanitary inspections and Weekly environmental walkthroughs where I’m looking for any safety hazards, unsecured items, leaks or spills that could go into the water.
What is the best part of your job?
Getting to drive the ship.
What is the most difficult part of your job?
Being so far away from my family and friends.
Do you have any career highlights or something that stands out in your mind that is exceptionally interesting?
During training we got to sail in the US Coast Guard Cutter Eagle. It’s a tall ship (like a pirate ship). We were out for eight days. We went from Baltimore to Port Smith, Virginia and had the opportunity to do a swim call 200 miles out in the Atlantic.
What kind of sea creature do you most like to see while you are at sea?
We have seen some killer whales and humpback whale in the bay we are in this morning. We’ve also seen some albatross.
Do you have any advice for students who want to join NOAA Corps?
You need an undergraduate degree in math or science. There are 2 classes of ten students a year. Recruiters look for students with research experience, a willingness to learn, and a sense of adventure.
Ensign Caroline Wilkinson at the helm.
Personal Log:
I have really been enjoying my time aboard the Oscar Dyson and getting to know the people who are on the ship with me. I love spending time on the Bridge because you can look out and see all around the ship. I also like being on the bridge because I get to witness, and sometimes be a part of, the interactions and camaraderie between the NOAA Corps Officers that drive/control the ship and the other ship workers.
Panoramic view of the NOAA Ship Oscar Dyson‘s Bridge. Look at all of those windows!
Arnold and Kimrie are responsible for making breakfast, lunch, and dinner for all 34 people on the Oscar Dyson. They also clean the galley and all of the dishes that go along with feeding all of those people. They probably have the most important job on the ship, because in my previous experiences, hungry people tend to be grouchy people.
Arnold and Kimrie are the stewards of the Oscar Dyson.
We’ve had a variety of yummy dishes made for us while we’ve been at sea. Breakfast starts at 7 a.m. and could include a combination of scrambled eggs, breakfast casserole, French toast, waffles, chocolate pancakes, bacon, sausage, or my personal favorite, eggs benedict.
Breakfast is served. YUM!!!
Lunch is served at 11 a.m. and seems like a dinner with all of the variety of choices. Lunch usually has some type of soup, fish, and another meat choice available, along with vegetables, bread, and desert. Dinner is served at 5 p.m. and usually soup, fish, and another meat choice available, along with vegetables, bread and desert. I loved getting to try all of the different types of fish that they fix for us and I also really liked getting to try Alaskan King Crab for the first time!!
If you are still hungry after all of that, then there is always a 24-hour salad bar, a variety of cereal, snacks, and ice cream available in the galley. The left-overs from previous meals are also saved and put in the refrigerator for anyone to consume when they feel the need. If we are working and unable to get to the galley before a meal is over, Arnold or Kimrie will save a plate for us to eat when we get finished.
I also tried Ube ice cream, which is purple and made from yams. At first I was very skeptical of any kind of sweet treat being made out of yams, but I was pleasantly surprised that it tasted really good!
Ube ice cream made from yams! Very YUMMY!!!
There is even a place to do laundry on this ship, which I was very happy about because fishy clothes can get pretty stinky!
Laundry Room
I can’t end a blog without showing off some of the beautiful scenery that I have been privileged to see on this journey. The pictures below are of the Semidi Islands.
NOAA Teacher at Sea Virginia Warren
Mission: Acoustic Trawl Survey of Walleye Pollock
Geographical Area of Cruise: Shelikof Strait
on NOAA ship Oscar Dyson
Date: 3/17/16 – 3/18/16
Data from the Bridge:
Sky: Cloudy
Visibility: 10 Nautical Miles
Wind Direction: 0.2 (20°) From the Northeast
Wind Speed: 25 Knots (30 Knots at point during the day)
Sea Wave Height: 5 – 6 ft. on average (10 ft. at highest)
Sea Water Temperature: 5.6° C (42.08° F)
Dry Temperature: 4° C (40° F)
Barometric (Air) Pressure: 1018.4
Science and Technology Log:
When the wind picked up, it was decided that the ship would quit fishing and running transect lines with the echo-sounder and instead go into one of Kodiak’s bays to seek protection from the weather (>40 knot winds and 16 – 20 foot sea waves were forecast). While were were ‘hiding’, the ship’s crew had time to fix a trawl winch problem and change nets, and the scientists conducted a calibration of the echo-sounder (this is done at the beginning and end of surveys). When we left the transect line, we went through Alitak Bay and stopped the ship in front of Hepburn Peninsula, with Deadman Bay to the left of the peninsula and Portage Bay to the right (if you are looking at the map). Where the ship was sitting, the bay was 74.8 m (245.4068 ft) deep and 5.6° C (42.08° F). It was still pretty windy (15-20 knots), but the Hepburn Peninsula blocked us from a lot of the wind.
This slideshow requires JavaScript.
Deadman Bay to the left of Hepburn Peninsula and Portage Bay to the right
The calibration process of the echo sounder took some time. The science crew before me already started the process of calibrating the echo sounder before it was time for my shift to take over. They used three down riggers to send three lines under the center of the boat, where the echo sounder is positioned. A calibration sphere was placed a little further down one of the lines. There is also a lead weight put at the end of the line so that it will help hold the calibration sphere in place as the current moves.
Then one of the science crew uses a system to align the calibration sphere with the echo sounder. There are two types of calibration spheres that we used today. The first, and smaller one, was made out of a tungsten-carbide alloy.
Patrick holding the Tungsten-Carbide Calibration Sphere (photo by Julia Harvey, TAS summer 2013 DY1307)
The second calibration sphere was larger than the first and it was made out of solid copper. This made for a very easy, get a blog done, day for me because the job was completed by the lead scientist Patrick and Robert, one of the other science crew members.
Robert Putting the Copper Calibration Sphere on the Line
Echo-sounder display during calibration. On the echogram (depth on vertical axis, time on horizontal axis) you can see the calibration spheres hanging below the ship above the seafloor. (credit: Patrick Ressler)
Diagram to Describe Echo Sounder Technology (Source Credit: FAO Website)
Diagram to Describe Echo Sounder Technology (Source Credit: FAO Link)
Lead Weight Sphere
Copper Calibration Sphere
Interview with a Scientist: Kim
For this leg of the research cruise Kim is on the same shift that I work on and she’s also my roommate. She has been great in helping me get accustomed to sea life and training me on what to do while we are sorting trawls in the science lab. She also agreed to let me interview her to share her story with my students. I am extremely grateful for all of the help, training, and friendship she has provided while I have been on the Dyson. Her interview is below:
Kim Holding a Smooth Lumpsucker from a Bottom Trawl Survey (photo credit: Kim)
What is your educational background?
I have a bachelor’s of science degree aquatic and fishery sciences and a minor in marine biology.
How long have you been working as a scientist?
About 10 years.
How long have you been working as a NOAA contractor?
6 years.
What is your job description?
I am a stomach content analyst.
How often do you go on a survey?
Usually twice during the summer for about three weeks at a time.
What is a highlight for you while at sea?
A family of 4 got lost at sea and had been missing for 60 hours. We were out on survey and came across them in their life raft. We were able to pull them out. They wrote a book about it called “Lost in the Shelikof: an Alaskan Family’s Struggle to Survive”.
What made you want to be a scientist?
I spent a lot of time on the water as a kid crabbing and playing in the water. I was always drawn to sea life and I wanted to learn as much about it as I could.
What enjoy most about being a scientist?
The survey work is my favorite part of my job. You get to see a lot of unique species that most people don’t get to see. A lot of deep water species. I also like going out on survey because most of my work is done in the lab looking at samples under a microscope. It’s refreshing to be able to travel up here and work on a boat every summer. Sometimes when I’m out here I stop and think “I can’t believe this is my job.” I learn something new every time I come out here. It’s hard work, but it’s also a lot of fun.
What is the hardest part of your job?
We have a sampling plan that tells us what species and what size range of fish we want to collect stomachs from. It can be difficult to get stomachs from all the fish that you’d like to simply because the net doesn’t catch individuals of a certain size. Fish frequently regurgitate their food when they come up in the net and it can be a challenge sometimes to find ones that haven’t thrown up.
What is your favorite sea creature?
Cuttlefish, they are pretty cute.
Any advice for people who want to be a scientist?
Volunteer as much as you can. Internships, especially those involving field work, are a great way to gain experience and help you decide what aspects of a particular field of science you’re most interested in. Also, having enthusiasm for the work that you’re doing goes a long way towards helping you get possible internships and job opportunities in the future. Hard work and enthusiasm are what helped me get where I am today in my career.
Personal Log:
For the first couple of days on board the Dyson we had beautiful weather blue skies, pretty clouds, beautiful scenery, and calm seas. However, experiencing calm seas came to a halt on Thursday. The wind picked up which caused the ship to rock back and forth with the waves. Gusts of wind would cause water to splash over the bow of the ship, creating a very entertaining show. I loved to watch the waves move and feel the ship’s reaction to the power of the water. When I went to visit the bridge of the ship one wave hit the boat hard enough to ring a bell that is hanging in the bridge. Sitting down to do work or eating a meal can be kind of fun when the wind is up. It’s almost like a roller coaster, because you never know when your chair is going to slide sideways. Walking while the ship was rocking was also interesting because two normal steps could become 5 so that you can keep your balance and stay on your feet.
This slideshow requires JavaScript.
On Friday we had our mandatory at sea drills. The first was a fire drill which was very easy for me because all I had to do for that drill was meet up with the rest of the science crew in a preplanned muster station. The next drill was a little more eventful. We had to bring a survival suit, a life jacket, a hat, and gloves to the preplanned muster station. Once we were there roll was called to make sure we were in the correct station to get on the correct life raft should it became necessary. This part wasn’t too bad because the scenery outside was very pretty. However, after that part was complete the people new to the ship had to put on the survival suit, which is supposed to take less than a minute to put on. This was my first attempt to get into a survival suit and I needed a lot of guidance from ENS Ben Kaiser, one of the NOAA Corps officers. He was very patient with me and also took my picture when I was finally able to get it on.
NOAA Teacher at Sea Virginia Warren
Mission: Acoustic and Trawl Survey of Walleye Pollock
Geographical Area of Cruise: Shelikof Strait
on NOAA ship Oscar Dyson
Date: 3/15/2016
Data from the Bridge: Sky: Light and variable
Visibility: 10+ Nautical Miles
Wind Direction: West
Wind Speed: 2.50 (4 knots)
Sea Wave Height: 1 – 2, light swell
Air Temperature: 4.2 degrees C (40 degrees F)
Barometric Pressure: 1004.8
NOAA and NOAA Corps Information:
NOAA is an acronym that stands for National Oceanic and Atmospheric Administration. NOAA is a government agency that helps keep citizens informed on weather conditions and the climate. It also conducts fisheries management, and coastal restoration. As stated on their website, NOAA’s mission is to understand and predict changes in climate, weather, oceans, and coasts, to share that knowledge and information with others, and to conserve and manage coastal and marine ecosystems and resources. NOAA has nine key focus areas, 12,000 NOAA personnel, and 6,773 scientists and engineers.
The NOAA Commissioned Corps Officers are in charge of running NOAA ship Oscar Dyson. The officers keep the ship functioning properly and the people safe. The NOAA Commissioned Officer Corps is one of the seven uniformed services of the United States. As stated on the NOAA Corps website, the NOAA Corps mission is to provide officers technically competent to assume positions of leadership and command in the National Oceanic and Atmospheric Administration (NOAA) and Department of Commerce (DOC) programs and in the Armed Forces during times of war or national emergency. If you would like read more about what the NOAA Corps does, please check out their website here: http://www.noaacorps.noaa.gov/about/about.html
This is my second full day on the ship and my science crew has sorted three trawls. On the first day on shift, I learned that there is a lot of waiting to get the fishing pollock job done correctly. The Chief Scientist, Patrick, is responsible for choosing where and when to launch the trawl. He does this by watching data on a screen that comes from the echo sounder, which is placed under the ship. When you see bright red color on the screen, then you know there is something registering on the echo sounder. This part of the process can take several hours.
Echo Sounder Screen
Once you find the fish, then you have to launch the trawl net. This is a very intricate process because as the net is being launched, it has to be kept free of tangles. If tangles occur in the net it could cause the net to rip once the trawl has begun. At the mouth of the trawl where the opening is for fish to enter, there are two large trawl doors that glide through the water like airplane wings, except the “lift” is a spreading force that goes sideways to open the mouth of the trawl for fish to enter.
Scale model of the Aleutian Wing Trawl (AWT) net courtesy of NOAA Scientist Kresimir Williams
Once the trawl is complete, the catch is dumped onto a table that lifts up to the conveyor belt where we separate pollock from all the other types of animals. The pollock are placed into baskets where they are then weighed. A sample of pollock is taken to examine further. Data on everything that we catch goes into a computer system called CLAMS, which is an acronym for Catch Logger for Acoustic Midwater Survey. I will further explain the sorting and data collection processes, and the CLAMS program on a future blog.
This slideshow requires JavaScript.
Personal Log:
I’m happy to report that all of my flights went great and my luggage didn’t get lost on my way to Kodiak, Alaska. I spent Friday and Saturday nights in Kodiak waiting to rendezvous with the NOAA ship Oscar Dyson Sunday morning.
This slideshow requires JavaScript.
Kodiak is a beautiful, scenic fishing community. I love that Kodiak is able to use clean, alternative-renewable energy resources to make their energy for the island. Notice the wind turbines in the picture below, however Kodiak also uses hydroelectric dams to make most of their power.
Wind Powered Turbines
The Oscar Dyson anchored up outside of the Kodiak harbor in efforts to save time by not having to completely dock up in the harbor. The Dyson sent out its small boat called “The Peggy D” to take people to and from the ship. We put really warm jackets that also served as life jackets(float coats).
I loved this boat ride because it gave me a view of the harbor I hadn’t been able to see yet!
Beautiful Mountains from the Harbor in Kodiak, Alaska
My first view of the Oscar Dyson was spectacular. I saw it as we rounded a very small island outside of the harbor. With the mountains in the background, the ship made a pretty picture.
NOAA Ship Oscar Dyson
This is only the beginning of the trip and I am so looking forward to experience the rest of it.
Hi! My name is Virginia Warren. I teach 5th Grade math and science at Breitling Elementary School in Grand Bay, Alabama. I have been a teacher for 6 years. I am currently in the process of going back to graduate school at the University of South Alabama to get my Master’s Degree in Instructional Design and Development.
I am set to fly out of Pensacola, Florida this coming Thursday morning. I will have a short layover at the Dallas Fort Worth Airport in Texas.Then, I will be off again to Seattle, Washington where I will stay the night before finishing my journey the next day. I am excited about getting to spend even a short amount of time in Seattle because I have never been on the West Coast of the United States. I plan to get as much sight seeing in as possible before my flight to Anchorage, Alaska the next morning. Once I get to Anchorage, I will catch another plane to Kodiak, Alaska where I will rendezvous with the rest of the science crew and the NOAA Ship Oscar Dyson on Saturday.
This image is created from http://flightdiary.net/ and it depicts the flights that I will take to get to Kodiak, Alaska.
This will be my second NOAA Teacher at Sea opportunity. In the summer of 2013 I participated in a sea scallop survey on the Research Vessel Hugh R. Sharp. As a teacher this experience has become invaluable to me because it made scientific research come alive to me in way that I had never been able to express to my students prior to this experience. I am extremely excited about having a second opportunity to travel the world and learn about real data research. I am also excited to be able to share this trip with my 5th grade students back home in Grand Bay, Alabama.
This picture is from my first NOAA Teacher at Sea research cruise in 2013 aboard the R/V Hugh R. Sharp
I will spend about 2 weeks aboard the NOAA Ship Oscar Dyson participating in an acoustic-trawl survey to estimate pollock abundance in Shelikof Strait.
NOAA Teacher at Sea Susy Ellison Aboard NOAA Ship Rainier September 9 – 26, 2013
Mission: Hydrographic Survey Geographic Area: Carbondale, CO Date: November 5, 2013
Weather: You can go to NOAA’s Shiptracker (http://shiptracker.noaa.gov/) to see where the Rainier is and what weather conditions they are experiencing while I am back at school in Glenwood Springs, CO.
GPS Reading: 39o 24,13146 N 107o 12.6711 W
Temp: -8C
Wind Speed: 0
Barometer: 1026.00 mb
Visibility: Clear
Science and Technology Log
How do you become a hydrographer? After spending 2 ½ weeks aboard the Rainier as a Teacher at Sea, I found that this question had as many answers as the ship had hydrographers. In fact, if you take time to concatenate the data (obviously, I have become fond of my newest vocabulary word!), you will learn that being a hydrographer is incredibly multi-faceted and is a confluence of ocean-, cartographic-, and computer-based sciences, with some outdoor skills thrown in for good measure.
Cdr Rick Brennan and some of the hydrographers of the future in Cold Bay, Alaska
The Rainier’s CO, Commander Rick Brennan, finished college with a degree in Civil Engineering. In 1991, his senior year, he discovered NOAA when a professor suggested he check out the NOAA Corps during a recruiter’s visit to campus. He started as a NOAA Corps member in 1992 and has been involved in hydrographic survey work ever since. His studies in the NOAA Corps training included coursework on ships, radar, and navigation, and led to his appointment as Commanding Officer (CO) of the NOAA Ship Rude (http://www.moc.noaa.gov/Decomm Ships/ru-index.html). This ship was NOAA’s smallest hydrography vessel at only 90’ long.
Commander Brennan has seen many changes in hydrography during his career. First and foremost, has been its evolution as an academic discipline. The University of New Hampshire, based in Durham, NH, founded the Center for Coastal and Ocean Mapping in 1999. Their Joint Hydrographic Center was created through a partnership between the University and NOAA. (http://ccom.unh.edu/about-ccomjhc, http://www.eos.sr.unh.edu/) Prior to this, hydrography was part of more general courses in oceanography. Now, you can get a Master’s Degree in Hydrography.
The last 20+ years have also seen significant changes in hydrographic technology, especially in the tools used to map the ocean floor. Prior to 1994, hydrographic vessels were outfitted with single beam sonar, instead of the multi-beam sonar that is today’s standard. The single beam only provided bathymetric data at a single position on the seafloor directly below the vessel, while multi-beam sonar can give us high resolution information about the seafloor across a swath of the seafloor stretching several hundred meters to either side of the vessel. The Rainier, as NOAA’s premier hydrography vessel, was fully outfitted with multi-beam sonar by 1998. Other technological advances have included significant changes in information processing, from the days of paper tape and punch card programming, to the development of hydrography-specific data analysis programs such as CARIS.
While data collection capabilities have changed exponentially over the past 20 years, CDR Brennan noted changes in how that data is used. NOAA has set the industry standard worldwide for collecting hydrographic data. Departments within NOAA are able to use that data to more than make charts. Fisheries biologists can use the detailed seafloor information in their assessments of ecosystem health and the availability of suitable prey species for all parts of the complex ocean-based food web. Shorelines are dynamic; charting plays a role in establishing baseline data in a changing world. Brennan foresees a future where navigators will view charts using a variety of platforms besides merely lines on paper; this will take educating mariners in how to utilize some of the new electronic tools that are available.
Brennan reflected that, while there have been significant advances in the field of hydrography, there is still much work to do. NOAA publishes an annual review of its hydrographic survey goals (http://www.nauticalcharts.noaa.gov/hsd/NHSP.htm) . While this might not sound like the most scintillating of reads, it’s a fascinating look at the enormity of the concept of charting our coastline. Depending on how you view coastline—is it a smoothed-out line of the coast, does it include all the ins and outs and bays, or does it include all the United States’ navigable coastline extending out 200 nautical miles—one thing is certain, there’s a lot of it. In Alaska, alone, NOAA has identified 324,465 square nautical miles as Navigationally Significant. The identified total for all of the United States, including the Caribbean, is 511, 051 square nautical miles. Alaska is big! The crew of the Rainier will have plenty of work!
Chief Survey Technician Jim Jacobson at work in the computer lab
Chief Survey Technician Jim Jacobson’s favorite area to survey is Southeast Alaska with its varied topography, underwater features, and interesting ports. He should know, since he’s been a member of the Rainier’s survey crew since 1990. Jim graduated from the University of Washington with a degree in Oceanography—at that time there were no hydrography-specific programs. When he began, a large part of the training consisted of good old, OJT—on the job training, learning new skills as new equipment and techniques became available. Needless to say, there have been more than a few changes over the past 20+ years.
Jim began his career before GPS was a part of hydrographic survey. Setting benchmarks to establish sea levels was done using transits and theodolites, triangulating from known points on land to establish location and elevation on shore. Information was transmitted using microwave towers that were erected on site. Fast forward to 2013, where GPS is part of everyone’s vocabulary and the ability to know ‘exactly’ where you are is often in the palm of your hand. The Rainier’s tide gauge stations are set using GPS units that can identify location and elevation to within centimeters.
He also began his career using single beam sonar, instead of today’s multi-beam. While single beam doesn’t have the pinpoint accuracy that multi-beam sonar might offer, there were a few advantages. It was a faster way to collect data, since you weren’t collecting as much information with each ‘ping’. Thus, you could complete more ‘sheets’ (an identified area for mapping) during your time at sea.
There have been incredible advances in data analysis since Jim started on the Rainier. Data collected each day has become more complex, requiring more hours of ‘cleaning’ to remove extraneous pings and information. Hydrographers use increasingly complex computer software to produce charts, often spending up to 5 hours to process one hour’s data.
What’s next? Jim imagines a future with underwater mapping done by ROVs, remotely operated vehicles, cruising the seafloor to send back terabytes of information. ROVs are already used in a variety of information-gathering capacities, sending back high-quality video of seafloor conditions, information on water chemistry, or video of marine life from far below the surface.
Here’s what hasn’t changed–hydrographers work in all sorts of weather and ocean conditions!
Christi Reiser didn’t start out planning to be a hydrographer. She has, perhaps, the most diverse resume of any of the survey team. Christi is currently a college student, and will be receiving her BA in Geography from the University of Colorado, Denver at the end of this year. Her hydrography career began in May, 2012 when she was hired as an intern on the Rainier, earning college credit while working for NOAA.
Christi Reiser
Since high school, Christi has earned an Associate’s Degree in Business, was employed as a saddle maker in Austria, and worked for an oil company as a mapping technician. While all of those pathways gave her something to ponder, it was the GIS part of her mapping job that really ignited the fire that sent her back to college to pursue a degree in Geography with a focus on GIS and a minor in Environmental Science. To further stoke that fire, Christi worked to design and pursue an internship experience that would allow her to ‘test drive’ a career combining GIS, hydrography, and life on the high seas. Through a combination of motivation, Google-based searching, a diverse and applicable set of educational and experiential skills, and the courage to make some phone calls and take a few risks, Christi ended up on the Rainier, working as a paid intern. How cool is that? She earns college credit, gains expertise working with challenging software and data acquisition programs and equipment, charts the uncharted ocean floor, and sees parts of Alaska that aren’t on the usual tourist’s destination list. One of her projects during her first season on the Rainier was the creation of an online blog describing her work. You can check it out at http://rainierinternship.blogspot.com/
Through her internship Christi has found that NOAA is one of the most education-oriented organizations she has worked for, constantly providing opportunities to learn new skills and information. She is excited to be working in a GIS-based field and considers it to be one that is ‘never-ending’, since only 4% of the sea floor has been mapped! After graduation, her next step may be a Master’s Degree in Geography, to add more science research experience to her knowledge base. After that? Well, all I can say is that Christi plans to create a new job that “doesn’t even exist”. Stay tuned.
So, the next time you’re talking to your guidance counselor about college plans, or wondering what you might want to be when and if you grow up, consider the field of hydrography. Where else do you get to wear a life jacket to work?
Field Operations Officer (FOO)Meghan McGovern goes over the Plan of the Day. Where else do you get to wear a life jacket to work?
Personal Log
Now that I’ve been home a few weeks, it’s time to reflect on my Teacher at Sea experience. I’ve been asked, more than once, “Did it meet my expectations”? That’s an easy question to answer—the answer is “No, it exceeded my expectations!” I came away from my time on the high seas with much more than just knowledge of the complexities of seafloor mapping. As a firm believer in the concept that ‘everything is interesting’, it would be hard to point to any aspect of my trip that wasn’tsomething fun and interesting to learn!
The science of hydrography is amazing. Just thinking about mapping something that you can’t actually see is an incredible concept. I have always been fascinated with maps and the process of creating a map, but I look at those maps a little differently now, going beyond the story the map tells to thinking about how that map was made. The science of mapping has undergone many changes since those first sailors with their lead lines creating maps of harbors and shorelines. In case you’re still wondering why hydrography and the Rainier’s mission is so important, check out this clip from a PBS special that aired in September–http://www.pbs.org/newshour/bb/climate-change/july-dec13/arctic_09-17.html
The teamwork, efficiency, and camaraderie on the ship were a common thread uniting each day’s activities. Each crew member played a role in the success of the ship’s mapping mission. It took everyone from the engine room to the bridge to keep it all ‘shipshape’. There was really no job too small—everything and everyone had a necessary role. I especially appreciated the fact that every crew member was willing to answer the myriad questions I had; from specific questions about their job to questions about how they ended up on the Rainier.
Perhaps we should have used some of our sonar capabilities to search for the pot of gold at the end of this rainbow!
At the end of my Teacher at Sea experience I have to conclude that NOAA is one of our country’s best kept secrets. What other federal agency can bring you such treats as the daily weather report or tide predictions for an entire year, monitor fisheries along our coastal areas, keep track of our changing climate, or survey marine mammals? Of course, you shouldn’t forget all those nautical charts produced by the hydrographers on the Rainier. NOAA’s webpage says it all (http://www.noaa.gov/); from the ocean floor to the top of our atmosphere—and everything in-between. In a world with a rapidly changing climate I can’t think of an agency that is doing more important work.
Many thanks to NOAA and the Teacher at Sea program for providing me with this incredible learning experience.
NOAA Teacher at Sea Louise Todd Aboard NOAA Ship Oregon II September 13 – 29, 2013
Mission: Shark and Red Snapper Bottom Longline Survey Geographical Area of Cruise: Gulf of Mexico Date: September 26, 2013
Weather Data from the Bridge: Barometric Pressure: 1012.23mb
Sea Temperature: 28.4˚C
Air Temperature: 29.6˚C
Wind speed: 6.43knots
Science and Technology Log:
This morning I went up to the bridge to learn about how the NOAA Corps Officers and the Captain navigate and maneuver the Oregon II. Ensign Rachel Pryor, my roommate,and Captain Dave Nelson gave me a great tour of the bridge!
The Oregon II is 172 feet long and has a maximum speed of 11 knots. It was built in 1967. It has two engines although usually only one engine is used. The second engine is used when transiting in and out of channels or to give the ship more power when in fairways, the areas of high traffic in the Gulf. The Oregon II has a draft of 15 feet which means the hull extends 15 feet underneath the water line. My stateroom is below the water line! Typically the ship will not go into water shallower than 30 feet.
The bridge has a large number of monitors that provide a range of information to assist with navigation. There are two radar screens, one typically set to a range of 12 miles and one typically set to a range of 8 miles. These screens enable the officer navigating the ship to see obstructions, other ships and buoys. When the radar picks up another vessel, it lists a wealth of information on the vessel including its current rate of speed and its destination. The radar is also useful in displaying squalls, fast moving storms, as they develop.
The radar screen is on the far right
Weather is constantly being displayed on another monitor to help the officer determine what to expect throughout the day.
The Nobeltec is a computerized version of navigation charts that illustrates where the ship is and gives information on the distance until our next station, similar to a GPS in your car. ENS Pryor compares the Nobeltec to hard copies of the chart every 30 minutes. Using the hard copies of the charts provides insurance in case the Nobeltec is not working.
Navigation charts
When we arrive at a station, the speed and direction of the wind are carefully considered by the Officer of the Deck (OOD) as they are crucial in successfully setting and hauling back the line. It is important that the ship is being pushed off of the line so the line doesn’t get tangled up in the propeller of the ship. While we are setting the line, the OODis able to stop the engines and even back the ship up to maintain slack in the main line as needed. Cameras on the stern enable the OOD to see the line being set out and make adjustments in the direction of the ship if needed. The same considerations are taken when we are hauling back. The ship typically does not go over 2 knots when the line is being brought back in. The speed can be reduced as needed during the haul back. The OOD carefully monitors the haul back from a small window on the side of the bridge. A lot of work goes into navigating the Oregon II safely!
Personal Log:
I was amazed to see all the monitors up on the bridge! Keeping everything straight requires a lot of focus. Being up on the bridge gave me a new perspective of all that goes into each station. We wouldn’t be able to see all of these sharks without the careful driving from the OOD.
The water has been very calm the past few days. It is like being on a lake. We’ve had nice weather too! A good breeze has kept us from getting too hot when we are setting the line or hauling back.
Did you Know?
The stations where we sample are placed into categories depending on their depth. There are A, B and C stations. A stations are the most shallow, 5-30 fathoms. B stations are between 30 and 100 fathoms. C stations are the deepest, 100-200 fathoms. One fathom is equal to 6 feet. A fathometer is used to measure the depth.
NOAA Teacher at Sea
John Clark Aboard NOAA Ship Henry B. Bigelow September 23 – October 4, 2013
Mission: Autumn Bottom Trawl Survey Geographical Area of Cruise: North Atlantic Date: October 1, 2013
Science and Technology Log
A few hours into our shift midnight we get the word we have been expecting for several days – government shutdown. Our mission will be cut a few days short. That reality means the Bigelow has 24 hours to return to its homeport of Newport, R.I. It takes us 10 hours and we dock around 1 in the afternoon. With our fisheries operations suddenly declared over comes clean-up time, and we spend the next 6 hours of our shift cleaning up the on‐board fish lab. It is a time consuming but important process. The lab needs to be spotless and “fish scent” free before we can call our work finished on this cruise. The lab is literally solid stainless steel and every surface gets washed and suds downed so there is no residue remaining.
Fish scales hiding under a flap!
Our work is inspected by a member of the crew. If it were the military, the officer would have had white gloves on I believe, just like in the old movies, rolling his finger over a remote spot looking for the dust we missed. But this is a shining stainless steel fish lab so there are two simultaneous inspections going on at once – the one with the eyes and the one with the nose. It takes us twice to pass the visual inspection as small collections of fish scales are spotted in a few out-of‐the way areas. It takes us one more pass to clear the smell inspection. Up and down the line we walk, we can all smell the faint lingering perfume of “eau de fishes,” but we are having trouble finding it. We keep following our noses and there it is. Hiding under a black rubber flap at the end of the fish sorting line we find a small collection of fish scales revealed when the flap is removed for inspection. With that little section cleaned up and sprayed down the lab is declared done! There is a smile of satisfaction from the team. It is that attention to detail that explains why the lab never smelled of fish when I first boarded the ship 10 days ago nor has it smelled of fish at any time during our voyage. There is a personal pride in leaving the lab in the same shape we found it. Super clean, all gear and samples stowed, and ready for the next crew to come on board – whenever that turns out to be.
The abrupt and unexpected end to the cruise leaves me scrambling to change my travel plans. Like the ship, I have a limited amount of time to make it home on my government travel orders. The NOAA Teacher at Sea team goes above and beyond to rebook my flights and find me a room for the night.
Personal Log
On the serendipitous side, the change in plans gives me a little time to see Newport, a town famous for its mansions and the Tennis Hall of Fame. My first stop is the Tennis Hall of Fame. My father was a first class tennis player who invested many hours attempting to
teach his son the game. Despite the passion in our home for the great sport we never made it to the Tennis Hall of Fame in Newport. Today I get the chance to fulfill that bucket list goal. I still remember being court side as a young boy at The Philadelphia Indoor Championships watching the likes of Charlie Pasarell, Arthur Ashe, and Pancho Gonzales playing on the canvas tennis court that was stretched out over the basketball arena. There was even a picture of the grass court lawn of the Germantown Cricket Club from its days a USTA championship venue before the move to Forest Hill, NY. I grew up playing on those tennis courts as my father belonged to that club. Good memories.
There was also a “court tennis” court, the game believed to be the precursor to outdoor tennis. Court tennis derived from playing a tennis type game inside a walled‐in court yard. Using the roof and the wall and the open side windows to beat your opponent is all part of the game. I played court tennis as a young teen. It’s a very unique game that is only played in a few spots now. There are only 38 court tennis courts in the world and Newport has two of them. If you like tennis, give court tennis a go if you ever get the chance.
Thoughts of a leisurely stroll evolve into a brisk walk as I head toward the ultimate and most famous Newport mansion: The Breakers, the 100,000 plus square foot summer home of the Vanderbilt family. This house has to be toured to understand the conspicuous consumption as a pastime of the then super rich. My 2000 square foot home would fit entirely inside the grand hall of the Breakers. In fact you could stack my home three high and they would still be below the Breaker’s ceiling. A ceiling inspired by Paris, a billiard room with walls of solid marble overlooking the ocean, a floor of thousands of mosaic floor tiles all put down by hand one by one, a stair case from Gone With the Wind, and 20 bathrooms to choose from all speak to the wealth and pursuit of elegance enjoyed by the Vanderbilt clan. It is a lifestyle of a bye–gone era often referred to as the “Gilded Age.” It is an apt description.
After sightseeing, it’s off to the bus stop for my shuttle to the Newport Airport where I take off at dawn the next morning to head for home. I’m leaving so early that the complementary coffee isn’t out yet! After an uneventful flight comes the end to an amazing adventure. Nothing left now except laundry and memories. And lots of great ideas for lesson plans to work into my classes. Thank you NOAA Teacher at Sea Program for offering me the learning experience of a lifetime. I cannot wait to get back and share the experiences with my students.
Mission: Autumn Bottom Trawl Survey Geographical Area of Cruise: North Atlantic Date: September 27, 2013
Science and Technology Log
It’s going to be a busy night trawling and processing our catch. Yippee. I like being busy as the time passes more quickly and I learn about more fish. A large number of trawling areas are all clustered together for our shift. For the most part that means the time needed to collect data on one trawl is close to the amount of time needed for the ship to reach the next trawling area. The first trawl was a highlight for me as we collected, for the first time, a few puffer fish and one managed to stay inflated so I had a picture taken with that one.
We found a puffer
However, on this night there was more than just puffer fish to be photographed with. On this night we caught the big one that didn’t get away. One trawl brings in an amazing catch of 6 very large striped bass and among them is a new record: The largest striped bass ever hauled in by NOAA Fisheries! The crew let me hold it up. It was very heavy and I kept hoping it would not start flopping around. I could just see myself letting go and watching it slip off the deck and back into the sea. Fortunately, our newly caught prize reacted passively to my photo op. I felt very lucky that the big fish was processed at the station I was working at. When Jakub put the big fish on the scale it was like a game show – special sounds were emitted from our speakers and out came the printed label confirming our prize – “FREEZ – biggest fish ever “-‐-‐the largest Morone Saxatilis (striped bass) ever caught by a NOAA Fisheries research ship. It was four feet long. I kept waiting for the balloons to come down from the ceiling.
Catch of the day
Every member of the science team sorts fish but at the data collection tables my role in the fish lab is one of “recorder”. I’m teamed with another scientist who serves as the “cutter”, in this case Jakub. That person collects the information I enter into the computer. The amount of data collected depends on the quantity and type of fish caught in the net. I help record data on length, weight, sex, sexual development, diet, and scales. Sometimes fish specimens or parts of a fish, like the backbone of a goose fish, are preserved. On other occasions, fish, often the small ones are frozen for further study. Not every scientist can make it on to the Bigelow to be directly part of the trip so species data and samples are collected in accordance with their requests.
Collecting data from a fish as large as our striped bass is not easy. It is as big as the processing sink at our data collection station and it takes Jakub’s skill with a hacksaw-‐-‐yes I said hacksaw-‐-‐to open up the back of the head of the striped bass and retrieve the otolith, the two small bones found behind the head that are studied to determine age. When we were done, the fish was bagged and placed in the deep freeze for further study upon our return. On the good side we only froze one of the six striped bass that we caught so we got to enjoy some great seafood for dinner. The team filleted over 18 pounds of striped bass for the chef to cook up.
Too big for the basket
More Going On:
Processing the trawl is not the only data collection activity taking place on the Bigelow. Before most trawls begin the command comes down to “deploy the bongos”. They are actually a pair of closed end nets similar to nets used to catch butterflies only much longer. The name bongo comes from the deployment apparatus that holds the pair of nets. The top resembles a set of bongo drums with one net attached to each one. Their purpose, once deployed, is to collect plankton samples for further study. Many fish live off plankton until they are themselves eaten by a predator farther up the food chain so the health of plankton is critical to the success of the ecological food chain in the oceans.
Processing
Before some other trawls, comes the command to deploy the CTD device. When submerged to a target depth and running in the water as the ship steams forward, this long fire extinguisher sized device measures conductivity and temperature at specified depths of the ocean. It is another tool for measuring the health of the ocean and how current water conditions can impact the health of the marine life and also the food chain in the area.
Personal Log
On a personal note, I filleted a fish for the first time today – a flounder. Tanya, one of the science crew taught me how to do it. I was so excited about the outcome that I did another one!
NOAA Teacher at Sea Louise Todd Aboard NOAA Ship Oregon II September 13 – 29, 2013
Mission: Shark and Red Snapper Bottom Longline Survey Geographical Area of Cruise: Gulf of Mexico Date: September 25, 2013
Weather Data from the Bridge: Barometric Pressure: 1008.6mb
Sea Temperature: 28.3˚C
Air Temperature: 26.3˚C
Wind speed: 8.73knots
Science and Technology Log:
After we set the line, the CTD (Conductivity, Temperature, Depth) is deployed at each station.
CTD ready to be deployed
This instrument provides information a complete profile of the physical characteristics of the water column, including salinity, temperature and dissolved oxygen. The CTD is deployed from the bow of the boat using a winch.
Deploying the CTD
When it is first lowered in the water it calibrates at the surface for three minutes. After it is calibrated it is lowered into the water until it reaches the bottom. The CTD records data very quickly and provides valuable information about the station. Conductivity is used to measure the salinity, the amount of salt dissolved in the water. The CTD also measures the dissolved oxygen in the water. Dissolved oxygen is an important reading as it reveals how much oxygen is available in that area. The amount of oxygen available in the water indicates the amount of life this station could be capable of supporting. Dissolved oxygen is affected by the temperature and salinity in an area. Higher salinity and temperature result in lower dissolved oxygen levels. Areas of very low dissolved oxygen, called hypoxia, result in dead zones. NOAA monitors hypoxia in the Gulf of Mexico using data from CTDs.
The otoliths and gonads are taken from all of the commercially and recreationally important fish like Snapper, Grouper and Tilefish. Otoliths are used to age fish. Aging fish provides information on the population dynamics for those species. The otoliths are “ear bones” of the fish and are located in their heads. It takes careful work with a knife and tweezers to remove the otoliths.
Removing otoliths
Once the otoliths are removed, they are placed in small envelopes to be examined in the lab in Pascagoula, MS. Otoliths have rings similar to growth rings in trees that have to be carefully counted under a microscope to determine the age of the fish.
Otolith
The gonads (ovaries or testes) are removed and the reproductive stage of the fish is determined. The weights of the gonads are also recorded. Small samples of the gonads are taken in order for the histology to be examined in the lab. Examining the gonads closely will confirm the reproductive stage of the fish. Gathering information about the reproductive stage of the fish also helps with understanding the population dynamics of a species and aids in management decisions.
Personal Log:
Taking the otoliths out of the fish was harder than I anticipated, especially on the larger fish. It takes some muscle to get through the bone!
Otolith removed from a Red Snapper
We have had a few very busy haul backs today. One haul back had over 50 sharks! My favorite shark today was a Bull Shark. We caught two today but were only able to get one into the cradle long enough to get measurements on it. We tagged it and then watched her swim away! I can’t believe we are halfway through my second week. Time is flying by! I can’t wait to see what is on the line tomorrow!
Did you Know?
Yellowedge Grouper are protogynous hermaphrodites. They start their lives as females and transform into males as they age. Yellowedge Grouper are the only species of grouper we have caught.
Animals Seen
Here are a few of the animals we’ve seen so far!
Tilefish (Photo credit Christine Seither)Sandbar shark in the cradleRed Snapper (Photo credit Christine Seither)Yellowedge Grouper (Photo credit Christine Seither)
Mission: Autumn Bottom Trawl Survey Geographical Area of Cruise: North Atlantic Date: September 25, 2013
Science and Technology Log
I was told that the first 12 hour night watch shift was the hardest for staving off sleep and those who spoke were right. Tonight’s overnight shift seems to be flying by and I’m certainly awake. Lots of trawling and sorting this evening with four sorts complete by 6am. One was just full of dogfish, the shark looking fish, and they process quickly because other than weight and length there is little request for other data. The dogfish were sorted at the bucket end of the job so determining sex had already been completed by the time the fish get to my workstation. Again I’m under the mentorship of Jakub who can process fish faster than I can print and place labels on the storage envelopes. The placement of the labels is my weakness as I have no fingernails and removing the paper backing from the sticky label is awkward and time consuming. Still tonight I’m showing speed improvement over last night. Well at least I’m getting the labels on straight most of the time.
Sorting fish
In addition to the dogfish, we have processed large quantities of skate (the one that looks like a sting ray to me), left eyed flounders, croakers (no relation to the frog), and sea robins of which there are two types, northern and stripe. The sea robins are very colorful with the array of spines just behind the mouth. And yes it hurts when one of the spines goes through your glove. Sadly for me sorting has been less exciting tonight. With the big fish being grabbed off at the front of the line there has been little left for me to sort. I feel like the goal keeper in soccer – just don’t let them get past me. To my great surprise, so far I’ve experienced no real fear of touching the fish. The gloves are very nice to work with.
Species in specific buckets
And let us not overlook the squid. There have been pulled in by the hundreds in the runs today. There are two types of squids, long fin (the lolligo) and short fin (the illex). What they both have in common is the ability to make an incredible mess. They are slimy on the outside and inky on the inside. They remind me of a fishy candy bar with really big eyes. And for all the fish that enjoy their squid treat the species is, of course, (wait for it) just eye candy. The stories about the inking are really true. When upset, they give off ink; lots of ink. And they are very upset by the time they reach the data collection stations. If you could bottle their ink you would never need to refill your pen again. They are also very, very plentiful which might explain why there are no requests to collect additional data beyond how long they are. I guess they are not eye candy to marine scientists. However, there vastness is also their virtue. As a food source for many larger species of marine life, an absence of large quantities of squid in our trawling nets would be a bad sign for the marine ecosystem below us.
Safety equipment
When the squid are missing, our friend the Skate (which of the four types does not matter) is glad to pick up the slack on the “messy to work with” front. As this species makes it down the sorting and data collecting line the internal panic button goes off and they exude this thick, slimy substance that covers their bodies and makes them very slippery customers at the weigh stations. It turns out the small spines on the tails were placed there so that fisheries researchers could have a fighting chance to handle them without dropping. Still, a skate sliding onto the floor is a frequent event and provides comic relief for all working at the data collection stations.
There was new species in the nets tonight, the Coronet fish which looks like along drink straw with stripes and a string attached to the back end. It is pencil thick and about a foot long without the string. We only caught it twice during the trip. The rest of the hauls replicate past sorting as dogfish, robins, skates, squid, croakers, and flounder are the bulk of the catch. I’ve been told that the diversity and size of the trawl should be more abundant as we steam along the coastline heading north from the lower coast of New Jersey. Our last trawl of the shift, the nets deployed collect two species new for our voyage, but ones I actually recognized despite my limited knowledge of fish – the Horseshoe Crab and a lobster! I grew up seeing those on the Jersey shore. We only got one lobster and after measuring it we let go back to grow some more. It only weighed in at less than two pounds.
Personal Log
The foul weather suit we wear to work the line does not leave the staging room where they are stored as wearing them around the ship is not allowed. After watching others, I have mastered the art of pushing the wader pants over the rubber boots and thus leaving them set-‐up for quick donning and removal of gear throughout the shift.
While the work is very interesting on board, the highlight of each day is meal time. Even though I work the night shift (which ends at noon) I take a nap right after my shift so I can be up and alert in time for dinner. My favorite has been the T-‐bone steaks with Monterey seasoning and any of the fish cooked up from our trawling like scallops or flounder. The chef, Dennis, and his assistant, Jeremy serve up some really fine cuisine. Not fancy but very tasty. There is a new soup every day at lunch and so far my favorite has been the cream of tomato. I went back for seconds! Of course, breakfast is the meal all of us on the night watch look forward to as there is no meal service between midnight and 7am. After 7 hours of just snacking and coffee, we are ready for some solid food by the time breakfast is served.
Seas continue to be very calm and the weather sunny and pleasant. That’s quite a surprise for the North Atlantic in the fall. And the sunrise today was amazing. The Executive Officer, Chad Cary, shared that the weather we are experiencing should continue for at least four more days. I am grateful for the calm weather – less chance to experience sea sickness. That is something I’m determined to avoid if possible.
NOAA Teacher at Sea Louise Todd Aboard NOAA Ship Oregon II September 13 – 29, 2013
Mission: Shark and Red Snapper Bottom Longline Survey Geographical Area of Cruise: Gulf of Mexico Date: September 23, 2013
Weather Data from the Bridge: Barometric Pressure: 1009.89mb
Sea Temperature: 28˚C
Air Temperature: 28.2˚C
Wind speed: 8.29knots
Science and Technology Log:
The haul back is definitely the most exciting part of each station. Bringing the line back in gives you the chance to see what you caught! Usually there is at least something on the line but my shift has had two totally empty lines which can be pretty disappointing. An empty line is called a water haul since all you are hauling back is water!
After the line has been in the water for one hour, everyone on the shift assembles on the bow to help with the haul back. One crew member operates the large winch used to wind the main line back up so it can be reused.
Winch holding the main line
The crew member operating the winch unhooks each gangion from the main line and hands it to another crew member. That crew member passes it to a member of our shift who unhooks the number from the gangion. The gangions are carefully placed back in the barrels so they are ready for the next station. When something is on the line, the person handling the gangions will say “Fish on”.
Nurse Shark on the line
Everyone gets ready to work when we hear that call. Every fish that comes on board is measured. Usually fish are measured on their sides as that makes it easy to read the markings on the measuring board.
Measuring a Yellowedge Grouper (Photo credit Christine Seither)Christine and Nick measuring a Sandbar Shark
Each shark is examined to determine its gender.
Determining the sex of a sharpnose shark (Photo credit Deb Zimmerman)
Male sharks have claspers, modified pelvic fins that are used during reproduction. Female sharks do not have claspers.
Claspers on a Blacktip
Fin clips, small pieces of the fin, are taken from all species of sharks. The fin clips are used to examine the genetics of the sharks for confirmation of identification and population structure, both of which are important for management decisions.
That’s me in the blue hardhat taking a fin clip from a Sandbar Shark(Photo credit Lisa Jones)
Skin biopsies are taken from any dogfish sharks in order to differentiate between the species. Tags are applied to all sharks. Tags are useful in tracing the movement of sharks. When a shark, or any fish with a tag, is recaptured there is a phone number on the tag to call and report the location where the shark was recaptured.
Some sharks are small and relatively easy to handle.
Small Cuban Dogfish (Photo credit Christine Seither)
Other sharks are large and need to be hauled out of the water using the cradle. The cradle enables the larger sharks to be processed quickly and then returned to the water. A scale on the cradle provides a weight on the shark. Today was the first time my shift caught anything big enough to need the cradle. We used the cradle today for one Sandbar and two Silky Sharks. Everyone on deck has to put a hardhat on when the cradle is used since the cradle is operated using a crane.
Silky shark coming up in the cradleSandbar Shark in the cradle
Personal Log:
I continue to have such a good time on the Oregon II. My shift has had some successful stations which is always exciting. We have had less downtime in between our stations than we did the first few days so we are usually able to do more than one station in our shifts. The weather in the Gulf forced us to make a few small detours and gave us some rain yesterday but otherwise the seas have been calm and the weather has been beautiful. It is hard to believe my first week is already over. I am hopeful that we will continue our good luck with the stations this week! The rocking of the boat makes it very easy for me to sleep at night when my shift is over. I sleep very soundly! The food in the galley is delicious and there are plenty of options at each meal. I feel right at home on the Oregon II!
Did You Know?
Flying fish are active around the boat, especially when the spotlights are on during a haul back at night. Flying fish are able to “fly” using their modified pectoral fins that they spread out. This flying fish flew right onto the boat!
NOAA Teacher at Sea
John Clark Aboard NOAA Ship Henry B. Bigelow September 23 – October 4, 2013
Mission: Autumn Bottom Trawl Survey Geographical Area of Cruise: North Atlantic Date: September 24, 2013
Survival suits!
Science and Technology Log
Today is my first full 12 hour shift day. I’m on the night crew working midnight to noon. Since we left port yesterday I’ve been trying to adjust my internal clock for pulling daily “all night”ers. On Monday, after we left port, safety briefs for all hands occurred once we made it out to sea and I got to complete my initiation into the Teacher at Sea alumni program – the donning of the Gumby suit as I call it. It is actually a bright red wet suit that covers your entire body and makes you look like a TV Claymation figure from the old TV show. In actuality it is designed to help you survive if you need to abandon ship. Pictures are of course taken to preserve this rite of passage.
The Henry B. Bigelow is a specially-built NOAA vessel designed to conduct fisheries research at sea. Its purpose is to collect data that will help scientists assess the health of the Northern Coastal Atlantic Ocean and the fish populations that inhabit it. The work is invaluable to the commercial fishing industry.
The Bigelow in port
Yesterday, I learned how we will go about collecting fisheries data. Our Chief Scientist, Dr. Peter Chase, has selected locations for sampling the local fish population and the ship officers have developed a sailing plan that will enable the ship to visit all those locations, weather permitting, during the course of the voyage. To me its sounds like a well-‐planned game of connecting the dots. At each target location, a trawling net will be deployed and dragged near the bottom of the sea for a 20 minute period at a speed of 3 knots. Hence the reason this voyage is identified as a bottom trawl survey mission. To drag the bottom without damaging the nets is not easy and there are five spare nets on board in case something goes wrong. To minimize the chance of damaging the net during a tow, the survey technicians use the wide beam sonar equipment to survey the bottom prior to deployment. Their goal is to identify a smooth path for the net to follow. The fish collected in the net are sorted and studied, based on selected criteria, once on board. A specially designed transport system moves the fish from the net to the sorting and data collection stations inside the wet lab. I’m very excited to see how it actually works during my upcoming shift.
The big net.
Work is already underway when our night crew checks in. The ship runs 24/7 and the nets have been down and trawling since 7pm. Fish sorting and data collection are already underway. I don my foul weather gear which looks like a set of waders used for British fly fishing. There is also a top jacket but the weather is pleasant tonight and the layer is not needed. I just need to sport some gloves and get to work. I’m involved with processing two trawls of fish right away. I’m assigned to work with an experienced member of the science team, Jakub. We will be collecting information on the species of fish caught on each trawl. Jakub carries out the role as cutter, collecting the physical information or fish parts needed by the scientists. My role is recorder and I enter data about the particular fish being evaluated as well package up and store the parts of the fish being retained for future study.
Ship equipment
Data collection on each fish harvest is a very detailed. Fish are sorted by species as they come down the moving sorting line where they arrive after coming up the conveyer belt system from the “dump” tank, so named because that is where the full nets deposit their bounty. Everybody on the line sorts fish. Big fish get pulled off first by the experienced scientists at the start of belt and then volunteers such as I pull off the smaller fish. Each fish is placed into a bucket by type of fish. There are three types of buckets and each bucket has a bar code tag. The big laundry looking baskets hold the big fish, five gallon paint buckets hold the smaller fish, and one gallon buckets (placed above the sorting line) hold the unexpected or small species. On each run there is generally one fish that is not sorted and goes all the way to the end untouched and unceremoniously ends up in the catch-‐all container at the end of the line. The watch leader weighs the buckets and then links the bar code on the bucket to the type of fish in it. From there the buckets are ready for data collection.
The sorting line
After sorting the fish, individual data collection begins “by the bucket” where simultaneously at three different stations the sizing, weighing, and computer requested activities occur. By random sample certain work is performed on that fish. It gets weighed and usually opened up to retrieve something from inside the fish. Today, I’ve observed several types of data collection. Frequently requested are removal of the otolith, two small bones in the head that are used to help determine the age of the fish. For bigger fish with vertebra, such as the goose fish, there are periodic requests to remove a part of the backbone and ship it off for testing. Determining sex is recorded for many computer tagged fish and several are checked stomach contents.
Of the tools used to record data from the fish, the magic magnetized measuring system is the neatest. It’s rapid fire data collecting at its finest. The fish goes flat on the measuring board; head at the zero point, and then a quick touch with a magnetized block at the end of the fish records the length and weight. Sadly, it marks the end of tall tales about the big one that got away and keeps getting bigger as the story is retold. The length of the specimen is accurately recorded for posterity in an instant.
Personal Log
Flying into Providence over the end of Long Island and the New England coast line is breath taking. A jagged, sandy coast line dotted with summer homes just beyond the sand dunes. To line up for final approach we fly right over Newport where the Henry B. Bigelow is berthed at the Navy base there. However, I am not able to spot the NOAA fisheries vessel that will be my home for the next two weeks from the air.
I arrive a day prior to sailing so I have half a day to see the sites of Newport, Rhode Island and I know exactly where I’m headed – the Tennis Hall of Fame. My father was a first class tennis player who invested many hours attempting to teach his son the game. Despite the passion in our home for the great sport we never made it to the Tennis Hall of Fame in Newport. Today I fulfilled that bucket list goal. I still remember being court side as a young boy at The Philadelphia Indoor Championship watching the likes of Charlie Pasarell, Arthur Ashe, and Pancho Gonzales playing on the canvas tennis court that was stretched out over the basketball arena. Also in the museum, to my surprise, was a picture of the grass court lawn of the Germantown Cricket Club from its days as a USTA championship venue. I grew up playing on those grass tennis courts as my father belonged to that club. After seeing that picture, I left the museum knowing my father got as much out of the visit as I did.
NOAA Teacher at Sea Susy Ellison Aboard NOAA Ship Rainier September 9-26, 2013
Mission: Hydrographic Survey Geographic Area: Cold Bay, Alaska Date: September 22, 2013
Weather: current conditions from the bridge GPS Location: 55o 15.190’ N 162o 38.035’ W
Temp: 8.6C
Wind Speed: 10 kts
Barometer: 1008.3mb
Visibility: 10 miles
You can also go to NOAA’s Shiptracker (http://shiptracker.noaa.gov/) to see where we are and what weather conditions we are experiencing.
What would you think if you saw someone bundled in warm clothing, sitting in an office chair on a pier with a pair of binoculars, a watch, and a clipboard? Are they counting waves? Counting birds? Keeping track of the clouds or the wind speed? In my case it was ‘none of the above’; I was watching a measuring stick, taking measurements every 6 minutes over a period of 3 hours. Why would anyone want to sit in a chair on a pier and stare at a stick for 3 hours?
The answer, of course, is science! Now, this wasn’t just any sort of stick. This tide staff was attached to an automatic tide gauge that the crew of the Rainier installed during their last visit to Cold Bay in August. That gauge has been recording tidal data that is used during their hydrographic survey work. But, as with any automatic data-gathering device, it is critical to field check its accuracy, both in measuring and reporting the data. The gauge measures the depth of the water column at 6-minute intervals, using the pressure of the water column as a proxy for that depth (deeper water exerts a greater pressure on the subsurface opening of the gauge—for a more in-depth explanation, you can check out my blog from September 13th). My job was to stare at the staff for a period of 1 minute every 6 minutes, and determine both the highest and lowest height of the water lapping at the markings on the stick.
This might sound easy, but it wasn’t quite so simple. The wind was howling and the waves were bouncing—it took a little practice to make what I hoped was an accurate estimate of both the high mark and the low. After each observation period I recorded these numbers on a spreadsheet and then spent the next few minutes watching the birds that were flying and landing on the water. Then—back to the stick! The tide was dropping with each observation and the winds died down enough to make it a little easier to read the high and low points on each successive 6 minute interval. By the 10th observation I had it figured out!
NOAA Corps ENS Clark demonstrates proper form for tide gauge observation.Picture trying to read this from far away as the water bounces up and down the staff.
The data I collected was matched against data from the tide gauge for that same time period. I was pleased to see that my observations matched those of the gauge. Apparently, both of ‘us’ are good observers of tidal changes. Now I have one more skill to add to my resume!!
This graph compares my observations with that of the tide gauge. What do we observe vs. what does a computer measure?
AAARGH, MATEY—HOW’S YOUR NUMBER SENSE? APPLIED MATH ON THE HIGH SEAS
It would be hard to find an aspect of life aboard the Rainier that doesn’t involve number sense or math. This ship’s daily operations run like clockwork; breakfast from 0700-0800, Safety Meeting and deployment of the launches at 0800, lunch from 1130 to 1230, launches return at 1630, dinner from 1700 to 1800, etc. Pretty simple numbers to deal with, but numbers, nonetheless.
That’s just the start of your applied math tour of the high seas. Maybe you have to figure out how much diesel fuel the ship has onboard. Since the Rainier uses 20,000-40,000 gallons for each leg of its cruise, it would be pretty horrible to run out before you reached port. The ship’s tanks can hold around 100,000 gallons of diesel and are usually filled to within 95% of that. Unlike your car, there’s no fuel gauge on this ship. So how do you figure out how much fuel is in the tank? It’s time for some simple, yet essential math. First, you need to know the volume of the fuel tank. Get out your math books and find that formula. Then, you take what is called a ‘sounding’—you bang on the tank to determine the level of fuel. Not too complicated, but certainly a skill that takes some practice. So, now you know the total volume of the tank as well as the actual height of your fuel; if you figure out the volumes for each and do some subtraction, you can find out what percentage of your total fuel is still in the tank.
We might all be better at determining volume and percent if we had images of a fuel tank on the dashboards of our cars instead of a linear gauge reading ‘E’ to ‘F’! What about drinking water? The Rainier uses a distillation system to create fresh water from seawater. There are tanks down in the engine room where seawater is heated to the boiling point. There’s a little more math and science in this process—the pressure in the distillation tank is lowered, to lower the boiling point (if you’ve ever camped at a high elevation you might notice that water boils at a lower temperature—your tea might not be quite as hot when it’s boiling) so the water doesn’t have to be heated quite so much to get it to boil. This steam is captured in the upper portion of the distiller and cooled using cold seawater that flows through pipes. The condensation from cooling is captured, filtered to remove any impurities, and distributed as fresh water to all onboard. The ship uses around 2500 gallons of water each day.
Here’s where all our fresh water is produced. This distiller takes in seawater and, through boiling and condensation, produces fresh water.
If you’re running the galley it’s essential to calculate how much food you’ll need for each leg of the trip. No one wants to do without their morning eggs if your multiplication is off and you ‘forget’ to buy a few dozen. Taking a recipe that is designed to feed 8 people and ‘upsizing’ it for 48 people takes a bit of mathematical manipulation. Just planning a menu for a three-week journey takes some mathematical thinking as you visualize the weeks, days, meals, and individual ingredients needed for those meals. You have to factor in a few variables; which foods have the longest shelf life, when do you have to switch from fresh to frozen or to canned foods, how much food does the ‘average’ person eat, and what about all those people with food allergies or preferences? While this might not sound quite as earth-shattering as using a detailed computer program to concatenate multiple data files, this is math that counts—especially when you’re feeding a boatload of hungry crew.
This is a glimpse of some of the supplies stored on the ship.Don’t forget to buy enough fruit and vegies!Hmmm, what’s in the freezer?
So now it’s time to consider the math used to pilot the ship. Think about degrees in a compass bearing and the need to do some rapid mental math as you’re steering a 231-foot ship through some very tight spaces. Quick—take a course of 340o, now look ahead and get ready to change your bearing to 28o. Rainier’s draft (how deep it sits in the water) is around 16’. Will the channel be deep enough? What if you’re traveling in a supertanker, one that might be over 400’ in diameter and have a draft up to 80’ deep? If your ship is that big, you need to scale up on your mental math calculations as you’re searching out appropriate harbors and routes! What about tying up the ship when we’re in harbor? Did you remember to learn something about vectors before you stopped taking math classes?
When we were at port in Cold Bay, the winds were expected to increase in strength and to shift so that they would be coming out of the west. Since the pier was oriented perpendicular to the predicted wind direction, our Chief Bo’ sun, Jim Kruger had to do some mental calculations of the angles needed to secure the ship to the pier and keep it from bouncing too much. He doubled and even tripled some of the lines, taking into account how the winds might move the ship as well as the strength of each line. It takes some stout lines to hold this ship; each 300 ft. line is 1” in diameter and has a tensile (breaking) strength of 164,000 lbs. Vector angles were equally important as we pulled away from the pier in a 50-knot wind. Just pulling up our gangway with a crane required some careful mental calculations of where to place lines to steady it as it rose through the air and was lifted onboard. If your mental math and visualization skills were wrong, you might be rewarded with a wildly swinging piece of metal.
Double (and triple) up the lines holding the ship to the pier. Make sure the angles are right.Hang tight to the gangway as it swings onboard. Make sure you’re holding it at the correct angle to compensate for the wind.Strong winds–this digital anemometer records current wind speed in knots as well as the highest gust.
How about all that hydrographic data collection; there’s plenty of opportunity there for some pretty extreme mathematical calculations. You might even wish you had taken a class in calculus—or a few classes! But there are also plenty of times that some basic number sense and arithmetic come in mighty handy. As I sat on the pier watching the tide gauge, one of the tasks I had to do was to calculate the average between high and low water marks on the tide staff. Not such hard math, but it’s a good skill to be able to do averages in your head while your hands are getting cold and the wind is howling. The tide gauge calculations were referenced to Coordinated Universal Time (UTC). This has been our world standard since 1972, and is referenced to the 0o meridian at Greenwich, England. It is precisely measured using an atomic clock. You might also hear it referred to as Zulu Time. Even airplanes use this time designation. This way, there is no ambiguity about whether you are in daylight savings or standard time, or your time zone. When measuring tides or collecting information about water chemistry using the CTD, or calculating the launch’s daily gyrations, it is important to reference everything to the same time standard. Since the Rainier is on RST (Rainier Standard Time), the calculation gets even more important because we are in the Alaska time zone, but have set our clocks back one more hour to give us more daylight working hours).
What’s your time zone? GMT stands for Greenwich Mean Time. It is also the UTC time standard we use.
Just in case your brain hasn’t been addled by all this talk of mathematics, there’s one more concept that might come in handy here on the high seas—a sine wave. Huh? Sine waves are a mathematical curve describing smooth repetitive oscillations. Like…tides, sonar pulses, sunrise/sunset observations, or the music booming out of your iPod.
Tide charts show a predictable, repeatable sine wave pattern.
I even use math to calculate how long I should run on the elliptical trainer down in the ship’s exercise space. If I set the resistance to 8, and use a cross training setting, it takes around 35 minutes to ‘run’ the equivalent of one slice of cake!
Here’s some of the exercise equipment on the ship.35 minutes or one slice of pie–whichever comes first!
Just in case you haven’t gotten the message—math is good. Number sense is critical—even if you want to run off to sea!
Personal Log
IT’S A FIELD TRIP!!
The entire Cold Bay School fits into this truck!
I love a field trip. There’s nothing like loading up in the bus and taking off in search of the great unknown. While we were parked at the Cold Bay pier, we had a visit from the Cold Bay School. The 8 students, plus their teacher and a classroom aide, came to check out the Rainier. CO Rick Brennan gave them a tour, starting at the bridge, and ending with lunch in the wardroom. Along the way, they learned about ships and ship life, NOAA, and the science of hydrography. Lunch was a real hit, since the kids all bring their own lunches to school. Who wouldn’t like halibut tacos with all the fixings from the galley, or a peanut butter and jelly sandwich handmade by Commander Rick Brennan with a fresh cookie for dessert?
Cold Bay students check out some of the ship’s BIG tools.
I tagged along on the tour to talk with some of the kids and their teacher and to compare notes about schools. While I always think of my school as small, with only 150 students, the school in Cold Bay is really small. There are 8 students and they represent grades 1 through 7. While the school is small, each student uses an iPad to access a wide variety of educational resources. It’s even better when that technology-based learning is supplemented by some hands-on field trip-based learning. This was their second field trip of the week; they had spent a day with a wildlife biologist helping install a motion-sensitive camera in the Izembek Wildlife Refuge (http://www.fws.gov/alaska/nwr/izembek/index.htm).
Future hydrographers head back to school.
SAFETY FIRST
Where I live, in Colorado, we occasionally get snow days, when the roads are too dangerous to transport children to school. Here at sea, we don’t worry too much about snow, but wind can create hazardous working conditions. Yesterday we had what I would call a ‘Wind Day’; none of the survey launches went out. The winds were gusting up to 50 knots, and were fairly steady at 30 knots. That’s windy. The surface of the bay was a froth of water, waves, and whitecaps. Even the Black-legged Kittiwakes were having trouble flying!
Whitecaps all across the bay. Definitely NOT a day to survey the sea floor.
Certainly not the sort of day where you want to send out teams of hydrographers in 28 foot long launches. While safety is paramount, data quality also suffers in such ‘bouncy’ seas. As the launch bounces from side to side or from front to back, the sonar sends its pings far afield. It becomes difficult or impossible to drive straight, overlapping lines as you ‘mow the lawn’ through your polygon (Wait, there’s another math term!) , and turning the craft requires timing and skill as you move through the rolling seas. As the Rainier nears the end of its time at sea and in Cold Bay, each day becomes critical to achieve its charting goals—but there’s plenty of work to do on board on a day like this.
NOAA Teacher at Sea Susy Ellison Aboard NOAA Ship Rainier September 9-26, 2013
Mission: Hydrographic Survey Geographic Area: South Alaska Peninsula and Shumagin Islands Date: September 18, 2013
Weather: current conditions from the bridge
You can also go the NOAA’s Shiptracker (http://shiptracker.noaa.gov/) to see where we are and what weather conditions we are experiencing.
GPS coordinates: 55o 12.442’ N 162o 41.735’ W
Temp: 9.6C
Wind Speed: 20.3 kts
Barometer: 994.01mb
Visibility: grey skies, foggy
Science and Technology Log
WHERE ARE WE? HOW DO WE KNOW?
As we float about all day collecting gigabytes of data to turn into charts, there’s ample time to reflect on the art and science of cartography, or map making. To me, maps are an elegant means for transforming the 3-dimensional landscape around us into a 2-dimensional story of our world using lines and points, geometric shapes, numbers, and a variety of colors and shadings. It’s science, technology, engineering, math, and, as always, a bit of magic! It’s quite amazing to think about the changes in mapmaking and our expectations for information from the first hand-drawn lines on small pieces of clay or in the dirt to the concatenated gigabytes of today.
Consider some of the earliest maps that have been found. Archaeologists have unearthed clay tablets in Babylonia that date back to 600 BC. These hand-sized clay tablets were simple line representations of local geography. Roman maps from around 350BC were utilized to provide information to conquering armies. Where were they heading; which villages were going to be conquered today?
The earliest maps were, both literally and figuratively, flat; they were a 2 dimensional image of a world that was believed to be flat. That changed in 240 BC when Eratosthenes, who believed the earth to be a sphere, calculated earth’s diameter by comparing the length of noontime shadows at distant sites. No advanced computing power was used for this calculation! Once geographers and cartographers were united in their use of a spherical representation of the earth, the next challenge was how to project that spherical surface onto a flat page. Ptolemy, sometime around 100 AD figured this out. He went a step further, assigning grid coordinates (latitude and longitude) to the maps to use as identifiers. His latitude lines, rather than expressed as degrees from the equator, were categorized by the length of the longest day—not such a bad proxy for degrees north and south and certainly an obvious change as you head north or south. Longitude, instead of referencing the Greenwich Meridian as 0o, was set at 0 at the westernmost point that he knew. Much of his work was not used until it was rediscovered by monks poring through manuscripts in the 1300s. One monk was able to use the coordinates in these manuscripts to create graphic representations (maps!) of Ptolemy’s concepts. These were printed in 1477 as a map collection known as Geographia. It is almost mind-boggling to consider the efforts that went into this volume from its initial intellectual conception, to its rediscovery, to using some of the first printing presses to make multiple copies that were used to plan and guide some of our most amazing voyages of discovery. Ptolemy’s concepts were further refined when Gerardus Mercator invented a cylindrical projection representing globe on a map’s flat surface. Each refinement both changed and enhanced our view of the planet.
Sailors set forth with maps using these concepts for many years, seeking out new lands and new wealth for the countries they represented. As they returned with new discoveries of continents, cultures, and meteorological conditions, they were able to replace some of the ‘dragons’ on maps with real information and add new layers of information on top of the positions of continents and oceans—an early sort of GIS (geographic information systems) process! In 1686, Edmond Halley created a map that incorporated the prevailing winds atop a geographical map of the world. A new layer of information that told a critical story. For a sailor navigating using the wind, the story this map told was incredibly useful. Further layers were placed on the surface geography as Johann Friedrich von Carpenter created the first geological map in 1778. This map included information about what was under the surface, including soils and minerals.
Halley’s map included information about global wind patterns. Pretty important if you’re on a sailboat navigating around the world!The first geological map included information about what lay below the surface http://earthobservatory.nasa.gov/IOTD/view.php?id=8733
To me, perhaps one of the fundamental changes in how we represented the earth came in 1782, when the first topographic map was created. Marcellin du Carla-Boniface added still more layers of information to our ‘flat’ surface, including contour lines that were like slices of the landscape whose spacing indicated the slope of the feature. Suddenly, we were going from a 3-dimensional world, to a 2-dimensional image, and back to a system of symbols to represent that third dimension. More data, more layers, more information on that one sheet held in your hand, and a more detailed ‘story’ of the landscape. Each cartographical and technological advance has enabled us to put more information, with increasing accuracy, upon our maps. Go one step further with this and click on Google Earth. A 3-dimensional view on a 2-dimensional screen of 3-dimensional data. Go one more step as you use your smartphone to display a 2-dimensional image taken from a 3-dimensional Google Earth view, made using layers of information applied to a flat map image. It’s a bit more sophisticated than the original flat clay tablet—but it basically ‘tells’ you how to get from here to there. While the complexity of our world has not actually increased, the stories we are telling about our planet have increased exponentially, as has our ability for combining datum from a variety of sources into one, tidy little package.
This is a small piece of the first topographic map which included elevation information about surface features http://www.datavis.ca/milestones/
A modern topographjic map, produced by USGS
THERE MAY BE DATA!
With each new technique and layer of information our ability to tell detailed stories with maps has improved. We can add data to our maps using colors—just look at a modern colorful weather map in USA Today if you want to see an example of this. Early cartographers used colors and shading to depict disease outbreaks or population numbers. Here on the Rainier, we use color variations to show relative depth as we survey the ocean floor. The final charts have lines to denote depth changes, just as lines on a land-based topographic map show changes in elevation.
So, you might be asking yourself at this point, ‘How does a history of mapping relate to mapping the coastline in SW Alaska?’ Why are we currently anchored out here near Cold Bay, Alaska? NOAA had its beginnings in 1807 when the first scientific agency, the Survey of the Coast, was established. Since then, NOAA’s mission has broadened to include the following “NOAA is an agency that enriches life through science. Our reach goes from the surface of the sun to the depths of the ocean floor as we work to keep citizens informed of the changing environment around them.” We are here as part of that mission, working through their National Ocean Service. You might not realize it, but almost every imported item you buy spent some part of its life on a ship. While Alaska’s coastline may seem a trifle remote, if you check out a map you might notice that it’s almost a straight shot from some of the ports in Asia to the west coast of the US.
Nautical chart showing the Cold Bay areaA Google Earth image of Cold BayTake a look at this map of the major world shipping routes. See how many pass near SW Alaska.
The Alaska Maritime Ferry also passes through these coastal areas on its way to towns and villages. While these areas are, indeed, remote, they are united by a common coastline. The Rainier, in over 40 years of ‘pinging’ its way northward each season from Washington and Oregon, has mapped this coastline. That, to me, is an amazing feat!
Think of where we’ve come in our ability to tell stories about our landscape and how the intersection of all those stories has played a part in creating the world in which we live. I, for one, still delight in the most simple of maps, drawn on a scrap of paper or the back of a napkin, showing someone how to get from point ‘a’ to point ‘b’. Those maps are personal, and include the layers of information that I think are important (turn left at this house, turn right at that hill, go 2 miles, etc) and that tell the story I want to tell. We now have the ability to add endless layers to our mapping stories, concatenating ever more data to tell an amazingly precise version. In spite of this sophistication I hope there’s still a few dragons left out there!
There still may be some dragons out there!!
If you want to know more, here’s some of the websites I looked at while researching this information:
For a great cartographic mystery, check out this book:
The Island of Lost Maps; A True Cartographic Crime by Miles Harvey
Personal Log
Today’s blog blends the scientific with the personal. Maps are both of these things; a way to categorize and document our planet in a methodical, reasoned, repeatable, and scientific manner, and a way to personalize our planet to tell a story that we want to tell. Cool stuff to think about as we drive back and forth across our little polygon here in Cold Bay. It puts our work into perspective and creates both a sense of its importance and its relevance to describing a piece of our planet. Hmmmm, in my next lifetime maybe I should be a hydrographer……
Student Driver!I might need to fine tune my driving skills before anyone really lets me be a hydrographer. Those white gaps are ‘holidays’–no data was collected.
NOAA Teacher at Sea Louise Todd Aboard NOAA Ship Oregon II September 13 – 29, 2013
Mission: Shark and Red Snapper Bottom Longline Survey Geographical Area of Cruise: Gulf of Mexico Date: September 19, 2013
Weather Data from the Bridge: Barometric Pressure: 1017.17mb
Sea Temperature: 28.8˚C
Air Temperature: 27˚C
Wind speed: 18.05 knots
Science and Technology Log:
Those of you following our progress on the NOAA Ship Tracker might have noticed some interesting movements of the ship. We had some rough weather that forced us to skip a station, and the current by the mouth of the Mississippi River also forced us to skip a station. The safety of everyone on board comes first so if the seas are too rough or the weather is bad we will skip a scheduled station and move to the next one. Now we are off the coast of Florida and hope we can get some good fishing done!
This survey is being done using longlines. Longlines are exactly as their name describes, long stretches of line with lots of hooks on them. The line we are using is 6,000 feet long, the length of one nautical mile. From that long line, there are 100 shorter lines called gangions hanging down with hooks on the end. Each gangion is 12 feet long.
Gangions in the barrel
When we arrive at a sampling station, everyone on our shift helps to set the line. In order to set the line, we have to bait each one of the hooks with mackerel.
Baited gangions ready to go
Once the hooks are baited, we wait for the Officer of the Deck (OOD), driving the ship from the bridge, to let us know that we are in position at the station and ready to start setting the line. The first item deployed is a high flyer to announce the position of our line to other boats and to help us keep track of our line.
High flyers ready to be deployed
This is a bottom longline survey so after the high flyer is deployed, the first weight is deployed to help pull the line to the bottom of the ocean just above the seabed. After the first weight is deployed, it is time to put out the first 50 hooks. This is typically a three person job. One person slings the bait by pulling the gangion from the barrel and getting ready to pass it to the crew member. Another person adds a number tag to the gangion so each hook has its own number.
Number clips are attached to each gangion
A member of the deck crew attaches each gangion to the main line and sends it over the side into the water. The gangions are placed 60 feet apart. The crew members are able to space them out just by sight! The bridge announces every tenth of a mile over the radio so they are able to double check themselves as they set the line. Another weight is deployed after the first 50 hooks. A final weight is placed after the last hook. The end of the line is marked with another high flyer. Once the line has been set, we scrub the gangion barrels and the deck. The line stays in the water for one hour.
Once the line has soaked for one hour, the fun begins! Haul back is definitely my favorite part! Sometimes it can be disappointing, like last night when there was absolutely nothing on the line. Other times we are kept busy trying to work up everything on the line. When the line is set and brought back in, everything is kept track of on a computer. The computer allows us to record the time and exact location that every part of the line was deployed or retrieved. The touchscreen makes it easy to record the data on the computer.
Computer ready to document what is on each hook
Personal Log:
It is nice to be doing some fishing! There have been some long distances in between our stations so my shift has not gotten the opportunity to set the line as much as we would like. I’m hopeful that the weather holds out for us so we can get a few stations in on our shift today. Being able to see these sharks up close has been amazing. I am enjoying working with the people on my shift and learning from each one of them. Before we haul back the line, I ask everyone what their guess is for number of fish on the line. My number has been 45 the past few haul backs and I’ve been wrong every time! Christine was exactly right on one of our last haul backs when she guessed two. I know I’ll be right one of these stations. It is hard to get pictures of what comes up on the line because we get so busy processing everything. I’m going to try to get more pictures of our next stations.
The views out in the Gulf are gorgeous. I never get tired of them!
Can you see the moon?Sunset over the Gulf
Did You Know?
When we arrive at a sampling station, the officer on watch must be aware of other ships and rigs in the area. At times the bridge watchstander will make the decision to adjust the location of our sampling station based on large ships or rigs in the area.
Rigs and other ships in the area of a sampling station can force us to move the station
NOAA Teacher at Sea John Clark Aboard NOAA Ship Henry B. Bigelow September 23 – October 4, 2013
Mission: Autumn Bottom Trawl Survey Geographical Area of Cruise: North Atlantic Date: September 18, 2013
Introduction
Thank you for reading about my adventures at sea. My name is John Clark and I’m entering my 7th year teaching science at Deltona High School in Deltona, Florida. Our community is just off I-4 between Orlando and Daytona Beach. Teaching is my second career, after working in the telecommunications field, and I love getting students excited about science. I’ve even earned a few awards for being successful at it. I’m married to the love of my life, Jill, who is also a teacher. In our lives are three grown children and seven grandchildren. With great blessings, I share that they are all healthy, happy, and live close enough for us to see them regularly. At home we have replaced the kids with two cats and a dog.
My wife Jill with grandson RionJills husband – me, John ClarkSabi dog in the pool with granddaughter Morgan
In a few days, anticipation will be replaced by action as I board a plane headed for my NOAA Teacher at Sea experience I’ve waited for all summer to begin. I’ll be sailing aboard NOAA Ship Henry B. Bigelow, a ship specially built for NOAA to carry out the type of fisheries research I’ll be taking part in. I’ll be working side by side with experienced scientists who not only are knowledgeable in how to do the research conducted on board but also have the skill to share their knowledge with volunteers like me who have limited background in the science behind the work. It is the experience of a lifetime that I hope will energize my students about studying science as we carry out lesson plans developed from the experience and I share with them the stories of my time at sea. I’m sure a giant boat-eating squid will be in there somewhere.
NOAA Ship Henry B. Bigelow
Officially, I’m taking part in 2013 Autumn Bottom Trawl Survey conducted by the Ecosystems Survey Branch of the NOAA Fisheries Service. That’s a long fancy way of saying that the ship is going to drag a net for a short period of time near the bottom of the ocean and then collect data on the types of fish we catch as well as the environment they live in. Affectionately called a “critter cruise”, I now join a long line of Teacher at Sea alumni who have taken part in the biannual surveys of North Atlantic marine life. And there are a lot of critters to learn to identify as I’m finding out from watching the CD I was sent to be better prepared to support the research team. There are two types of Dogfish which look suspiciously like little sharks, flounders that are left eyed or right eyed depending on which side they decided to leave up, and squid distinguished by the length of a pair of fins down the side of the body. All you do is hold them upright, tentacles hanging toward the ground, and take a look. And don’t forget the large lump fish which is described as have the texture of a dog’s chew toy. Whatever the species, the role of the research volunteer is to sort them out and then collect data for the scientists to study.
Scientists sorting a catch aboard the Bigelow
What can be overlooked in the preparation is the part about how to handle fish. I do not like to touch fish so I will be facing my fears even while wearing gloves. And I really don’t like it when they flop around. I envision I’ll be the one with the hand in the wrong place when the shark twists around to see who is holding its tail or, at a minimum, squeeze too hard on the species that will poke you with a poison spine if you upset them. Other good advice I’ve learned from the CD is that there is a 100% recovery from seasickness and if the seas get rough, wedge yourself into your bunk with your life vest so you don’t roll around and fall out. My two year old granddaughter, Ireland, was watching the video with me while I studied and all she could say was “Oh my.”
NOAA Teacher at Sea Britta Culbertson Aboard NOAA Ship Oscar Dyson September 4-19, 2013
Mission: Juvenile Walleye Pollock and Forage Fish Survey Geographical Area of Cruise: Gulf of Alaska Date: Saturday, September 15th, 2013
Weather Data from the Bridge
Wind Speed: 11kts
Air Temperature: 12.2 degrees C
Relative Humidity: 87%
Barometric Pressure: 1010.7 mb
Latitude: 59 degrees 26.51″ N Longitude: 149 degrees 47.53″ W
Science and Technology Log
Finally, as we near the end of the cruise, I’m ready to write about one of the major parts of the survey we are doing. Until now, I’ve been trying to take it all in and learn about the science behind our surveys and observe the variety of organisms that we have been catching. In my last few entries, I explained the bongo net tow that we do at each station. Immediately after we finish pulling in the bongo nets and preparing the samples, the boat repositions on the station and we begin a tow using an anchovy net. It gets its name from the size of fish it is intended to capture, but it is not limited to catching anchovies and as you will see in the entry below, we catch much more than fish.
Why are we collecting juvenile pollock?
We are interested in measuring the abundance of juvenile pollock off of East Kodiak Island and in the Semidi Bank vicinity. We are not only focusing on the walleye pollock, we are also interested in the community structure and biomass of organisms that live with the pollock. Other species that we are measuring include: capelin, eulachon, Pacific cod, arrowtooth flounder, sablefish, and rockfish. As I described in the bongo entries, we catch zooplankton because those are prey for the juvenile pollock.
On the top is an age 2+ pollock, below that an age 1 pollock, and then below that is an age zero pollock. (Photo credit: John Eiler)
The Gulf of Alaska juvenile walleye pollock study used to be conducted every year, using the same survey grid. Now the Gulf of Alaska survey is conducted every other year with the Bering Sea surveyed in alternating years. That way, scientists can understand how abundant the fish are and where they are located within the grid or study area. With the data being collected every year (or every other year), scientists can establish a time series and are able to track changes in the population from year to year. The number of age 0 pollock that survive the winter ( to become age 1) are a good indicator of how many fish will be available for commercial fisheries. NOAA’s National Marine Fisheries Service (NMFS) will provide this data to the fisheries industry so that fishermen can predict how many fish will be available in years to come. The abundance of age one pollock is a good estimate of fish that will survive and be available to be caught by fishermen later, when they reach age 3 and beyond, and can be legally fished.
The other part of our study concerns how the community as a whole responds to changes in the ecosystem (from climate, fishing, etc.). That is why we also measure and record the zooplankton, jellyfish, shrimp, squids, and other fish that we catch.
How does it work?
The anchovy net (this particular design is also called a Stauffer trawl) is pretty small compared to those that are used by commercial fishermen. The mesh is 5 millimeters compared to the 500 micrometer mesh that we used for the bongo. The smallest organisms we get in the anchovy net are typically krill.
A picture of a generic trawling net. It’s very similar to the anchovy net that we are using.
Typically, we don’t catch large fish in the net, but there have been some exceptions. You might wonder why larger fish do not get caught in the net. It’s because the mesh is smaller and it’s towed through the water very slowly. Fish have a lateral line system where they can feel a change in pressure in the water. The bow wave from the boat creates a large pressure differential that the fish can detect. Larger fish are usually fast enough to avoid the net as it moves through the water, but small fish can’t get out of the way in time. One night we caught several Pacific Ocean Perch, which are larger fish, but very slow moving. They are equipped with large spines on their fins and are better adapted to hunkering down and defending themselves as opposed to other fish that are fast swimmers and great at maneuvering.
This is one of the Pacific Ocean Perch (rockfish) that got caught in our net.
When we pull in the trawl net, it is emptied into buckets and then the haul is sorted by species and age class. The catch is then measured, weighed, and recorded on a data sheet. After that, we return most of the fish to the sea and save 25 of the juvenile pollock, capelin, and eulachon to take back to Seattle for further investigation. We also save some of the smaller flatfish and sablefish to send back to Seattle. Check out the gallery below to see the process from beginning to end.
This slideshow requires JavaScript.
Where are the pollock in the food web?
Eulachon and capelin are zooplanktivores and compete with the juvenile pollock for food. Larger eulachon and capelin are not competitors (those over 150 mm). Arrowtooth flounder and Pacific Cod are predators of the juvenile walleye pollock. Cyanea and Chrysaora jellyfish are also zooplanktivores and could potentially compete with juvenile walleye pollock, so that is why we focus on these particular jellyfish in our study.
This Cyanea jelly weighed 11.6 kilograms!
One of the most common jellies that we see, Cyanea or Lion’s Mane Jelly.
Chrysaora
What’s in that net?
When we pull in the trawl, we sort it into piles of different species and different age classes. If we get a lot of juvenile pollock (age 0), we measure and weigh 100 and freeze 25 to take back to the lab so their stomach contents can be examined. We do the same procedure for young capelin, eulachon, and flatfish. Other organisms like jellyfish are counted and weighed and put back in the ocean.
Below is a list of different organisms we have found in the anchovy net during this cruise:
Every once in a while we find Pacific Cod juveniles, which look very similar to juvenile pollock.
A pink salmon that made its way into our net.
Sometimes all we catch in the net are jellies!
The top two arrowhead flounders are facing up and the bottom one is upside down. Notice the color variation. In flounders, both of the eyes have migrated to the top of the head.
A small pile of krill that was in our anchovy net.
Sometimes we net jellies and sometimes we net kelp, but we are really looking for pollock!
These are the larval stage of a fish belonging to the family Osmeridae. They are likely Capelin or Eulachon.
Small flatfish larvae.
Sand fish found in the trawl. Note the upward pointing mouth. (Photo credit: John Eiler)
A teeny tiny octopus! (Photo credit: John Eiler)
Herring (Photo credit: John Eiler)
Here I am holding a large arrowtooth flounder that was in our trawl.
The sharp teeth of an arrowtooth flounder.
The top fish is a Eulachon, the next is a Capelin, followed by a larval osmerid (could be a Capelin) and lastly, an age zero pollock.
Personal Log
As we wind down the cruise, I’m feeling a little sad that it’s ending. I’m looking forward to going home and seeing my husband and our dog, but I’ll miss the friends I’ve made on the ship and I’ll certainly miss collecting data. Even though it can be quite repetitive after awhile, I can’t think of a more beautiful place to do this work than the Gulf of Alaska. The last few days we have had a couple of stations near the coastline around Seward, Alaska and we have ventured into both Harris Bay and Resurrection Bay. There we caught sight of some amazing glaciers and small islands. There was even an island that had bunkers from WWII on it. Yesterday, 3 Dall’s Porpoises played in our bow wake as I stood on the bridge and watched. It’s moments like this that all of the discomforts of being at sea fall away and I can reflect on what an incredible experience this has been!
Beautiful scenery from Resurrection Bay.Three Dall’s porpoises that were playing in our bow wake.
Did You Know?
Spiny lumpsuckers are tiny, cute, almost spherical fish that have a suction disk on their ventral (bottom) side. The suction disk is actually a modified pelvic fin. They use the suction disk to stick to kelp or rocks on the bottom of the ocean.
Their family name is Cyclopteridae (like the word Cyclops!). It is Greek in origin. “Kyklos” in Greek mean circle and “pteryx” means wing or fin. This name is in reference to the circle-shaped pectoral fins that are possessed by fish in this family.
These lumpsuckers are well camouflaged from their predators and their suction disk helps them overcome their lack of an air bladder (this helps fish move up and down in the water). Because lumpsuckers don’t have an air bladder, they are not great swimmers.
Spiny lumpsuckers are on average about 3 cm in length, but there are larger lumpsuckers that we have found, like the toad lumpsucker that you can see in the photo below.
NOAA Teacher at Sea Louise Todd Aboard NOAA Ship Oregon II September 13 – 29, 2013
Mission: Shark and Red Snapper Bottom Longline Survey Geographical Area of Cruise: Gulf of Mexico Date: September 16, 2013
Weather Data from the Bridge: Barometric Pressure: 1014.01mb
Sea Temperature: 28.8˚Celsius
Air Temperature: 29.9˚C
Wind speed: 19.22 knots
Science and Technology Log:
Oregon II (Photo Credit NOAA)
We left Galveston a little before 2pm on Sunday, September 15. We were in transit to our first sampling location and should arrive there around 8pm tonight. Depending on the conditions we might actually be able to do some fishing tonight!
Today we went through our abandon ship drill. The ship’s alarm is used to alert everyone on board in the event of an emergency. Abandon ship is indicated by 7 short rings followed by one long ring of the alarm. When the alarm sounds with the abandon ship signal, we must carry our survival suits, personal flotation devices (PFDs), long pants, a hat and a long-sleeved shirt to the well deck, at the bow (front) of the ship. My survival suit and personal flotation device (PFD) are kept in cabinets in my room. The survival suit is tricky to get on and it gets very, very warm when you are wearing it!
In my survival suit (Photo Credit Lisa Jones)
Personal Log:
During this initial transit, there hasn’t been much for me to do. I spent a lot of time sleeping on Sunday. The way the waves rock the ship back and forth makes me very sleepy! I have taken a few short naps today in order to be ready in case we do any fishing on the later part of my shift tonight. I am on the day shift which means I will work noon to midnight. I think it will take me some time to get used to staying up that late but I think these naps will help! As we start fishing the days will be much busier for me so staying awake will be easy I hope. The views off of the ship are amazing. I was surprised to see how blue the water gets.
View off the Oregon II
My stateroom is very comfortable and I have plenty of space in drawers and cabinets for everything I brought with me. I am getting used to latching doors and drawers behind me so they do not slam back and forth as the ship rocks. On the ship there is always someone sleeping so everyone works hard to be courteous and stay quiet.
My stateroom
My roommate is an officer on the ship so we are usually in the room at different times. Officers on NOAA ships are part of the NOAA Corps. Roommates are usually assigned based on the shifts people are working so each person has some time alone in the room. As we start fishing more I will bring my computer and other items I might want throughout the day into one of the labs on the ship so I won’t have to go in and out of the room when my roommate might be sleeping. The curtains are helpful in blocking out any light that might prevent you from sleeping. The showers are right next to my room which is convenient and the common head (bathroom) is just around the corner.
There are plenty of food choices in the galley on the ship and everything has been delicious. In the mornings you can even get eggs made to order! I certainly don’t think I will be going hungry!
Did You Know?
Even in the warmer waters of the Gulf of Mexico, hypothermia is risk due to the difference in water temperature and our body temperatures. The survival suit helps to protect our bodies from the difference in temperature.
NOAA Teacher at Sea Susy Ellison Aboard NOAA Ship Rainier September 9-26, 2013
Mission: Hydrographic Survey Geographic Area: South Alaska Peninsula and Shumagin Islands Date: September 13, 2013
Weather: current conditions from the bridge
You can also go to NOAA’s Shiptracker (http://shiptracker.noaa.gov/) to see where we are and what weather conditions we are experiencing
GPS Reading: 55o 15.037’ N 162o 38.025’ W
Temp: 10.44C
Wind Speed: 9.8 kts
Barometer: 1021.21 mb
Visibility: foggy on shore
Science and Technology Log
Since leaving Kodiak 5 days ago, I have been immersed in a hydrographic wonderland. Here’s what I’ve learned, summed up in two words (three, if you count the contraction); it’s complicated. Think about it. If I asked you to make a map of the surface of your desk you could, with a little bit of work and a meter stick, make a reasonably accurate representational diagram or map of that surface that would include the flat surface, as well as outlines of each item on the surface and their heights relative to that surface, as well as their location relative to each other on a horizontal plane. You might want to get fancy and add notes about the type of surface (is it wood, metal, or some sort of plastic), any small irregularities in that surface (are there some holes or deep scratches—how big and how deep?), and information about the types of objects on the desk top (are they soft and squishy, do they change location?). Now, visualize making this same map if your desktop was underwater and you were unable to actually see it. Not only that, the depth of the water over your desktop can change 2 times each day. If that isn’t complicated enough, visualize that the top of the water column over your desk is in constant motion. OK, not only all those variables, but pretend you are transformed into a very teeny person in a small, floating object on that uncertain water over the top of your desk trying to figure out how to ‘see’ that desktop that you can’t actually see with your own eyes? Welcome to the world of the hydrographer; the challenge of mapping the seafloor without actually touching it. It is, indeed, a complex meld of science, technology, engineering, and math (STEM, in educational parlance), as well as a bit of magic (in my mind).
How do you know what’s down there?
Challenge number one—how do you measure something you can’t see or touch with your own hands? Long ago, sailors solved that obstacle by using a lead line; literally, a line with a lead weight attached to the end. They would drop the weighted line over the side of their ship to measure the depth. These soundings would be repeated to get enough data to provide a view of the bottom. This information was added to their maps along with estimates of the horizontal aspects (shoreline features and distance from the shoreline) to create reasonably good charts that kept them off most of the underwater obstacles. A simple solution to a complex problem. No electricity required, no advanced degrees in computer science needed, no calculus-based physics necessary. Fast- forward to 2013 and the world of complex calculations made possible by a variety of computer-based algorithmic calculations (i.e. some darn fancy computing power that does the math for you). The NOAA Ship Rainier’s hydrographers use sound as their lead line, traveling in small boats known as launches that are equipped with multibeam sonar that send a series of sound ‘pings’ to the ocean floor and measures the time between sending and receiving the ping back after its trip to the bottom. Sounds simple enough, doesn’t it? If it were all that simple I wouldn’t be typing this in a room on the Rainier filled with 20 computer monitors, 10 hard drives, and all sorts of other humming and whirring electronic devices. Not only that, each launch is equipped with its own impressive array of computer hardware.
One of the launches is lowered from the ship.
So far on our survey days 2 launches have been sent out to cover identified transects. Their onboard crew includes a coxswain (boat driver), as well as 2-3 survey technicians and assistants. Each launch is assigned a polygon to survey for the day.
EVERY PING YOU TAKE…
Once they arrive at their assigned area, it’s time to ‘mow the lawn’—traverse back and forth systematically collecting data from one edge of your assigned polygon to the other until the entire area has been surveyed. Just in case you haven’t realized it yet, although that sounds pretty straightforward, it isn’t. Is the area shallow or deep? Depth affects how much area each traverse can cover; the sonar spreads out as it goes downward sending it’s little pings scampering to the ocean floor. Visualize an inverted ‘V’ of pings racing away from the sonar towards the sea floor. If it’s deep, the pings travel further before being bounced back upwards. This means that the width of each row the sonar cuts as it “mows the lawn” is wider in deeper water, and narrower in shallow. Shallower areas require more passes with the launch, since each pass covers a more limited area than it might if the water were deeper. As the launch motors back and forth ‘mowing the lawn’, the sonar signature is recorded and displayed on monitors in the cabin area and in front of the driver. Ideally, each lap overlaps the previous one by 25-50%, so that good coverage is ensured. This requires a steady hand and expert driving skills as you motor along either over or parallel to ocean swells. All you video gamers out there, take note–add boat driving to the repertoire of skills you might need if you want to find a job that incorporates video gaming with science!
One of the monitors displays the sonar. The green line is the seafloor. This image shows that the deeper the sea, the wider the swath that is covered with each pass of the launch.Calvin Burch uses a computer monitor to guide him as he drives the launch. It’s an art to ‘mow’ in straight lines while anticipating every roll and bounce of the ocean’s surface.
Here’s a small list of some of the variables that need to be considered when using sonar to calculate depth; the chemistry of the water column through which you are measuring, the variability of the water column’s depth at specific times of day, the general depth (is it shallow or deep), and the movement of the measuring device itself. So many variables!!
Starla Robinson and Randy Shingledecker set up the program that will enable them to monitor our progress
HOW FAST DOES SOUND TRAVEL?
When you’re basing your charts on how sound travels through the water column, you need to look at the specific characteristics of that water. In a ‘perfect world’, sound travels at 1500m/second through water. In our real world, that speed is affected by salinity (the concentration of salts), temperature, and depth (water pressure). The survey crew uses a CTD meter to measure Conductivity, Temperature, and Depth. The CTD meter is deployed multiple times during the day to obtain data on these parameters. It is attached to a line on the rear of the launch, dropped into the water just below the surface for 2 minutes, and then lowered to near the ocean floor to collect data. After retrieval, it’s hooked to the computer on the launch to download the data that was collected. That data is stored in its own file to use when the data is reviewed in the evening back on board the Rainier. This is one of the variables that will be applied to the sonar data file—how fast was the sound moving through the water? Without this information to provide a baseline the sonar data would not be accurate.
Randy Shingledecker gets ready to send the CTD over the side. It’s clipped into a stout line and a reel for lowering it.The CTD is lowered to just above the seafloor to collect data on Conductivity, Temperature, and Depth. This data will be applied to our sonar data to obtain an accurate sound speed for this area.
ROCKING AND ROLLING…
When you’re out on the ocean in a boat, the most obvious variable is the instability of the surface, itself. This is called ‘attitude’. Attitude includes changes to the boat’s orientation fore and aft (pitch), side-to-side (roll), and up and down (heave) as it is gently, and not-so-gently rocked by ocean swells and waves. This means that the sonar is not always where you think it is in relation to the seafloor. This is like trying to accurately measure the height of something while you, the measurer, are on a surface that is constantly moving in 3 different directions. Good luck. Luckily for this crew of hydrographers, each boat is equipped with a little yellow box whose technical name is the IMU (inertial measurement unit) that I call the heave-o-meter, as we bob up and down on this might ocean. This little box contains 3 gyroscopic sensors that record all those forward and backward pitches, sideways rolls, as well as the bobbing up and down motions that the boat does while the sonar is pinging away. This information is recorded in the launch’s computer system and is applied to the sonar data during analysis back at the Rainier.
This yellow box is the IMU. It’s internal gyros capture information about the boat’s pitch, roll, and heave.
TIME AND TIDE…
Now that you’ve gotten your launch to the correct polygon (using GPS data to pinpoint your location), taken CTD readings to create a sound transmission profile for your transect area, and started up the heave-o-meter to account for rocking and rolling on the high seas, it’s time to start collecting data. Wait—there’s still another variable to think about, one that changes twice daily and affects the height of the water column. You also have to factor in changes in the depth of the water due to tidal changes. (for an in-depth look at how tides work, check out this link: http://oceanservice.noaa.gov/education/kits/tides/tides01_intro.html). At high tide, there’s a greater likelihood that subsurface obstacles will be covered sufficiently. At low tide, however, it’s pretty important to know where the shallow spots and rocks might lurk. NOAA’s hydrographers are charting ocean depths referenced to mean lower low water, so that mariners can avoid those low-water dangers.
You might be asking yourself, who keeps track of all that tide data and, not only that, how do we know what the tide highs and lows will be in an area where there are no other tide gauges? NOAA has tide gauges along many coastal areas. You can go online to http://tidesandcurrents.noaa.gov/and find out predicted tide heights and times for any of these locations. While we are working here in Cold Bay, we are using a tide gauge in nearby King Cove, as well as a tide gauge that the Rainier’s crew installed earlier this summer. More data is better.
Here’s the tide chart from the King Cove tide gauge.
What do you do if you’re surveying in an area that doesn’t have existing tide gauges? In that case, you have to make your own gauge that is referenced to a non-moving point of known elevation (like a rock). For a detailed description of how these gauges are set, check out NOAA TAS blogs from some of the teachers who preceded me on the Rainier. On Wednesday, I helped dismantle a tide gauge on Bird Island in the Shumagin Islands that had been set up earlier this season (check out TAS Avery Martin’s July 12th posting), but had ceased to report reliable data. Our mission on Wednesday was to find out if the station had merely stopped reporting data or if it had stopped collecting data entirely.
Setting off in a skiff to check on the Bird Island tide gauge.
When we arrived at Bird Island we found out exactly why the gauge had stopped sending data—its battery bank had fallen from one rocky ledge to another, ripping apart the connections and breaking one of the plastic battery boxes in the process. That took a lot of force—perhaps a wave or some crazy gust of wind tore the 3 batteries from their mooring. Since each battery weighs over 25lbs, that means that something moved over 75lbs of batteries. Ideally, the station uses solar panels to keep the batteries charged. The batteries power up the station so that data can be sent to a satellite. Data is also stored on site in a data logger, but without power that data logger won’t work.
This is the data logger for the tide gauge. It is housed in a watertight box and was retrieved for downloading on the ship.
We retrieved all the equipment and will be able to download whatever data had been recorded before the system broke. The automated tide gauge is, basically, a narrow diameter air-filled tube that is underwater and set at a fixed depth with a narrow opening pointed downward to the seafloor. The pressure required to balance the air in the tube is equal to the pressure of the water column directly above the opening. The tide gauge measures this pressure and converts it to depth. Pressure/depth changes are recorded every six minutes—or ten times each hour. As it turns out, the damaged battery bank was only one of the problems with this station. Problem number two was discovered by the dive team that retrieved the underwater portion of the gauge; the hose had been severed in two locations. In this case, something had caused the tube to break, so it was no longer connected to the data logger. That must have been some storm!
ENS Carrier inspects the battery bank that rests on a rock ledge 2 feet below where it had been placed weeks ago!The waterproof battery boxes were broken in the tumble.The solar panels that charged the batteries were intact, still tied into bolts in the rocks.The dive crew gets ready to jump inBrrr, it’s chilly work diving in arctic waters. The divers are investigating the gauge and removing the damaged hose
While there, we set to work checking on benchmarks that had been set earlier in the season. We used a transit and survey rods (oversized rulers) to measure the relative heights of a series of benchmarks to ensure accuracy. There are 5 benchmarks along the beach. Each one was surveyed as a reference to the primary benchmark nearest the gauging station. Multiple measurements help ensure greater accuracy.
I am holding the survey rod on top of a benchmark.
I used a level to make sure the rod was plumb–perpendicular to the benchmark. No easy feat with a strong wind blowing!
We also were tasked with checking the primary benchmark’s horizontal location. While this had been carefully measured when it was set back in July, it’s important to make sure that it hasn’t moved. It might seem a crazy concept to think that a benchmark cemented into a seemingly immovable piece of rock could move, but we are in a region that experiences seismic events on an almost daily basis. (You can check out seismic activity at http://www.aeic.alaska.edu/) NOAA Corps Officer ENS Bill Carrier set up a GPS station at the benchmark to collect 4 hour’s data on its position, a process called HORCON (horizontal control). Unfortunately, the winds were in charge of how much data we were able to collect that day, and blew down the station after only 3 hours! [image of station down] Sometimes the best laid plans …..
A gust of wind blew the recording station down.
DATA, DATA, and MORE DATA
While data collection is important, it’s what you do with the data that really gets complicated. Data management is essential when working with so many files and so many variables. Before each launch returns to the Rainier, the day’s data is saved onto a portable hard drive. Immediately after being hauled back up onto the ship, the data is handed off to the ‘Night Processing Team’ and hustled off to the Plotting Room (computer HQ) to be uploaded into a computer. This is where the magic happens and an advanced degree in computer science or GIS (geographic information systems) can come in handy. I have neither of those qualifications, but I know how to read a screen, click a mouse, and follow directions. So, on Friday evening I was ushered into the ranks of ‘night processor’.
When each launch returns to the ship, their day’s data is saved onto a hard drive. This drive is transported to the plotting room to download onto the computer.
First, data is downloaded into the main computer. Each launch’s files are called raw data files and are recorded in the launch’s acquisition logs. Once the data is on the computer, it is important to set up what I call a ‘file tree’; the series of files that increase in specificity. This is analogous to having an accurate list of what files live within each drawer and section of your file cabinet. These files are color-coded according to the operations manual protocols to minimize the chance of misfiling or the data. They are definitely more organized than the files on my laptop—I might change my lackadaisical filing ways after this trip!
Once the data are placed in their folders, the fun begins. Remember, you have files for multiple variables; sonar, CTD casts, the IMU Heave-o-meter, and tide data. Not only that, you have, with any luck, performed multiple casts of your CTD meter to obtain accurate data about the conditions affecting sound wave transmission within your polygon. Now you get to do something I have never done before (and use a vocabulary word I never knew existed and one that I might try to spell in a future Scrabble game); you concatenate your CTD data. Basically, you put the data from all your CTD casts together into one, neat little file. Luckily, the computer program that is used does this for you. Next, you direct the program to add all the variables to your sonar files; the concatenated CTD data, tide data, and IMU data.
Survey Tech Brandy Geiger and NOAA Corpsman ENS Wall begin to upload the data and organize it into files.
Assuming all goes well and you have merged all your files, it’s time to ‘clean’ your data and review it to make sure there are no obvious holes or holidays in the data that was collected. Holidays can occur if the launch was bouncing too much from side to side during data collection and show up as a blank spot in the data because the sonar was out of the water and not pinging off the bottom. You can identify these holidays during the data collection process [holiday signature], but sometimes there are smaller holidays that show up once the data is merged and on your computer screen. There can also be miscellaneous errant pings caused by debris in the water column. Cleaning involves systematically searching each line of your surveyed polygon to identify and delete those ‘bad’ pings. Kind of like photoshopping away the parts of a digital image that you don’t want in the final image. You work methodically in a grid pattern from left to right and top to bottom to ensure that you are covering the whole file. It sounds easy, but to a non-PC person such as myself all that right click, left click, center click stuff was a bit boggling. The program is amazingly complex and, rumor has it, a little bit ‘buggy’ at times.
Multiple screens, multiple tasks. I am learning the art of ‘cleaning’ the data–getting rid of extraneous pings.
After all this, guess what?! You still don’t have a chart. It takes almost 2 years to go from data collection to chart publication. There’s endless amounts of data compilation, reports to be written, and quality control analysis to be completed before the final report and charts are issued.
Personal Log
So far I have spent two nights on the ship ‘in transit’, moving between ports. The other nights have been spent anchored offshore. While the first night at sea was a little bouncy, the second was, in my opinion, the wildest roller coaster ride I have ever taken. Imagine being pulled to the top of a high roller coaster, and released to fly down to the bottom while you are lying flat in your bed. That’s what it felt like as we motored from the Shumagin Islands to an anchorage in Cold Bay. An endless series of up, up, ups, followed by a wild ride down, down, down. Luckily all the drawers and doors have latches that keep them from flying open—although I had a jacket hanging on a hook that seemed to hit the latch on one closet door and actually knock it open—after this happened a couple of times I gave up and put the coat on the floor and firmly shut the door. My bathroom trash can ended up in the shower stall. At one point I heard a loud thump in the dark—and realized my survival suit in its orange bag had fallen from the top bunk to the floor—glad I wasn’t in its way! It was time to just hang on and try not to roll out of bed.
If your chair isn’t tied down, put tennis balls over the wheels to keep it from rolling!Strap the printer tightly to a table!Don’t forget to secure the trashcans!
We finally stopped rocking and rolling around 3 in the morning. I thought maybe I was just a bit sensitive to the rocking motion, but was comforted to find out the everyone agreed that it had been a wild night. In fact, one of the potential ‘hazards’ for our work on Thursday was ‘lack of sleep’.
FOO LT Meghan McGovern goes over the Plan of the Day (POD). Today’s identified hazards included ‘Lack of Sleep’.
After almost a week aboard the Rainier I have been impressed with the teamwork, precision, and overall efficiency which overlays all operations. This crew can get a launch loaded, lowered, and underway in less time than it sometimes takes me to record my morning attendance at school! This is no simple feat (the boat, not the attendance!). It reminds me of a buzzing beehive filled with activity and focused on a single task; data collection. Each day begins on the fantail (the rear of the boat) at 0800 with the FOO (Field Operations Officer) reviewing the POD (Plan of the Day) and a summary of the day’s goals, work assignments, weather, and potential hazards, prior to sending out the survey crews.
The Boatswain (bo’sun) directs the next part of this tightly choreographed activity, as the launches are lowered by their davits (small cranes), while lines and hooks are handled with an eye to safety and efficiency. Within 5 minutes the two launches have been lowered, loaded with crew and supplies, and are on the water, buzzing away from the hive like bees to perform their daily waggle dance as they move back and forth collecting hydrographic data.
At 1630 they return to the hive, filled with the sweet nectar of hydrographic data. Launches are lifted back onto the ship and the data is whisked off to the computer room for downloading. 5 Minutes later a survey team debrief is held to review work accomplished that day and any problems that may have come up so that plans can be made for the next day’s work. This crew is organized!!
NOAA Teacher at Sea Britta Culbertson Aboard NOAA Ship Oscar Dyson September 4-19, 2013
Mission: Juvenile Walley Pollock and Forage Fish Survey Geographical Area of Cruise: Gulf of Alaska Date: Wednesday, September 12th, 2013
Weather Data from the Bridge (for Sept 12th, 2013 at 9:57 PM UTC):
Wind Speed: 23.05 kts
Air Temperature: 11.10 degrees C
Relative Humidity: 93%
Barometric Pressure: 1012.30 mb
Latitude: 58.73 N Longitude: 151.13 W
Science and Technology Log
A humpback whale. (Photo credit: NOAA)
We have been seeing a lot of humpback whales lately on the cruise. Humpback whales can weigh anywhere from 25-40 tons, are up to 60 feet in length, and consume tiny crustaceans, plankton, and small fish. They can consume up to 3,000 pounds of these tiny creatures per day (Source: NOAA Fisheries). Humpback whales are filter feeders and they filter these small organisms through baleen. Baleen is made out of hard, flexible material and is rooted in the whale’s upper jaw. The baleen is like a comb and allows the whale to filter plankton and small fish out of the water.
This whale baleen is used for filter feeding. It’s like a small comb and helps to filter zooplankton out of the water. (Photo credit: NOAA)
I’ve always wondered how whales can eat that much plankton! Three thousand pounds is a lot of plankton. I guess I felt that way because I had never seen plankton in real-life and I didn’t have a concept of how abundant plankton is in the ocean. Now that I’m exposed to zooplankton every day, I’m beginning to get a sense of the diversity and abundance of zooplantkon.
In my last blog entry I explained how we use the bongo nets to capture zooplankton. In this entry, I’ll describe some of the species that we find when clean out the codends of the net. As you will see, there are a wide variety of zooplankton and though the actual abundance of zooplankton will not be measured until later, it is interesting to see how much we capture with nets that have 20 cm and 60 cm mouths and are towed for only 5-10 minutes at each location. Whales have much larger mouths and feed for much longer than 10 minutes a day!
Cleaning the codends is fairly simple; we spray them down with a saltwater hose in the wet lab and dump the contents through a sieve with the same mesh size as the bongo net where the codend was attached. The only time that this proves challenging is if there is a lot of algae, which clogs up the mesh and makes it hard to rinse the sample. Also, the crab larvae that we find tend to hook their little legs into the sieve and resist being washed out. Below are two images of 500 micrometer sieves with zooplankton in them.
A mix of zooplankton that we emptied out of the codend from the bongo.Crab larvae (megalopae) that we emptied out of the codend.
Some of the species of zooplankton we are finding include different types of:
Megalopae (crab larvae)
Amphipods
Euphausiid (krill)
Chaetognaths
Pteropods (shelled: Limasina and shell-less: Clione)
Copepods (Calanus spp., Neocalanus spp., and Metridea spp.)
Larval fish
Jellyfish
Ctenophores
The other day we had a sieve full of ctenophores, which are sometimes known as comb jellies because they possess rows of cilia down their sides. The cilia are used to propel the ctenophores through the water. Some ctenophores are bioluminescent. Ctenophores are voracious predators, but lack stinging cells like jellyfish and corals. Instead they possess sticky cells that they use to trap predators (Source: UC Berkeley). Below is a picture of our 500 micrometer sieve full of ctenophores and below that is a close-up photo of a ctenophore.
A sieve full of ctenophores or comb jellies.A type of ctenophore found in arctic waters. (Photo credit: Kevin Raskoff, MBARI, NOAA/OER)
It’s fun to compare what we find in the bongo nets to the type of organisms we find in the trawl at the same station. We were curious about what some of the fish we were eating, so we dissected two of the Silver Salmon that we had found and in one of them, the stomach contents were entirely crab larvae! In another salmon that we dissected from a later haul, the stomach contents included a whole capelin fish.
Juvenile pollock are indiscriminate zooplanktivores. That means that they will eat anything, but they prefer copepods and euphausiids, which have a high lipid (fat) content. Once the pollock get to be about 100 mm or greater in size, they switch from being zooplanktivores to being piscivorous. Piscivorous means “fish eater.” I was surprised to hear that pollock sometimes eat each other. Older pollock still eat zooplankton, but they are cannibalistic as well. Age one pollock will eat age zero pollock (those that haven’t had a first birthday yet), but the bigger threat to age zero pollock is the 2 year old and older cohorts of pollock. Age zeros will eat small pollock larvae if they can find them. Age zero pollock are also food for adult Pacific Cod and adult Arrowtooth Flounder. Older pollock, Pacific Cod, and Arrowtooth Flounder are the most voracious predators of age 0 pollock. Recently, in the Gulf of Alaska, Arrowtooth Flounder have increased in biomass (amount of biological material) and this has put a lot of pressure on the pollock population. Scientists are not yet sure why the biomass of Arrowtooth Flounder is increasing. (Source: Janet Duffy-Anderson – Chief Scientist aboard the Dyson and Alaska Fisheries Science Center).
The magnified images below, which I found online, are the same or similar to some of the species of zooplankton we have been catching in our bongo nets. Click on the images for more details.
A chaetognath found in the Bering Sea. (Photo credit: Dave Forcucci, NOAA)
A type of euphausiid called Thysanoessa raschii. (Photo credit: WoRMS Database)