Trevor Hance: Water, Water Everywhere… Time for a Bath(ology), June 17, 2015

NOAA Teacher at Sea
Trevor Hance
Aboard R/V Hugh R. Sharp
June 12 – 24, 2015

Mission: Sea Scallop Survey
Geographical area: New England/Georges Bank
Date: June 17, 2015

Science and Technology Log

We’re now at the half-way point of this journey and things continue to run well, although the weather has picked up a bit.  I mentioned to one of my fellow crew members that the cloud cover and cool weather reminded me of “football and gumbo” and he said, “Yeah… around here, we just call it ‘June’.” Touché, my friend.

“June,” huh…. Hey, this guy got jokes!

I am continually impressed by both the ship’s crew and the science party’s ability to identify work that needs to be done and set a course towards continued, uninterrupted success of the mission.  The depth and breadth of knowledge required to navigate (all puns intended!) extended scientific expeditions requires professional dedication matched with a healthy sense of humor, and it is truly an honor to be invited to participate in this unique opportunity for teachers. I am learning volumes each day and will forever treasure this wonderful adventure.  Thanks again, NOAA!

Remember students, don’t kiss frogs.  Gigantic lobsters?  Well…
Remember students, don’t kiss frogs. Gigantic lobsters? Well…

Science and Math

My instructional path is rooted in constructivist learning theory, and I work diligently to secure resources for my students to have authentic, project-based learning experiences where they determine budgets, necessary tools and physically build things that we use on our campus.

Most recently, my math class designed and built some raised mobile garden beds that will be used by the youngest students on our campus as well as those with unique mobility challenges.  Through these hands-on learning experiences, I expect my students to develop a solid working-level of mathematic and scientific literacy, and I’m proud of the fact that when I present a new concept, my students never ask “When am I going to have to use this in real life?”

My students doing math.  More doing, more learning...
My students doing math. More doing, more learning…

I believe fifth grade students can understand any science concept, and I am seeing additional opportunities to test that idea using what I learn out here, so thought I’d share a few examples of some of the things I’ve learned as they will be presented in my G5 classroom starting this fall.

With a basic understanding of the objective for this survey presented in the last blog, I’ll explore some of the geographic and hydrodynamic concepts associated with this part of the world in this post.  In the next blog, I’ll dive deeper into a specific study of scallops and lobsters, and in the fourth post I’ll talk more about the effects of current marine/fisheries management practices, with particular focus on those relating to closed areas (somewhat akin to the Balcones Preserve behind our campus.)

This is a Sculpin Longhorn, distantly related to BEVO

Georges Bank…water, water everywhere, time for a bath(ology)

We all know that water is central to our survival, and “playing” with water provides a strong anchoring point (am I pushing the puns too far?) for understanding systems relationships as students progress through their educational path.  For the past couple of years, I have been accepted to participate in a “Scientist in Residence” program offered through the University of Texas’ Environmental Science Institute, which pairs local teachers with a graduate level scientist for an entire school year.  In my first year, I was paired with (recently graduated) Dr. Kevin Befus, whose work focuses on hydrology.  Through my work with Kevin (note to students:  I can call him Kevin, you call him Dr. – he’s earned it!), I learned much about water and the importance of “flow,” and when you understand some of the “flow” relating the world’s most productive fishery, Georges Bank, I think you’ll agree with me.

Dolphin splashin’, getting everybody all wet

Georges Bank is an oval shaped shoal, which is essentially a submerged island that lies about 60 miles off the coast of Cape Cod, and covers nearly 150 square miles.  “The Bank,” or “Georges,” as many people aboard the vessel refer to it, is only recently submerged (i.e. – within the last 100,000 years).  As recently as ten years ago scientists found mastodon tusks on the Bank, and legend holds that in the early 1900s, fishing vessels would stop on an island in Georges Bank (now submerged to about 10m) and play baseball (note:  I have yet to find a bat and ball aboard the Sharp, but hope remains!)

Just like good soil helps support plant life, good water helps support marine life, and the key to the abundant life along Georges Bank lies in the nutrient rich water that is pushed towards the surface as it approaches Georges from the north and south.  On three sides of Georges Bank, the sea floor drops dramatically.  To the north sits the Gulf of Maine, which drops to approximately 1000m deep, and to the east and south, the Atlantic Ocean quickly reaches depths of over 2500m.

NASA photo
NASA photo

Almost all water enters Georges Bank from the north via the Gulf of Maine. The Gulf of Maine is fed via natural river discharges (including those from the Damariscotta and Merrimack Rivers) and the Labrador Currents that hug the coastline south around Nova Scotia before turning west into the Gulf of Maine.  Water also enters the Gulf of Maine through The North Channel on the east side of Maine from the Gulf Stream and that very salty, warm water is important, particularly when it comes to the biology of Georges Bank (as we’ll look at more in the next blog entry.)

Much of the water exiting the Gulf of Maine enters The Great South Channel, which is something like a “river in the ocean” that runs between Cape Cod and Georges Bank.  Deep within the Channel is a “sill,” which is a type of landform barrier, similar to a fence that doesn’t reach up to the surface.  The sill rises quickly from the sea floor and extends across the Great South Channel, effectively blocking the deepest, densest water, resulting in strong, deep, cold currents that are pushed east around the outer edge of Georges Bank before returning towards the United States’ east coast in a clockwise path, resembling “from 11 until 7” on a clock’s face.  Yes students, I do mean an analog clock!

After the deep currents make their way back to southern Massachusetts, they head south on the Longshore Coastal Current, which is like a “jet” of water that sprints southbound right along the eastern United States coastline (note:  those of us from the Gulf Coast frequently hear friends wonder why the Atlantic Ocean is so cold when they visit Florida, and this is partly why!)

At this point, I’m going to take a moment and speak directly to my students:   Just as the water flows into and mixes at Georges Bank from different directions, I’m hopeful that your thoughts are starting to swirl as you recognize the connection to concepts we have studied relating to energy, weather and climate, mixtures and solutions, salinity (and conductivity/resisitivity) and density (and buoyancy) – they are all evident and part of this story! And YES — this WILL be on the test!

b3g - 4 shells
I pulled these four scallops from one of our dredges to show the unique, beautiful patterns we find while sorting

While the deep-water currents that circle around Georges Bank’s edges exist year-round, in the winter there isn’t tremendous difference in the three primary water measurements (“Conductivity, Temperature and Density,” or “CTD”) between the water in The Great South Channel versus that sitting atop Georges Bank.  As you might recognize, in normal conditions, there shouldn’t be much cause for warm or fresh water to be added to the area during the cold winter months, as our part of the world seems to slow down and a goodly amount of water freezes.  In the spring, however, the northern hemisphere warms and ice melts, adding lots of warmer-and-fresh water to the Labrador Current and river discharges I mentioned above, ultimately sending that water south towards Georges Bank.  At this point, things get really interesting…

The new, warmer water is less dense than the deeper water. The warm and cold water ultimately completely decouple and become fully stratified (i.e. – there are two distinct layers of water sitting one on top of the other.)  The stratified layers move in separate currents:  the deeper, colder, more-dense layer continues its clockwise, circular path along the outer edge of the Bank before heading south; and the top, “lighter” layer gets “trapped” in a clockwise “gyre,” which is the formal word for a swirling “racetrack” of a current that sits on the Bank. This gyre goes full-circle atop Georges Bank approximately 2.5 to 3 times per summer season.

Bigelow and Bumpus:  Going with the Flow

The stratified/gyre relationship was confirmed almost 90 years ago by Henry Bigelow (note: those familiar with NOAA will no doubt recognize his name for several reasons, including the fact that a ship in the NOAA fleet is named after him).  Essentially, Bigelow used a type of “weighted-kite-and-floating-buoy” system to observe and confirm the two layers.  Bigelow’s “floating-buoy” was tied to the “weighted-kite” (actually called a drogue) and set at various depths, with each depth tested as an independent variable.  Once set, Bigelow drogued the water, chasing after the floats-and-kites, ultimately confirming that the stratified currents did in fact exist.  When you look at our dry lab here on the Sharp, complete with dozens of computers constantly monitoring hundreds of variables, Bigelow’s paper-and-pencil study aboard a 3-masted schooner is pretty awesome, and makes me feel a little lazy!

Source:  Bigelow, HB (1927): Physical Oceanography of the Gulf of Maine

In a different study conducted later in the 1900s that perhaps might evoke romantic images of the sea, physical oceanographer Dean Bumpus performed a study similar to Bigelow’s, but in a slightly different fashion. Over the course of a few years, Bumpus put notes in over 3,000,000 test-tubes and set them adrift from Georges Bank.  The notes provided instructions on how to contact Bumpus if found, and he used the returned notes to determine things like current speed and direction.  While I’m not sure if Bumpus also used this methodology to find true love, the experiment did reinforce the idea of the currents that exist around Georges Bank!

b3i - Bumpus

Yep, it’s pretty cool to hear stories of those old-school scientists getting their names in the history books by just going with the flow.

Gulf Coast Style Kicking It Up North

One other unique hydrologic influence on Georges Bank relates to “meanderings” by the Gulf Stream.  Normally, as the Longshore Coastal Current sprints southbound along the east coast faster than a recent retiree snowbirding to Florida, a little further offshore, the Gulf Stream is heading north, bringing with it warm water.  As the water moves towards Georges Bank, the bank does its thing, acting as a berm (my BMX students might better identify with that term), and pushes that water off towards the east.  The warm water ultimately reaches England, and when mixed with the cool air there, causes the cloudy conditions and fog we frequently associate with life in the U.K.

Shark!
Shark!

The unique aspect of this relationship occurs when, from time to time, the Gulf Stream misses the turn and a “slice” of the Gulf Stream breaks away.  When this happen, the split portion spins in a counter clockwise fashion and breaks into Georges Bank, bringing with it warm water — and all the chemistry and biology that comes with it.  More on that later…

Water Summary 

So, in a nutshell, that’s the system.  The coldest water at the headwaters of rivers in Maine and that in the arctic freezes and becomes ice.  Deep water doesn’t have access to the warm sunlight, so it stays colder than the warm, less dense water at the surface that is hoping for the chance to boil over and soar up into the skies as water vapor.  Newton tells us that things like to stay still, but will stay in motion once they get started.  Things like sills and submerged islands get in the way of flowing water (yeah, more Newton here), resulting in mixtures and unique current patterns.

From a biological standpoint, the traditional currents associated with Georges Bank bring the deep, nutrient rich waters to the surface. As that water is pushed to the surface, algae and phytoplankton grow in great numbers.  Phytoplankton attracts zooplankton, fish larvae eat the zooplankton, and eventually, “circle gets a square,” the trophic pyramid is complete, and nature finds its equilibrium.

If only it was that easy, right?

Unfortunately, the frequency of warmer weather over the past century has had an impact on the ecology of Georges Bank.  Scientists have noticed more warm water from the north as ice continues to melt and increased frequency of the Gulf Stream meandering from the south. I’m told that 20 years ago, Red Hake were rare here, but I’ve noticed very few of our dredges where Red Hake weren’t at least the plurality, if not majority, of fish we caught.  As Mr. Dylan says, “the times, they are a changin’.”

Okay.  That’s it!  Congratulations students! You have passed Oceanography: Hydrodynamics Short Course 101 and it is time to move on to Oceanography:  Shellfish Biology 101, which we will cover in the next blog.

My students get scribbled maps like this from me all the time. I didn’t draw this one, but it did make me feel good about my methods!

Lagniappe:  Dr. Scott Gallager

My students and friends know that I am continually working to learn new things.  I am surrounded by experts on this cruise and I need to go ahead and admit it:  I feel sorry for these folks because they are trapped and can’t escape the questions I’ll wind up asking them about their incredibly interesting work!

As I mentioned earlier, depth of knowledge is important to success of these missions, but, breadth is equally important.  Addressing challenges and solving problems from different perspectives is essential, and it sure would be nice to have a Boy Scout out here.  Oh wait, we actually have a long time Scout Master among us, Dr. Scott Gallagher.  There, I feel better already…

Scott is a scientist at the Woods Hole Oceanographic Institution (“WHOI”), where his work focuses on biological and physical interactions in oceanography, which can perhaps be a little better explained as “working to understand the physical properties and processes of the ocean that impact biological abundance and populations (aka – distributions).”  In other words, “where are the scallops, how many are there, and why are they there and at that number?”

From a scientific perspective, there are three primary controls to analyze when studying shellfish populations:  the total amount of larvae spawned; the transportation, or “delivery”, of the larvae through the water column to the place where they settle; and, post-settlement predatory relationships (aka – the sea stars, crabs, and humans all out to feast on these delicious creatures)… Seems like an easy-peasy career, right? (I kid. I kid.)

This is a shot of the specimen count in the wet lab

Scott cut his teeth as an undergrad at Cornell, starting off in electrical engineering, and ultimately earning degrees in both pre-med and environmental science (see, I told you he could see things from a variety of perspectives!).  In his environmental science courses, Scott studied the Seneca and Cayuga Lakes, and after graduating from Alfred University/Cornell University, moved on and earned a master’s degree in Marine Biology at the University of Long Island.  Over the next several years, he worked at Woods Hole as a research assistant, first working in bivalve (shellfish) ecology, and quickly moving up through the ranks to research specialist.  After a couple of years at WHOI, the magnitude and awesome wonder of the life in our oceans presented Scott with more questions than answers, and he realized it was time to return to school and obtain his PhD so he could start answering some of the questions swimming around in his head (okay, no more puns, I promise).

In our discussion, Scott described the challenge of decoupling the biological processes of the ocean as a fascinating mystery novel that never ends, and never allows you to put the book down or stop turning the pages to see what comes next.  After only a week out here with these good folks, it is evident that passion and curiosity exists in each of them, and it is really cool to feel their continued excitement about their work.

Our live aquarium
Our live aquarium

Aboard the ship, I’ve been fortunate to spend some time working with Scott in the wet-lab, where he helps conduct a more intensive study of a sample of 5-7 scallops from each dredge, according to survey protocol: taking photos, measuring the scallop size and weight, and recording whether it is male or female.

While the survey work is the mission of this cruise, it was the development and operational support for the HabCam that really got Scott working aboard these cruises, and members of his team are aboard each of the three legs every summer to participate in the survey work and provide technical assistance for the HabCam.  I think of my time driving the HabCam of what it must be like to explore Mars with Curiosity.

In addition to his mission-specific field-work, Scott has set up an onboard live aquarium in one part of the deck, using nothing more than an air hose, fresh sea water, and a tote.  The aquarium is a temporary home for many of the unique species we’ve caught on our dredge.  Most species are only kept long enough for me to nerd-out and take some photos, and it has been very interesting to see the interaction of the animals in the confined habitat that would normally only be seen on the sea floor.

Photoblog:

The pasta-looking stuff on the top of the clam shell are wavedwelk eggs. You can see a black-and-white wavedwelk poking out of the shell just to the right of the clam
Sea urchins.  We catch many of these.  Zoom in on the one on the right.  Yeah, that’s its mouth.  Life’s at sea is tough!
Sea urchins. We catch many of these. Zoom in on the one on the right. Yeah, that’s its mouth. Life’s at sea is tough!
An ocean pout.  They crush sand dollars and eat them for breakfast.
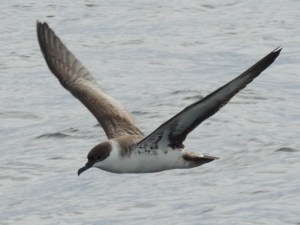
The smaller birds were enjoying that fish until the big dog bombed them and stole it away. Katie said it was cleptoparasitism; Fancy Nancy would approve.
The smaller birds were enjoying that fish until the big dog bombed them and stole it away. Katie said it was cleptoparasitism; Fancy Nancy would approve. 
Barnacles growing atop this scallop.  I think this was one of the designs tossed around for NASA’s recent “UFO” launch
It’s remarkable watching these guys zig-and-zag through rough seas, their wings not ever touching the water, but sometimes too close to it to see light peeking through from the other side
I kept looking for a button to push and see if it would sing “Feliz Navidad”
Stars on the water
Stars on the water
Don't be a skater-hater
Don’t be a skater-hater

Dredge playlist:  Metallica, Dierks Bentley, Spoon, The National

Special thanks to Dr. Gallager for his help with this one.

Okay, that’s it, class dismissed…

Mr. Hance
Robert Ulmer: Build Upon a Strong Foundation, June 19, 2013

NOAA Teacher At Sea

Robert Ulmer

Aboard NOAA Ship Rainier

Underway from June 15 to July 3, 2013

Current coordinates:  N 56⁰35.547’, W 134⁰36.925’

(approaching Red Bluff Bay in Chatham Strait)

Mission:  Hydrographic survey

Geographical area of cruise:  Southeast Alaska, including Chatham Strait and Behm Canal, with a Gulf of Alaska transit westward to Kodiak

Log date:  June 19, 2013

Weather conditions:  10.93⁰C, less than 0.5 km visibility in thick fog, 95.42% relative humidity, 1013.38 mb of atmospheric pressure, light variable winds (speed of less than 3 knots with a heading between 24⁰ and 35⁰)


Explorer’s Log:  Survey, sample, and tide parties

Scientists are explorers, wandering the wilderness of wonder and curiosity their with eyes and minds wide open to events, ideas, and explanations that no other humans may have previously experienced.  And by definition, explorers — including scientists — also are builders, as they construct novel paths of adventure along their journeys, built always upon the strong foundations of their own reliable cognitions and skill sets.

Ensign Rosemary Abbitt making a level sighting measurement

Starting from their own observations of the world around them, prior knowledge, and context, scientists inject creativity and insight to develop hypotheses about how and why things happen.  Testing those ideas involves developing a plan and then gathering relevant data (pieces of information) so that they can move down the path of whittling away explanations that aren’t empirically supported by the data and adding to the collective body of knowledge, so that they and others might better fathom the likely explanations that are behind the phenomena in question.

Rainier lowering a launch vessel
NOAA Ship Rainier lowers launch vessel RA-5 for a survey excursion.

Because progress along the scientific path of discovery and explanation ultimately depends on the data, those data must be both accurate and precise.  Often these terms are confused in regular conversation, but each word has its own definition.

Approaching the shore from the skiff
A view from the skiff of the shoreline where the benchmarks and tide gauge staff already are installed.

Accuracy is a description of the degree of closeness or proximity of measurements of a quantity to the actual value of that quantity.  A soccer player who shoots on goal several times and has most of his shots reach the inside of the net is an accurate shooter.  Likewise, a set of measurements of the density of a large volume of seawater is more accurate if the sample data all are near the actual density of that seawater; a measurement that is 0.4% higher than the actual density of the water is just as accurate as another measurement of the same water that is 0.4% below the actual density value.

HAST Curran McBride visually examining the condition of the tide staff
Before making more detailed data collections, Hydrographic Assistant Survey Technician (HAST) Curran first conducts a visual inspection of the previously-installed tide staff upon arriving at the shore.

Precision (also called reproducibility or repeatability), on the other hand, is the degree to which repeated measurements under unchanged conditions show the same results.  If every shot attempted by the soccer player strikes the left goalpost four feet above the ground, those shots aren’t necessarily accurate – assuming that the player wants to score goals – but they are very precise.  So, similarly, a set of measurements of seawater density that repeatedly is 5.3% above the actual density of the water is precise (though not particularly accurate).

HAST Curran McBride collecting data near the tide staff
HAST Curran collects data near the tide staff during the closing level run in Behm Canal.

The NOAA teams that conduct hydrographic surveys, collect seafloor samples, and gather data about tide conditions must be both accurate and precise because the culmination of their work collecting data in the field is the production of nautical charts and tide reports that will be used around the world for commerce, recreation, travel, fisheries management, environmental conservation, and countless other purposes.

Cabin of the launch vessel
Crew of the survey/sample team in the cabin of the launch vessel (and the Coxswain piloting the boat)

Hydrographic surveys of some sort have been conducted for centuries.  Ancient Egyptian hieroglyphs show men aboard boats using ropes or poles to fathom the depths of the water.  In 1807, President Thomas Jefferson signed a mandate establishing the Survey of the Coast.  Since that time, government-based agencies (now NOAA’s Office of Coast Survey) have employed various systems of surveying depths, dangers, and seabed descriptions along the 95,000 miles of navigable U.S. coastlines, which regularly change due to attrition, deposition, glaciation, tectonic shifts, and other outside forces.

Analyzing data aboard the launch
Hydrographic Senior Survey Technician Barry Jackson and Physical Scientist Kurt Brown analyze historic and new data from multi-beam sonar aboard the launch vessel.

For most of that history, data were collected through a systematic dropping of weighted lines (called “lead lines”) from boats moving back and forth across navigable channels at points along an imaginary grid, with calibration from at least two shore points to assure location of the boat.  Beyond the geometry, algebra, and other mathematics of measurement and triangulation, the work was painstakingly slow, as ropes had to be lowered, hauled, and measured at every point, and the men ashore often traveled alongside the boat by foot across difficult and dangerous terrain.  However, the charts made by those early surveys were rather accurate for most purposes.

Starboard of launch vessel RA-4

The biggest problem with the early charts, though, was that no measurements were made between the grid points, and the seafloor is not always a smooth surface.  Uncharted rocks, reefs, or rises on the seabed could be disastrous if ships passed above them.

HSST Barry Jackson collecting sea floor sample
HSST Barry Jackson pulls a line hand over hand to retrieve a scooped sea floor sample from a depth of more than 45 meters in Behm Canal.
HSST Barry Jackson analyzing sea floor sample
… and then analyzes what the scoop captured: mud and gravel in this case.

Starting in the 1990s, single-beam sonar became the primary mechanism for NOAA’s surveys.  Still looking straight down, single-beam sonar on large ships and on their small “launch vessels” (for areas that couldn’t be accessed safely by larger craft) provided a much more complete mapping of the seafloor than the ropes used previously.  Sonar systems constantly (many times per second) ping while traveling back and forth across and along a channel, using the speed and angle of reflection of the emitted sound waves to locate and measure the depth of bottom features.

Handwritten notes about sea floor samples
Data about sea floor samples first are recorded by hand on a chart aboard the launch vessel before being uploaded to NOAA computers later.

Sound waves travel at different speeds through different materials, based on the temperature, density, and elasticity of each medium.  Therefore, NOAA also deploys CTD devices through columns of surveyed waterways to measure electrical conductivity (which indicates salinity because of ionization of salts dissolved in the water, thus affecting solution density), temperature (which usually is colder at greater depths, but not necessarily, especially considering runoff from glaciers, etc.), and depth (which generally has a positive-variation relationship with water pressure, meaning more pressure – and thus, greater density – as depth below the surface increases).

CTD device about to be deployed
This CTD device measures conductivity, temperature, and depth in the water. All three affect the speed of the sound waves in water, and the speed of sound is a necessary bit of data when using sonar (which tracks reflected pings of sound) to determine the distance to the sea floor.

The most modern technology employed by NOAA in its hydrographic surveys uses multi-beam sonar to give even more complete coverage of the seafloor by sending sound waves straight downward and fanned outward in both directions as the boat travels slowly forward.  Even though sonar beams sent at angles don’t reflect as much or as directly as those sent straight downward, uneven surfaces on the seabed do reflect some wave energy, thus reducing the occurrence of “holidays” (small areas not well-defined on charts, perhaps named after unpainted bits of canvas in portraits because the painter seemed to have “taken a holiday” from painting there).

Acquiring hydrographic data
FOO Mike Gonsalves and HAST Allix Slagle acquire hydrographic data with the ship’s Kongsberg EM-710 multi-beam sonar.
TAS Rob Ulmer retrieving sea floor sample in Behm Canal
Aboard the small launch vessel, everyone works. This is Teacher At Sea Rob Ulmer hauling in a sea floor sample in Behm Canal.

But that’s not all.  To help sailors make decisions about navigation and anchoring – and often giving fishermen and marine biologists useful information about ecology under the waterline – NOAA also performs systematic samples of the types of materials on the sea floor at representative points in the waterways where it conducts surveys.  Dropping heavy metallic scoop devices on lines* dozens of meters long through waters at various locations and then hauling them back aboard by winch or hand-over-hand to inspect the mud, sand, silt, gravel, rocks, shells, plants, or animals can be physically demanding labor but is necessary for the gathering of empirical data.

* A note about terminology from XO Holly Jablonski:  Aboard the ship, lines have a job.  Think of a “rope” as an unemployed line.

Additionally, Earth’s moon and sun (along with several underground factors) affect the horizontal and vertical movement of water on Earth’s surface, especially due to their gravitational pulls as Earth spins on its axis and orbits the sun and as the moon orbits Earth.  Therefore, information about tides is extremely important to understanding the geography of nautical navigation, as the points below the waterline are identified on charts relative to the mean low water mark (so sailors know the least amount of clearance they might have beneath their vessels), and points above the waterline are identified relative to the mean high water mark (including notation of whether those object sometimes are fully submerged).

Evidence of tidal changes along the shoreline of Behm Canal
Can you see the evidence of tidal changes along the shoreline of Behm Canal? Color differences form strata along the rocks, and lowest leaves of the trees give further evidence of the highest reach of the water.
Ensign Damian Manda manually levels the sighting rod
Ensign Damian Manda manually levels the sighting rod upon the “turtle” using a carpenter’s bubble-leveling device.

To gather accurate and precise data about tidal influences on local waters, NOAA sends tides-leveling shore parties and dive teams into difficult conditions – commonly climbing up, down, and across rock faces, traversing dense vegetation, and encountering local wildlife (including grizzly bears here in Alaska!) – to drill benchmarks into near-shore foundation rocks, install (and later remove) tidal gauges that measure changing water heights and pressures, and use sophisticated mathematics and mechanics to verify the levels of those devices.

Pondering the next measurement
Ensign Rosemary Abbitt and HST Brandy Geiger ponder the placement of equipment before the next level measurement.

Needless to say, this description is significantly less detailed than the impressively intricate work performed at every level by NOAA’s hydrographic scientists, and in the end, all of the collected data described in the paragraphs above – and more, like the velocity of the sonar-deploying vessel – must be analyzed, discussed, and interpreted by teams of scientists with broad and deep skills before the final nautical charts are published for use by the public.

Portable tools of the trade
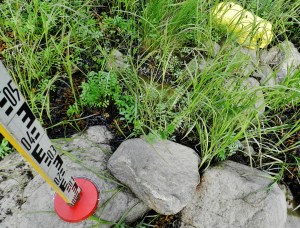
A leveling rod is balanced on the highest point of a “turtle,” positioned carefully to be seen from multiple points.

As you choose where and how to proceed in your own journeys, remember that you can be more confident about your decision-making by using information that is both accurate and precise.  And keep exploring, my friends.

View from the benchmark
This is the view from the benchmark atop a rocky outcropping (under an 80-foot evergreen) along Behm Canal while righting a measurement rod with the tide gauge leveling party.

Did You Know?

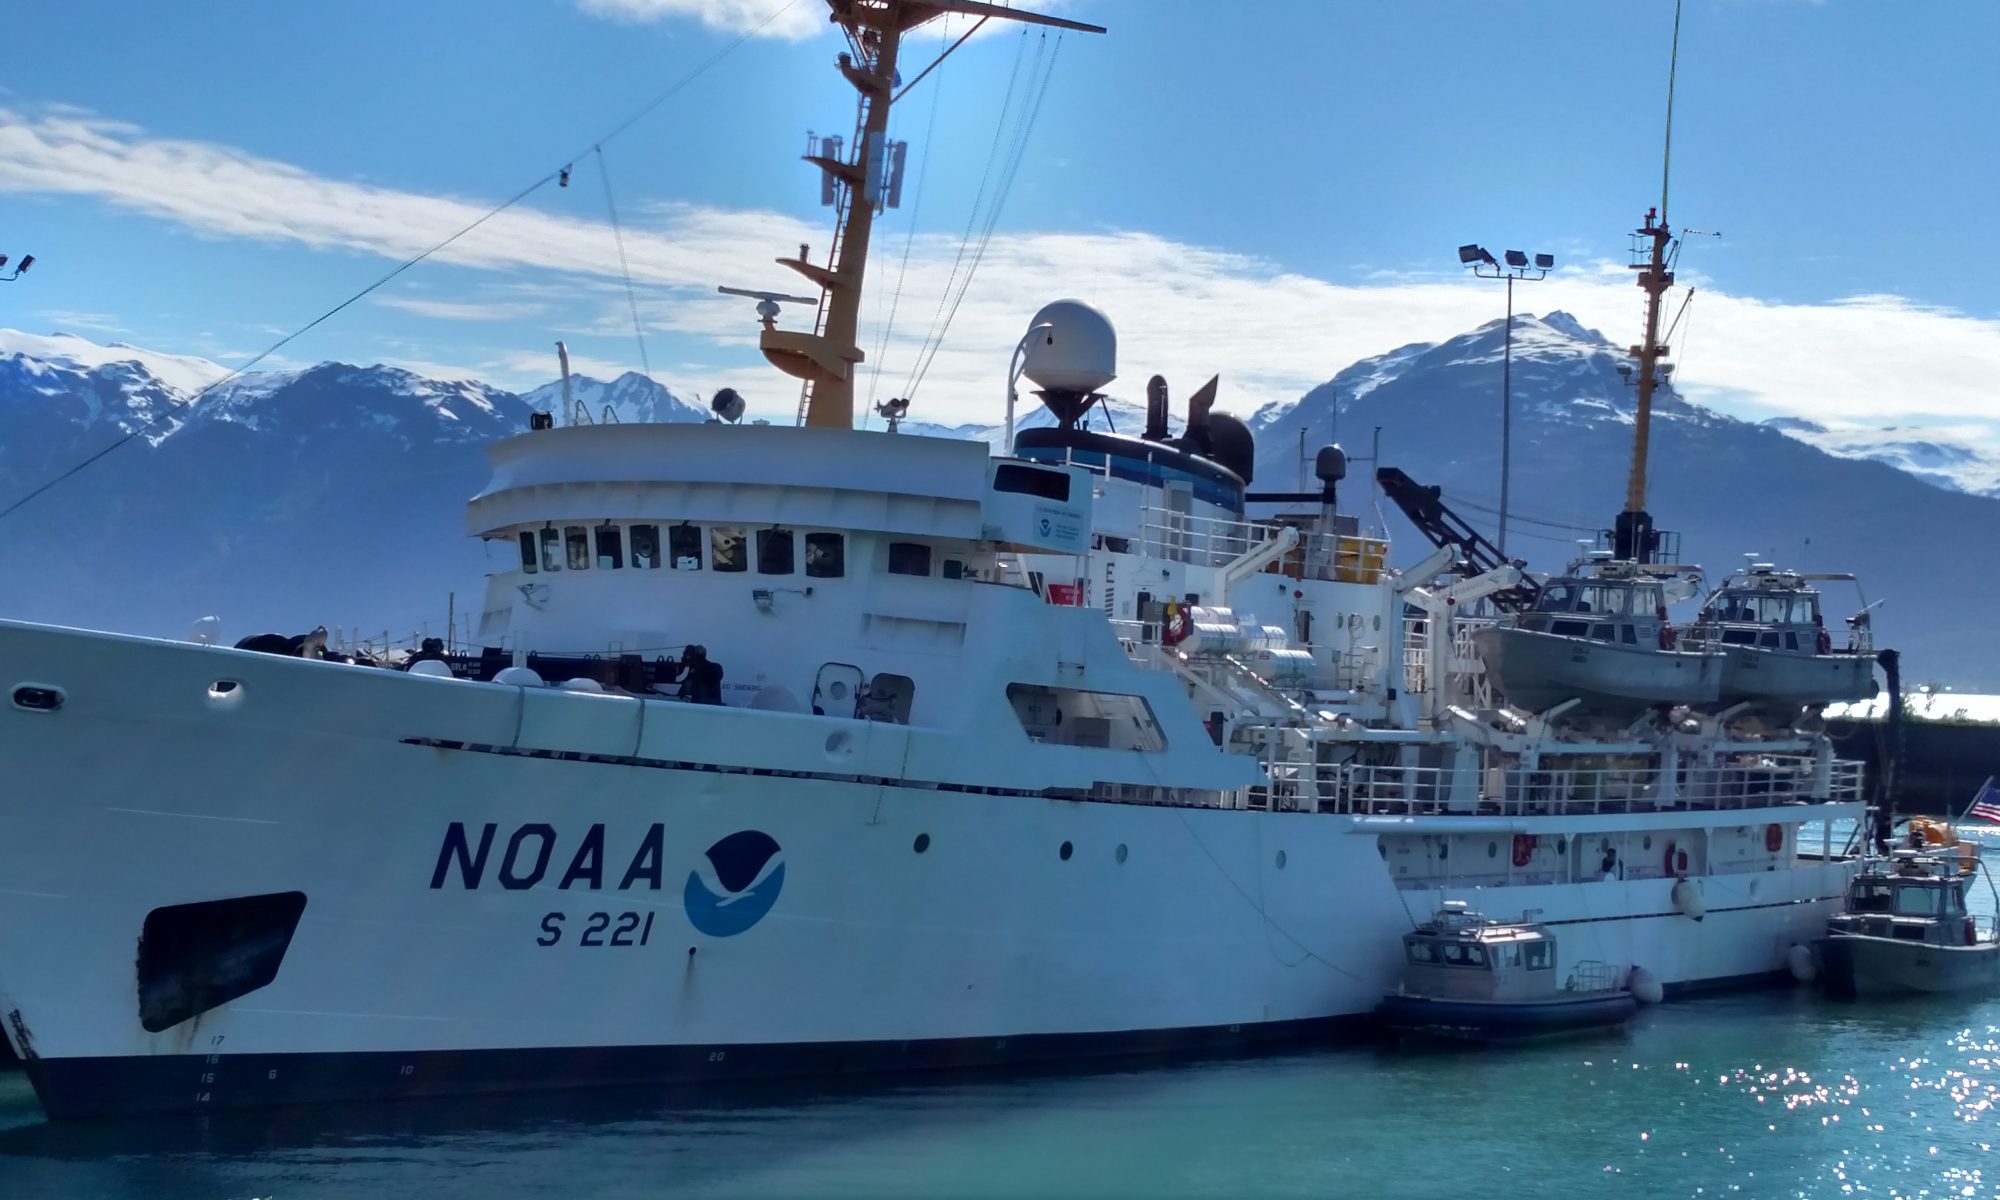
NOAA Ship Rainier in Behm Canal with launch vessels underway

Every ship in the NOAA fleet also is a voluntary mobile weather station, and so are many other seagoing vessels around the world.  For many years ships have been required to report their locations and identities on a regular basis to agencies like the U.S. Coast Guard and local or regional harbormasters.  Those periodic reports were (and still are) vital for local traffic control on the waters and for helping to provide quick response to emergency situations on vessels at sea.

View aft while launch is underway
The view aft through Behm Canal from the launch vessel

Eventually, someone insightful realized that having the ships also provide weather reports from their positions along with those identity-and-location reports would make a much richer and broader network of timely data for the National Weather Service, which is another branch of the National Oceanic and Atmospheric Administration.  As NWS adds the weather data from those many boats to the data gathered at land-based NWS stations and from voluntary land-based reporters of conditions, their models and forecasts become stronger.

(For more info about being a volunteer weather observer or volunteering with NOAA in some other capacity related to oceans, fisheries, or research, please visit www.volunteer.noaa.gov.)

Especially because weather conditions are the results of interactions among local phenomena, regional climate, and the global systems, building more accurate and precise forecast models depends on information from everywhere, but the result is that everyone benefits from the better forecasts, too.

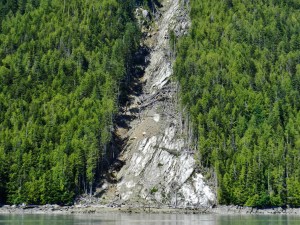
Evidence of tectonic activity and rundown
Southeast Alaska is area with frequent tectonic activity, including uplift and earthquakes. Here a scar among the trees on the mountainside shows evidence of tectonic shifts, which also creates a ready path for meltwater to move downhill from the snowy mountaintop to the seawater below, taking trees and soil with it.
NOAA Ship Rainier ready for the returning skiff
NOAA Ship Rainier waits offshore, ready to receive the skiff returning with the tide/level shore party.

Caitlin Fine: Introduction, July 26, 2011

NOAA Teacher at Sea
Caitlin Fine
Onboard University of Miami Ship R/V Walton Smith
August 2 – 6, 2011

Mission: South Florida Bimonthly Regional Survey
Geographical Area: South Florida
Date: July 26, 2011

Personal Log

Hola! My name is Caitlin Fine and I teach science at Escuela Key (Francis Scott Key School), a dual-language immersion elementary school in Arlington, VA. I am a Virginia native and my heart is constantly torn between the lively activities of the Washington, D.C. area and the peaceful beauty of the Shenandoah Valley. I left Virginia for college and graduate school, but returned 4 years ago to begin my teaching career for Arlington County Public Schools.

Caitlin Fine
On top of Aspen Mountain during a recent trip to Colorado

Although I majored in Political Science and Spanish Literature and I have graduate degrees in Spanish Literature and Multicultural Education, I have always been interested in science. During college, I worked on an organic farm in Andalucia, Spain that practiced permaculture (this is a way of using the land that is sustainable so that the soil does not use-up all of its nutrients). I also traveled around the Southern Cone of South America (Chile, Argentina, Peru, Bolivia, Brazil) studying the geology of the region. As you can see, I have some experience with farming and the mountains. But I have never really spent an extended time at sea — I have never slept on a boat or studied the marine ecosystems up close and personal over a period of time. I hope that I am not seasick!

My interest in science mixed with my love of cooking has created a current obsession — the health of our national and global food and water supplies. Did you know that every time we take medicine or use pesticides on our plants, a small amount of it enters the water supply and some of it ends up in the rivers and oceans nearby where fish and water plants are trying to live?

The science program at Key is a bit different from traditional elementary schools in that there are three science teachers who teach all 630 students. For the past two years, I have taught the Kindergarteners, the 2nd graders and half of the 5th graders. Key kids are amazing scientists — they are full of questions about how the world works and they are not afraid to get busy trying to figure things out on their own through hands-on inquiry and cooperative learning. I cannot wait to return to Key with new knowledge of oceanography, ocean-related careers and ways to monitor the health of the ocean to share with my students and colleagues!

I am so excited to be a Teacher at Sea for the National Oceanic and Atmospheric Administration‘s 2011 Field Season! Teacher at Sea is a program that provides allows Kindergarten through college-level teachers to live and work alongside scientists on research and survey ships. The goal of the program is to help teachers understand our ocean planet, environmental literacy, and maritime work so that they can return to the classroom and share information with their students about what it is like to be a real scientist who studies the ocean.

I will be on a 5-day cruise on the R/V Walton Smith in south Florida.

R/V Walton Smith
This is the R/V Walton Smith

From what I understand, we will be taking measurements across the south Florida coastal marine ecosystem (the southwest Florida shelf, Biscayne and Florida Bays, and the Florida Keys reef tract). The program is important because the research has helped scientists keep an eye on the sensitive marine habitats, especially when the ecosystem has had to deal with extreme events, such as hurricanes, harmful algal blooms or potential oil spill contaminants. We will test the circulation, salinity, water quality and biology of the ecosystem.

Drainage Basin
The currents might move some of the Mississippi River water toward south Florida

During this cruise, I have been told that we might be able to measure Mississippi River water because it might enter our survey track.

Scientists are also going to be trying out new optical measurement tools! It sounds as though I will have a lot to report back to you about!

Please leave me a comment or any questions you have about the cruise.

Please take a moment to take my poll: