NOAA Teacher at Sea
Dieuwertje “DJ” Kast
Aboard NOAA Ship Henry B. Bigelow
May 19 – June 3, 2015
Mission: Ecosystem Monitoring Survey
Geographical area of cruise: George’s Bank
Date: May 29, 2015, Day 11 of Voyage
Drifter Buoy!

NOAA has an Adopt a Drifter program! The program is meant to work with K-16 teachers from the United States along with international educators. This program provides teachers with the opportunity to infuse ocean observing system data into their curriculum. This occurs by deploying or having a research vessel deploy a drifter buoy. A drifting buoy (drifter) is a floating ocean buoy equipped with meteorological and/or oceanographic sensing instruments linked to transmitting equipment where the observed data are sent. A drifting buoy floats in the ocean water and is powered by batteries located in the dome. The drifter’s sea surface temperature data are transmitted to a satellite and made available to us in near real-time. The teachers receive the WMO number of their drifting buoy in order to access data online from the school’s adopted drifter. Students have full access to drifting buoy data (e.g., latitude/longitude coordinates, time, date, SST) in real or near real-time for their adopted drifting buoy as well as all drifting buoys deployed as part of the global ocean observing system. They can access, retrieve, and plot as a time series various subsets of data for specified time periods for any drifting buoy (e.g., SST) and track and map their adopted drifting buoy for short and long time periods (e.g., one day, one month, one year).
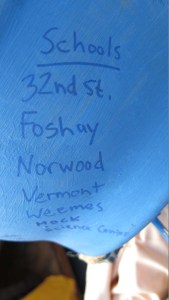
I am receiving one from the Chief Scientist onboard the NOAA Ship Henry B. Bigelow so the students in all my programs can access it, and this will be helpful to convey modeling of currents, and can help build models of weather, climate, etc .I was so excited when I found out that the chief scientist would be giving me a drifter for me and my students to follow. I decorated the buoy with programs that have inspired me to apply to the Teacher at Sea Programs, the current programs I am working for at USC (JEP & NAI), my family, and my mentors.


JEP HOUSE and Staff!


I forgot to take a final picture of this but this included Brenda, Adrienne, and Mandy. Photo by DJ Kast
I am teaching a marine biology class this summer for the USC Neighborhood Academic Initiative program. I am so excited to be following the drifter buoy # 39708. It was launched at 8:53 EDT on May 28th, 2015 and its first official position is: 41 44.8 N 065 27.0 W. I will definitely be adapting a few of the lesson plans on the following site and creating my own to teach my students about weather, climate, and surface currents.
http://www.adp.noaa.gov/lesson_plans.html
Deployment:
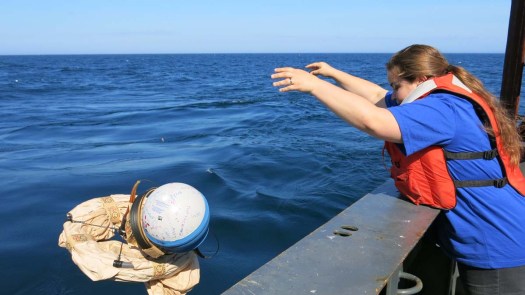
To deploy the buoy, you literally have to throw it overboard and make sure it hits nothing on its way down. When it is in the water, the cardboard wraps dissolve away, and the cloth drogue springs open, filling with water and causing the buoy to drift in surface water currents instead of wind currents. The tether (cable) and drogue (long tail that is 15 meters long) will unwrap and extend below the sea surface where it will allow the drifter to float and move in the ocean currents


Since I was now an expert drifter buoy deployer, I was also able to deploy a buoy from the St. Joseph’s school in Fairhaven, Massachusetts. This drifter buoy’s tracking number is: 101638 and launched on May 28th, 2015 at 8:55 EDT and its first official position is: 41 44.9 N 065 27.0 W


Tracking the buoy (from Shaun Dolk):
The easiest way to track these buoys in real-time is to use the Argos website https://argos-system.clsamerica.com/cwi/Logon.do.
Guest account: Username: BigeloTAS and Password: BigeloTAS.
- Once logged in, select the “Data access” tab on the top left side of the screen.
- Select “Mapping”; a pop-up window will appear.
- Ensure “by ID numb. (s)” is selected from within the “Platform:” option (top left).
- Enter your desired ID number in the search field at the top of the screen.
- Enter the number of days for which you’d like data (20 days is the maximum).
- Select “Search” to generate a trajectory plot for the given parameters.
**Please note, because you can only view the 20 most recent days of data, you’ll need to save the data if you wish to view the entire track line!**
To save data into Google Earth format, simply click on the Google Earth image (second tool from the right on the map settings bar, found just below the “Search” tab). You’ll need to save data at least every 20 days to ensure no interruptions in your final track line. Of course, to view the track line in its entirety, open Google Earth and ensure all of the data files are selected. If you desire to look at the data, not the track lines, go to “Data access”, then “Messages”, and enter your desired ID numbers. Again, data is only accessible for the most recent 20 days, so if you’d like to download the data for archival purposes, go to “Data access”, then select “Message download”. From here, you’ll want to save the data in .csv, .xls, or .kml format.
My buoy 39708 is transmitting properly and providing quality data! Below are some of the maps of its early trajectory and its current movement so far.


PS for Science- Otoliths
While we were deploying the buoys one of the engineers named Rahul Bagchi brought over a strainer that is attached to the water intake pipe. The strainer was covered in Sand Lances.


Fortunately, there are another two scientists on board that need sand lance samples for their research purposes and they were collected. My research scientist friend Jessica needs the otoliths or fish ear bones for part of her research on cod, since sand lances are eaten cod. Otoliths are hard, calcium carbonate structures located behind the brain of a bony fish. Different fish species have differently shaped otoliths. They are used for balance and sound detection-much like our inner ears. They are not attached to the skull, but “float” beneath the brain inside the soft, transparent inner ear canals. The otoliths are the most commonly used structure to both identify the fish eaten by consumers up the food chain, and to age the fish itself.


The otoliths also have daily growth bands. Alaskan Fishery scientists manipulate the daily growth bands in salmon larvae creating an otolith tag that identifies where the fish came from by controlling the growth rate of their fish populations.

New material (protein and calcium carbonate) is added to the exposed surface of the otolith over time, showing a fish life history (otolith start growing at day 1 even in larval stages). The lighter zones have higher calcium deposit which is indicate summers, while darker zones have higher protein levels which indicate winter. One pattern of a light and dark zone indicate a year and is consequently how the fish is aged.


Jessica Lueders-Dumont is using the otoliths for three main purposes in relation to her Nitrogen Isotope work.
1. She is hoping to see the changes from year 1 to the adult years of the fish to give an accurate fish life history and how they relate to the rest of the Nitrogen isotopes in the area’s food chain.
2. To see how current nitrogen isotopes compare to the archeological otoliths found in middens or sediment sites, since otoliths can be preserved for hundreds of years.
3. She is trying to create a baseline of nitrogen 15 in the Gulf of Maine so that she can see biogeochemical evidence of the N15 she finds in plankton in higher trophic levels like fish.
I will definitely be dissecting some fish heads with students to check for otoliths and using a microscope to age them.
PSS for Science:
The chief scientist and I decided we should put some Styrofoam Cups under pressure. This polystyrene foam is full of air pockets. This is important because the air pockets (volume) shrink with increasing pressure, essentially miniaturizing the cups.
I have done this before using the help of Karl Huggins at the USC Wrigley Institute’s Catalina Hyperbaric Chamber. We had a TA that wanted to teach about SCUBA diving so we had her students decorate Styrofoam cups and a head and placed it in the chamber. Apparently the Styrofoam was too good of a quality because it re-expanded on the way back up. http://www.youtube.com/watch?v=f6DDBFovht0
Also, I also found out you can do this with a pressure cooker- oh the experiments I will do when I get back. 😀
Before photos:


After Photos: the Styrofoam cups went down to 184 m or 603 ft on the Rosette/ CTD in South George’s Basin.


