Brad Rhew: Getting Fishy With It, July 29, 2017

NOAA Teacher at Sea

Brad Rhew

Aboard NOAA Ship Bell M. Shimada

July 23 – August 7, 2017


Mission: Hake Survey

Geographic Area of Cruise: Northwest coast

Date: July 28, 2017


Weather Data from the Bridge

Latitude 4359.5N
Longitude 12412.6 W
Temperatue: 54 degrees
Sunny
No precipitation
Winds at 23.5 knots
Waves at 2-4 feet


Science and Technology Log

We are officially off! It has already been an amazing experience over the last couple of days.

One of the goals of this project is to collect data that will be used to inform the Pacific hake stock assessment. This falls in line with the Pacific Whiting Treaty that the US-Canadian governments enacted to jointly manage the hake stock. NOAA and Department of Fisheries and Oceans-Canada (DFO) jointly survey and provide the hake biomass to the stock assessment scientists. (Refer to the link in my last blog about additional information on this treaty.) Major goals of the survey are to determine the biomass, distribution, and biological composition of Pacific hake using data from an integrated acoustic and trawl survey. Additionally, we are collecting a suite of ecological and physical oceanographic data in order to better understand the California Current Large Marine Ecosystem (CCLME).

There is a very detailed process the scientists go through to collect samples and data on the hake caught and selected for sampling. They want to learn as much as possible about these fish to help with the ongoing research projects.

Here is a quick guide and understanding of how sampling works and what data is collected:

  1. Determine the length and sex of the fish.
    1. To determine the length, the fish is placed on a magnetic sensor measuring board. The magnet is placed at the fork of the tail fin; the length is recorded into the data table. (See figure A.)
      TAS Rhew Blog 2 photo A
      Figure A. Determining the length of the fish.


    2. To determine the sex, the fish is sliced open on the side. Scientist look to see if ovaries (for females) or testes (for males) are present. They also can determine the maturity of the fish by looking at the development of the reproductive organs. (See figure B.)

      TAS Rhew Blog 2 photo B
      Figure B. Determining the sex of the fish.
  2. Determine the mass.
    1. The Hake are placed on a digital scale and then massed. The data also gets entered into the database. (See figure C.)

      TAS Rhew Blog 2 photo C
      Figure C. Massing the fish on a digital scale.
  3. Removing of the otoliths (ear bones).
    1. Hake have two otoliths. How this is done is the scientist first cuts a slight incision on top of the fish’s head. (See figure D.)

      TAS Rhew Blog 2 photo D
      Figure D. Making an incision on the fish’s head to remove otoliths.
    2. The head is then carefully cracked open to expose the bones. (See figure E.)
    3. The bones are removed with forceps and then placed in a vial. The vial is then barcode scanned into the database. The otoliths will then be sent to the lab for testing. Scientists can run test on the otoliths to determine the age of the selected fish. (See figures F and G.)
  4. Removing a fin clip.
    1. Fin clips are removed from the Hake for DNA sampling to be completed back on shore in the lab. This gives researchers even more information about the selected fish.
    2. The fin clip is removed using scissors and forceps. (see figure H.)

      TAS Rhew Blog 2 photo H
      Figure H. Removing a fin clip.
    3. The clip is then placed on a numbered sheet. (see figure I.)

      TAS Rhew Blog 2 photo I
      Figure I. Placing the fin clip on a numbered sheet.
    4. The number is also entered into the database with all the other information collected on that particular fish.
  5. All the information is collected in one database so it can be assessed by scientists for future research. (see figure J.)

    TAS Rhew Blog 2 photo J
    Figure J. All information is stored in a database.


Personal Log

Even though this survey is just beginning this has been such an amazing experience already. I have learned a great deal about oceanography and marine research. I cannot wait to use my experiences back in my classroom to expose my students to careers and opportunities they could be a part of in their future.

Another great aspect of being a Teacher at Sea is the relationships I’m building with other scientists and the crew. It is amazing to hear how everyone became a part of this cruise and how passionate they are about their profession and the world around them.


Did You Know?

This is Leg 3 of 5 of this Summer Hake Survey. Two more legs will be completed this year to collect even more data on the fish population.


Fascinating Catch of the Day!

When we fish for Hake it is very common to collect some other organisms as well. Today’s fun catch was Pyrosomes or Sea Tongues!

These free-floating colonial tunicates are found in the upper part of the open ocean. Pyrosomes rely on the currents to move them around the ocean. They are typically cone shaped and are actually made up of hundreds of organisms known as zooids. The Zooids form a gelatinous tunic that links them together creating the cone shape. They are also bioluminescent and give off a glow in the ocean.

TAS Rhew Blog 2 photo collage
Fun with pyrosomes!

Check it Out!

If you want to learn more about what is happening on the Bell M. Shimada, check out The Main Deck blog for the ship:

https://www.nwfsc.noaa.gov/news/blogs/display_blogentry.cfm?blogid=7
Dawn White: Otoliths & a “Wet” Farewell: July 2, 2017
NOAA Teacher at Sea

 Dawn White

Aboard NOAA Ship Reuben Lasker

June 19 – July 1, 2017


Mission: West Coast Sardine Survey

Geographic Area of Cruise: Pacific Ocean; U.S. West Coast

Date: July 2, 2017

Weather Data from the Bridge (As in back home in North Branch, MN)

Date: July 2, 2017                                                             Wind Speed: 8 kts

Time: 7:30 p.m.                                                                 Latitude: 45.5102° N

Temperature: 26.7 oC                                                     Longitude:  92.9931° W

Science and Technology Log

It wasn’t until the last day or two of my leg of the research project that we finally started to catch the species the scientists were specifically looking to track and even then there were only a few.

Angela removes an otolith from the sample target species

Here’s Angela dissecting one of our first samples.  If the young captured were either sardines or anchovies, they were massed, length taken, sex determined (including whether or not they were sexually mature, if possible), and their otoliths were removed.

So what the heck are otoliths and why would anyone want to remove them?

Otoliths are small, bony parts of a fish’s earbones.  They help the fish with balance and orientation.  These bones are made of calcium carbonate and similar to the formation of rings on a tree, they grow with a ring-like pattern based on seasonal metabolic rates.  While the fish is growing faster during the warmer summer months, the rings are broader and more translucent.  Then, during the cooler winter months when a fish’s metabolic rate begins to slow down, that part of the ring appears to be more dense or opaque.

Look at the first illustration below that was taken from a 2008 NOAA press release.  On the lower right you see an image of an otolith from a haddock.  Each species has otoliths of a particular size and shape. If you know the region of ocean from which a set of otoliths was obtained, you may be able to determine the species by utilizing one of the many otolith references that can be accessed online, such as found in this memorandum published by NOAA researcher Mark S. Lowry.


The enlarged image on the right was taken from the NOAA Images Library.  Here you can see the rings very distinctly.

Extension question for my students:  Using the otolith image on the right, determine how old the fish was at the time of capture.  Not sure how to do this just yet?  Want to test your accuracy?  Read up on what is involved in the study of sclerochronology first. Then test yourself with this otolith aging interactive.  Enjoy!

Once the otoliths have been removed they are wiped clean and placed in a small vial to finish drying out.  The otoliths are cataloged and sent to the lab for evaluation as shown in the photos below.


The combination of measurements taken allow those studying the population to look at the demographics of the catch (What % of the population is juvenile?  What % is sexually mature? What is the relationship between % male vs. female?).  This data provides a sampling of the population’s health and viability, which can then be extrapolated to the population as a whole.  This information can then be used to help inform policy with regards to how heavily these populations can be fished without causing damage to the ecosystems of which they are a part.


Personal Log – It’s time to go home!

It seemed like we had just gotten started and it was time to go!  Although they had mixed work/sleep schedules, the science team was willing to gather to see me off.

Angela, Dereka, Dawn (TAS), Nick, Amy, Bryan, Sue, Emily

What an amazing learning experience!  My only regret was that we didn’t start to find the species requiring the more intense, time-consuming dissection and data collection until the very end.  I wanted to make sure I was doing my part!  In return, what I get to take home to my students is invaluable. I can’t wait to share all I have learned about life aboard a research vessel, the many ways in which this unique habitat is being studied, and the vast opportunities that await those who are interested in marine ecosystems.

The only travel plan that was not prearranged regarding my TAS adventure was the exact location of my departure from the Reuben Lasker.  What I did know was that it was to be a “wet transfer.”  What I didn’t know was exactly what that meant.  It was so much fun finding out!

The Reuben Lasker has a limited number of ports along the west coast where it is possible for it to dock.  The ship’s size, unique keel, and specialized, below-ship sonar equipment require channels to be much deeper than many smaller ports possess.  Because of this, whenever there is to be an exchange of personnel made before a larger port is reached, an onboard transfer craft brings those getting off to a smaller port along the way.  This allows the main vessel to stay in safer waters much further off shore.  Once the exchange of people and gear is made, the transfer boat returns to the ship and the journey continues.

Unique points to consider on this type of trip, however, are that you need to get the transfer boat launched from the main vessel, the ship lets you off several miles from port, and the boat has no seats – you stand up the whole way!  Who knew that even getting back to the mainland was to be an adventure?!

You can see the transfer boat below (right side in the picture – port side of the ship).  Notice how the Reuben Lasker carries it hoisted up off the floor of the back deck.

View of the transfer boat (at right) stored on Reuben Lasker

The transfer boat gets lowered to deck level so we can all step in.  Our gear is stored in the open bow and we all load in the back.  Behind the center console are poles with handles that give us something stable to hold on to as we will be standing for the duration of the trip.  We all wear life jackets and hard hats as the boat is lowered along-side the main ship.

Here’s Skilled Fisherman Victor Pinones ready at the controls as he lowers us to sea level.

Skilled fisherman Victor Pinones ready at the controls

The two outboard motors are started while we are along-side so we are ready to move away from the Reuben Lasker the minute we hit the water.  And we’re off! To give you some perspective of the size of the Reuben Lasker as it looks from the water, you can see Emily, Angela, and Dereka waving to me from the Level-1 deck.

View of NOAA Ship Reuben Lasker from the transfer boat
It didn’t take long before the ship was but a spot on the horizon….
Here’s a better look at the transfer vessel as crew members prepare to for the return trip.

Bon voyage to all!  Safe travels!

Did You Know?

Fun fact: Baby squid are adorable!  Just had to share one last image from under the microscope – thanks, Nick, for pointing this out!  At this larval stage, the squid are mainly transparent except for their developing eyes and chromatophores (sac-like structures filled with pigments that help the squid undergo color changes).  You can observe this process in action at the Smithsonian’s  Ocean Portal web site.


Looking at the enlarged photo at right you can just make out the scale – our little friend was a whole 3 mm in diameter!  Too cute!

Marsha Lenz: And The Hauls Begin, June 14, 2017

NOAA Teacher at Sea

Marsha Lenz

Aboard NOAA Ship Oscar Dyson

June 8–28, 2017


Mission:Geographic Area of Cruise: Gulf of Alaska

Date: June 14, 2017


Weather Data from the Bridge

Latitude: 53 24.35 N

Longitude: 166 58.2 W

Time: 0700

Visibility: 8 Nautical Miles

Wind Direction: 095

Wind Speed: 25 Knots

Sea Wave Height: 7-9 foot swell

Barometric Pressure: 1003.4 Millibars

Sea Water Temperature: 7.2°C

Science and Technology Log

I know that I have already talked about how much science and technology there is on board, but I am amazed again and again by not only the quantity of it, but also the quality of it. I am also impressed by the specialized education and training that the scientists and rest of the crew have in their designed roles on this ship. They know how to utilize and make sense of it all. I keep trying to understand some of basics,  but often I just find myself standing in the back of the room, taking it all in.

We brought in our first haul on Monday.  I was given an orientation of each station, put on my fish gear, and got to work. I was shown how to identify the males from the females and shown how to find the fork length of the fish. Finally, I also practiced removing the otoliths from the fish. I finally felt like I was being useful.


This slideshow requires JavaScript.

I woke up on Tuesday (6/13) to start my 4:00 am shift. After some coffee and a blueberry muffin, I headed down to the “Chem lab.” We had arrived at the Islands of the Four Mountains in the night and were now heading back to start on the transect lines. The scientists had just dropped down the Drop Camera to get an idea of what was happening on the ocean floor. The camera went down to 220 meters to get an idea of what was happening down there. The video images that were being transmitted were mind-blowing. Though it was black and white footage, the resolution had great detail. We were able to see the bottom of the ocean floor and what was hanging out down there. The science crew was able to identity some fish and even some coral. One doesn’t really think of Alaska when one thinks of coral reefs. However, there are more species of coral in the Aleutians than in the Caribbean. That’s a strange thought. According to the World Wildlife Fund, there are 50 species of coral in the Caribbean. Scientists believe that there are up to 100 species of coral in the coral gardens of Alaska that are 300 to 5,000 feet below the surface.

labelled_correct_camdrop
The DropCam took images of life on the ocean floor.


This slideshow requires JavaScript.

Personal Log

Monday, June 12

We have been making progress in getting to the Island of Four Mountains. We should be arriving around noon. At this point the scientists have still been getting everything ready for the first haul. The crew has been working hard to fine-tune the equipment ready for data gathering. I have been sitting in “The Cave” at various times, while they have been working around the clock, brainstorming, trouble-shooting, and sharing their in-depth knowledge with each other (and at times, even with me).

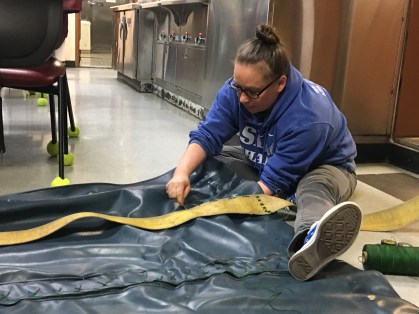
In the afternoon, I was asked to help a member of the Survey Crew sew a shark sling. I was not sure what that entailed, but was willing to help in any way possible. When I found Meredith, she was in the middle of sewing straps onto the shark sling. Ethan and I stepped in to help and spent the rest of the afternoon sewing the sling. The sling is intended to safely return any sharks that we catch (assuming we catch any) back to the water.

IMG_1534
We spent many hours sewing the straps onto the sling.
IMG_1539
The sling is intended to safely remove any shark we catch from the boat.

Tuesday, June 13

I woke up at 3am, grabbed a coffee and then made my way down to the Chem Lab. After downloading the footage from the DropCam and getting a few still pictures, we started identifying what we saw. Using identification key, we were able to identify the fish and some coral. We saw what we thought was an anemone. We spent about and hour to an hour and a half trying to identify the species. We had no luck. Finally, Abigail, with her scientific wisdom, decided to look into the coral species a bit deeper. And then, AHA!, there it was. It turned out to be a coral, rather than an anemone. It was a great moment to reflect on. It was a reminder that, even in science, there is a bit of trial and error involved.   I have also observed that the science, actually everyone else on the ship, is always prepared to “trouble shoot” situations. In the moments where I have been observing in the back of the room, I have been able to take in many of the subtleties that take place on a research vessel like this. Here are some things that I have noticed.
1) Things will go wrong, 2) They always take longer than expected to fix, 3) Sometimes there are things that we don’t know (and that’s ok!) 4) Patience is important, 5) Tolerance is even more important, and 6) Clear communication is probably the most important of all. These have been good observations and reminders for me to apply in my own life.

Animals (And Other Cool Things) Seen Today

I feel very fortunate that I had a chance to participate in the DropCam process.  We were able to identify:

  • Blackspotted rockfish
  • Feathery plumarella
  • Basketstar
  • Pink seafan
  • Grooved hydrocoral
  • Anthomastus mushroom coral


Did You Know?

In the NOAA Corps, an Ensign (ENS) is a junior commissioned officer. Ensigns are also part of the U.S. Navy, Coast Guard, and other maritime services. It is equivalent to a second lieutenant in the U.S. Army, the lowest commissioned officer, and ranking next below a lieutenant, junior grade.

Interview with ENS Caroline Wilkinson

What is your title aboard this ship?

I serve as a Junior Officer aboard the NOAA Ship Oscar Dyson.

How long have you been working with the NOAA Corps?

Since July 2015 when I entered Basic Officer Training Class (BOTC) at the Coast Guard Academy in New London, CT. We train there for 5 months before heading out to our respective ship assignments. I arrived on the Dyson in December of 2015 and have been here ever since.

What sparked your interest in working for them?

I first learned of the NOAA Corps during a career fair my senior year of college at the University of Michigan. I was attracted by all of the traveling, the science mission of the organization, and the ability to serve my country.

What are some of the highlights of your job?

We see some incredible things out here! The Alaskan coastline is stunningly beautiful and there are more whales, sea birds, seals, otters, etc. than we can count. The crew and scientists are incredibly hardworking and supremely intelligent. They are a joy to work with and I love being able to contribute to highly meaningful science.

What are some of challenging parts of your job?

We spend over 200 days at sea each year and operate in remote areas. It is difficult to keep in touch with loved ones and most of us only see family and friends once or twice a year, if we are lucky. That is a huge sacrifice for most people and is absolutely challenging.

How much training did you go through?

The NOAA Corps Officers train for 5 months at the US Coast Guard Academy alongside the Coast Guard Officer Candidates. It is a rigorous training program focusing on discipline, officer bearing, and seamanship. Once deployed to the ship, we serve 6-8 months as a junior officer of the deck (JOOD) alongside a qualified Officer of the Deck (OOD). This allows us to become familiar with the ship, get more practice ship handling, and learn the intricacies of trawling.

What are your main job responsibilities?

Each Junior Office wears many hats. Each day I stand eight hours of bridge watch as OOD driving the ship and often instructing a JOOD. I also serve as the Medical Officer ensuring all crew and scientists are medically fit for duty and responding to any illness, injury, or emergency. I am the Environmental Compliance Officer and ensure the ship meets all environmental standards for operations with regards to things like water use and trash disposal. As the Navigation Officer, I work with the Captain and the Chief Scientist to determine where the ship will go and how we will get there. I then create track lines on nautical charts to ensure we are operating in safe waters. In my spare time I manage some small aspects of the ship’s budget and organize games, contests, outings, etc. as the morale officer.

Is there anything else that you would like to add or share about what you do?

I am really enjoying my time working for NOAA and in the NOAA Corps; I could not have asked for a better career. It is a challenging and exciting experience and I encourage anyone interested to reach out to a recruiting officer at https://www.omao.noaa.gov/learn/noaa-corps/join/applying.


Dave Amidon: California – Here I Come! May 25, 2017

NOAA Teacher at Sea
David Amidon
Aboard NOAA Ship Reuben Lasker
June 2 – June 13, 2017

Mission: Pelagic Juvenile Rockfish Recruitment and Ecosystem Assessment Survey

Geographic Area of Cruise: Pacific Ocean -Off the California Coast

Date: May 25, 2017

Weather Data from the Bridge

Since I am still in Central New York, that is not an easy answer. This week – 60s and rain. Last week it was 85, hot & muggy; the week before saw a Frost Advisory. CNY meteorologists certainly earn their keep.

I will be traveling off the coast of California, which I have heard is nice. I expect 50’s to 60’s during the day, warming as we move south.

Science and Technology Log

Not much to report yet as I am still landlocked, but I am looking forward to seeing how the scientists work!

For some background, I pulled some information about the Rockfish Survey from the NOAA Fisheries website, and the official NOAA website of the Reuben Lasker (as well as the Facebook and Wikipedia entries for the vessel).

From the NOAA Office of Marine and Aviation Operations:

Built in Wisconsin by Marinette Marine Corporation and commissioned in 2014, the ship is named after Dr. Reuben Lasker (1929-1988), who served as the director of SWFSC’s Coastal Fisheries Division and as adjunct professor at Scripps Institution of Oceanography, U.C. San Diego. Dr. Lasker built a renowned research group that focused on the recruitment of young fish to the adult population — a topic with implications for fisheries management throughout the world. Reuben Lasker is homeported in San Diego, California.

https://www.omao.noaa.gov/learn/marine-operations/ships/reuben-lasker/about 

National Oceanic and Atmospheric Administration

The Juvenile Rockfish Survey dates back to 1983. Since that time, NOAA has expanded the range of coastline studied and added a great deal in terms of information gathered and instruments utilized.  The Reuben Lasker is a very recent addition to the fleet, being commissioned in 2014, and has state of the art instrumentation. Oceanographic data collected includes conductivity, temperature, depth, chlorophyll and light levels as well as turbidity and dissolved oxygen concentration.

I will have to brush up on my rockfish (Sebastes spp.),  as there 16 species that can be caught off the California coast, according to the California Department of Fish and Wildlife. There are many other species that are documented during the survey, including juvenile and adult Pacific whiting (Merluccius productus), juvenile lingcod (Ophiodon elongatus), northern anchovy (Engraulis mordax), Pacific sardine (Sardinops sagax), market squid (Loligo opalescens), Humboldt squid (Dosidicus gigas), krill (Euphausiacea). Data gathered includes the number and size of individuals collected. Rockfish will also have genetic tissue samples and otoliths (used for daily aging) taken. Finally, the crew conducts a seabird and marine mammal count as well.

Pelagic Juvenile Rockfish Recruitment and Ecosystem Assessment Survey


Personal Log

I would like to start this section by stating how deeply honored I am to be selected for the Teacher @ Sea program and I want to thank NOAA for giving me this chance to further stretch my horizons. I have always seen science as more than just a class trapped in a four wall classroom, and I have been fortunate enough to take advantage of a few very exciting opportunities. Every time, I add to my repertoire, my knowledge base and my network. I can not tell you how excited I am to be able to take advantage of this opportunity from NOAA. Although I have been teaching science for almost 20 years, I have not done much in terms of field work. It is one thing to promote the exciting work being done in the world of STEM, but I feel it is another to actually talk from experience. I aim to bring as much of the field work from the Reuben Lasker to my classes as I can – and I am already thinking about how I might do that.

I am definitely stepping out of my comfort zone on this trip. Not only do I not blog on a regular basis (or ever), but I can not tell you how many times I have been asked “So do you get seasick?” I don’t really know! I have taken a couple cruises and my dad took me fishing on the Great Lakes as a kid, but this voyage will be very different. I’m going with the meds.  I hope people find my writing to be informative and entertaining, and that I can be an asset for the program moving forward.


Did You Know?

Otoliths are bony structures behind the brains in fish. They make annual layers and can be counted to determine the age of a fish, like tree rings.

Video excerpt from “Microworlds: How Old is A Fish?” produced by NOAA’s Alaska Fisheries Science Center, available for download here.

Want to try it? Here is an interactive from NOAA’s Alaska Fisheries Science Center:  https://www.afsc.noaa.gov/refm/age/interactive.htm


Emily Sprowls: Tag, you’re it! March 26, 2017

NOAA Teacher at Sea

Emily Sprowls

Aboard NOAA Ship Oregon II

March 20 – April 3, 2017


Mission: Experimental Longline Survey

Geographic Area of Cruise: Gulf of Mexico

Date: March 26, 2017

Weather Data from the Bridge

13:00 hours

28°12.1’ N 89°23.8’W

Visibility 6 nm, Haze

Wind 15 kts 170°E

Sea wave height 4-5 ft.

Seawater temp 23.4°C

Science and Technology Log

MeasureShark.jpg
I learn to measure my first (little) shark!

The ship has completed our deep-water sampling and we are now headed to more shallow areas, where there are likely to be more sharks and hopefully even some that have been tagged in the past.  With each shark we catch, we record in a database their measurements and exactly where they were caught.  If things are going well with the shark out of water, we also take a fin clip, a blood sample, and attach a tag.

Tag-and-recapture is one way for wildlife biologists to estimate population size.  You can compare the number of tagged sharks to newly caught sharks, and then extrapolate using that ratio to the total number of sharks in the area.


P1050255
Volunteers help enter data into the “Toughbook” computer.

Recapturing a tagged shark also helps scientists determine the age of a shark, as well as its rate of growth.  In bony fish, it is possible to examine the otoliths (bony structures in the ear) to determine the age of a fish.  However, since sharks do not have bones, scientists must use other ways to determine their ages and track their growth.  One of the scientists on board (my roommate) is collecting shark vertebrae so that her lab can use growth rings in the vertebrae to assess their age, sort of like counting the rings on a tree stump.


Personal Log

The past few days have put all my seasickness remedies to the test with waves over 6 feet and plenty of rolling on the ship.  The good news is that they have been working pretty well for the most part – I’ve only lost my lunch once so far!  One “cure” for seasickness is to stay busy, which has been difficult to do because the high winds and lightning have made it unsafe to do any sampling.

Fortunately, the crew’s lounge is well-stocked with movies, so I have watched quite a few while we wait for the waves to calm down and the thunderstorm to pass.  The lounge has some cushioned benches long enough to stretch out on, which is key because being horizontal is the best way for me to minimize my seasickness.


Kids’ Questions

  • How do you put the tag on?

    P1050392
    Data collection sheet and shark tagging tool.

The tag for smaller sharks is a bit like a plastic earring, but on the shark’s dorsal fin.  First you have to “pierce” the fin with a tool like a paper hole-punch, and then use another tool to snap in the tag  — making sure that the ID numbers are facing out.  If the shark is a species that will outgrow a plastic roto tag, they get a skinny floating tag inserted just under their dorsal fin.

  • How does the tag stay on the shark?

The shark heals the wound made by the tag, and the scar tissue holds the tag in place. Because the tags are made of plastic and stainless steel, they do not rust or deteriorate in the ocean.

P1050391
Tagged dorsal fin of Mustelus sinusmexicanus.
  • How do they make the tags? 

The NOAA fisheries lab orders tags from manufacturing companies, and are similar to tags used on domestic animals like cows.  Each tag includes a phone number and the word “REWARD,” so that if fishermen catch a tagged shark they can report it.

  • What are they doing with the shark tagging data?

Tagging the sharks in the Gulf of Mexico allows us to figure out how fast they are growing and how far they are traveling.  Measuring all the sharks also helps scientists understand how the populations of different species might be changing.  Some clues to changing populations include catching smaller or fewer sharks of one species.

Cathrine Prenot: Sea Speak. July 25, 2016

NOAA Teacher at Sea
Cathrine Prenot
Aboard Bell M. Shimada
July 17-July 30, 2016


Mission: 2016 California Current Ecosystem: Investigations of hake survey methods, life history, and associated ecosystem

Geographical area of cruise: Pacific Coast from Newport, OR to Seattle, WA

Date: Sunday, July 24, 2016

Weather Data from the Bridge

Lat: 47º32.20 N
Lon: 125º11.21 W
Speed: 10.4 knots
Windspeed: 19.01 deg/knots
Barometer: 1020.26 mBars
Air Temp: 16.3 degrees Celsius
Water Temp: 17.09 degrees Celsius


Science and Technology Log

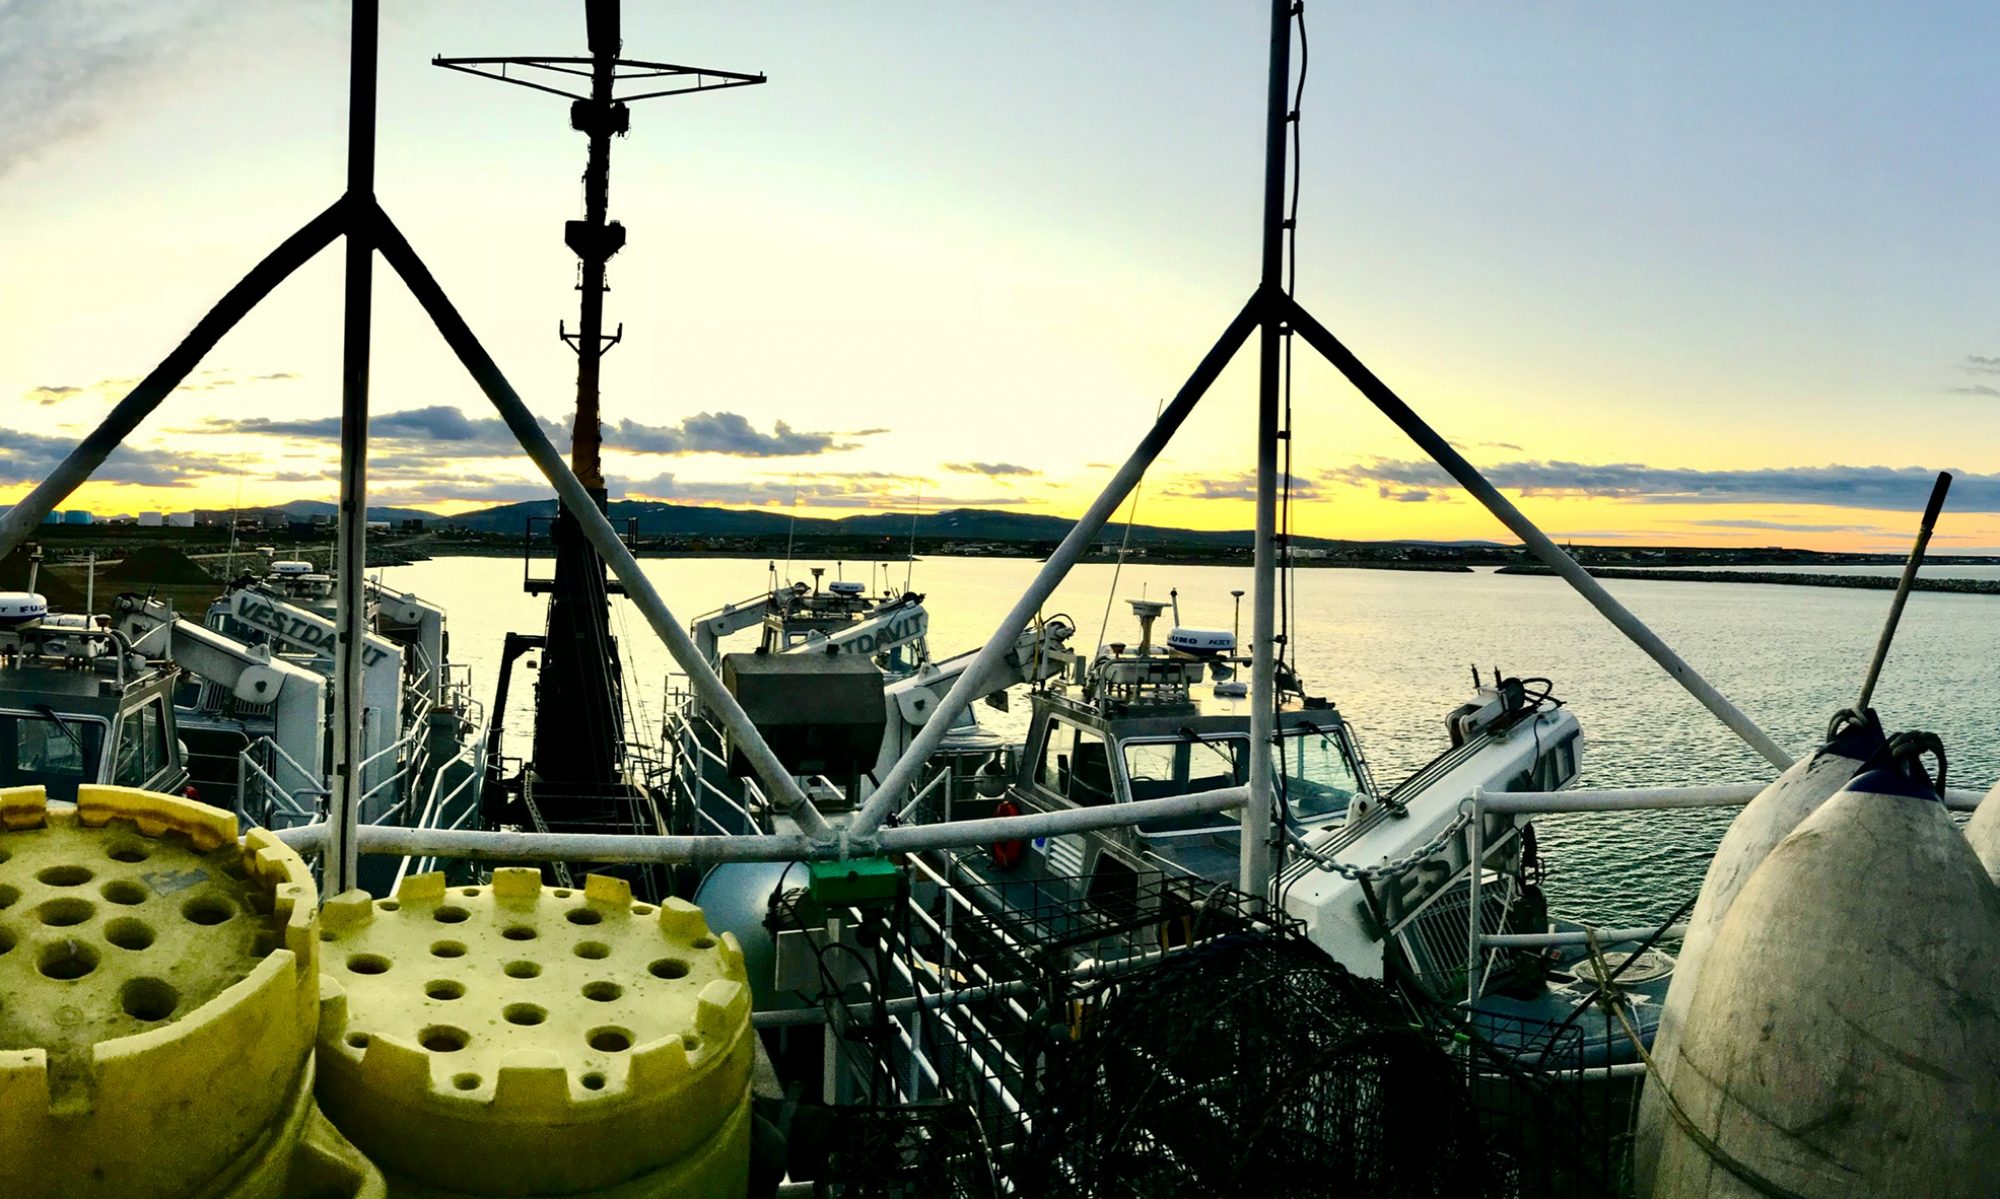
Typical evening view from the flying bridge of the Bell M. Shimada

We have been cruising along watching fish on our transects and trawling 2-4 times a day. Most of the trawls are predominantly hake, but I have gotten to see a few different species of rockfish too—Widow rockfish, Yellowtail rockfish, and Pacific Ocean Perch (everyone calls them P.O.P.)—and took their lengths, weights, sexes, stomachs, ovaries, and otoliths…

…but you probably don’t know what all that means.

The science team sorts all of the catch down to Genus species, and randomly select smaller sub-samples of each type of organism. We weigh the total mass of each species. Sometimes we save whole physical samples—for example, a researcher back on shore wants samples of fish under 30cm, or all squid, or herring, so we bag and freeze whole fish or the squid.

For the “sub samples” (1-350 fish, ish) we do some pretty intense data collection. We determine the sex of the fish by cutting them open and looking for ovaries or testes. We identify and preserve all prey we find in the stomachs of Yellowtail Rockfish, and preserve the ovaries of this species’ females and others as well. We measure fish individual lengths and masses, take photos of lamprey scars, and then collect their otoliths.

Fish Otolith showing concentric growth rings from here.

Otoliths are hard bones in the skull of fish right behind the brain. Fish use them for balance in the water; scientists can use them to determine a fish’s age by counting the number of rings. Otoliths can also be used to identify the species of fish.

Here is how you remove them: it’s a bit gross.

Otolith instructions from here.
Cod, Redfish, and Hake otoliths from here.


A bigger fish species does not necessarily mean a larger otolith. From here.

If you want to check out an amazing database of otoliths, or if you decide to collect a few and want to see what species or age of fish you caught, or if you are an anthropologist and want to see what fish people ate a long time ago? Check out the Alaska Fisheries Science Center—they will be a good starting spot.  You can even run a play a little game to age fish bones!

Pacific Ocean Perch, or P.O.P.


Personal Log

I haven’t had a lot of spare time since we’ve been fishing, but I did manage to finagle my way into the galley (kitchen) to work with Chief Steward Larry and Second Cook Arlene. They graciously let me ask a lot of questions and help make donuts and fish tacos!  No, not donut fish tacos.  Gross.

How to make friends and influence people

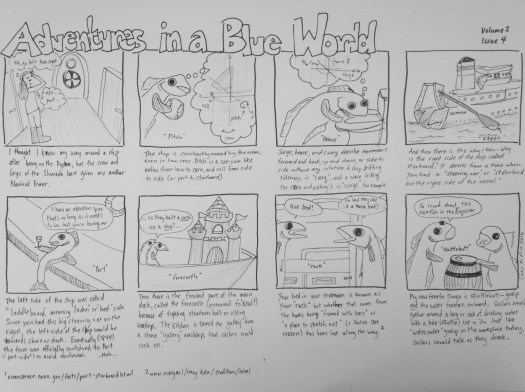
Working in the galley got me thinking of “ship jargon,” and I spent this morning reading all sorts of etymology.  I was interested to learn that the term crow’s nest came from the times of the Vikings when they used crows or raven to aid navigation for land.  Or that in the days of the tall ships, a boat that lost a captain or officer at sea would fly blue flags and paint a blue band on the hull—hence why we say we are “feeling blue.”  There are a lot more, and you can read some interesting ones here.

You can also click on Adventures in a Blue World below (cartoon citations 1 and 2).

TAS Cat Prenot 2016 cartoon4 v2

And here is a nautical primer from Adventures in a Blue World Volume 1:

A Nautical Primer part I from 2011 aboard the Oscar Dyson
A Nautical Primer from 2011 aboard the Oscar Dyson


Did You Know?

Working in the wet lab can be, well, wet and gross. We process hundreds of fish for data, and then have hoses from the ceiling to spray off fish parts, and two huge hoses to blast off the conveyor belt and floors when we are done. But… …I kind of love it.

Yay Science!
Yay Science!

Resources

Etymology navy terms: http://www.navy.mil/navydata/traditions/html/navyterm.html

Interestingly enough, the very words “Sea Speak” have a meaning.  When an Officer of the Deck radios other ships in the surrounding water, they typically use a predetermined way of speaking, to avoid confusion.  For example, the number 324 would be said three-two-four.


Cristina Veresan, Icthysticks and Otoliths? August 9, 2015

NOAA Teacher at Sea
Cristina Veresan
Aboard NOAA Ship Oscar Dyson
July 28 – August 16, 2015 

Mission: Walleye Pollock Acoustic-Trawl survey
Geographical area of cruise: Gulf of Alaska
Date: Sunday, August 9, 2015

Data from the Bridge:
Latitude: 59°28.8’ N
Longitude: 145°53.2’ W
Sky: Rain
Visibility: 7 miles
Wind Direction: SSE
Wind speed: 13 knots
Sea Wave Height: 1-2 feet
Swell Wave: 3 feet
Sea Water Temperature:  16.0°C
Dry Temperature:  14.5°C

Science and Technology Log

Our wet lab is outfitted with novel technology that makes processing the catch much more efficient. All of our touchscreen computers in the wet lab are running a program, designed by MACE personnel, called Catch Logger for Acoustic Midwater Survey (CLAMS). Once we enter the haul number and select the species that were caught, most of the data populates automatically from the lab instruments. For example, the digital scale is synced with the computer, so the weights are automatically recorded in CLAMS when a button is pushed. Also, an electronic fish measuring board called the “Icthystick,” designed by MACE IT specialist Rick Towler, is used to measure fish lengths. The fish’s head is placed at one end of the measuring board; when you place a finger stylus (with a magnet mounted inside it) at the end of the tail, the length is automatically recorded in CLAMS. The CLAMS system creates a histogram (type of graph) of all the lengths measured, and scientists archive and review this important data.

CLAMS
The CLAMS program records our catch
IMG_0101
The “Icthystick” AKA “Fish Stick” Photo by Darin Jones
scale
A digital scale connected to the CLAMS system

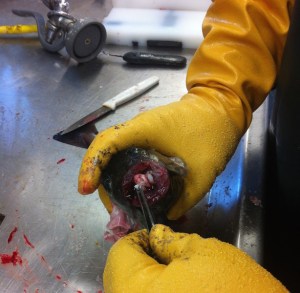
What can fisheries scientists learn from a pollock’s ear bones? The ear bones, called otoliths, have layers that can be counted and measured to determine the fish’s age and growth over the years of its life. Fish otoliths are glimpses into the past and their layers of proteins and calcium composites can sometimes offer clues about climate and water conditions as well. For our sub-sample of pollock, in addition to length, weight, and sex data, we will remove and archive the otoliths. We have to slice into the head and extract the two bony otoliths with forceps. The otoliths are then placed into a vial of ethanol with a bar code that has been scanned into the CLAMS system and assigned to the individual pollock they came from. Therefore, when all the otoliths are sent back to the lab in Seattle, ages of the fish can be confirmed. We sometimes collect other biological samples as well. In Seattle, there are scientists working on special projects for certain species, so sometimes we take a fin clip or an ovary sample from fish for those colleagues.

IMG_7695
After a slice is made across the head, the otoliths can be removed with forceps
vial
The otoliths in glycerol thymol (the bar code is on the opposite side of the vial)


Shipmate Spotlight: An interview with Rick Towler 

rick
Rick Towler, IT Specialist Photo by Darin Jones

What is your position on the Oscar Dyson?
I am an IT Specialist at MACE. I spend about 4 weeks total at sea and the rest of my time in our Seattle office. I have been in my position for 11 years.

What training or education do you need for your position?
My background is in wildlife biology, but I have had a lifelong interest in computers and electronics. I was lucky enough to get an internship with a physical oceanographer and started writing data analysis software for him. That got me on my career path, but for the most part, I have taught myself.

What do you enjoy the most about your work?
I love the freedom to creatively solve problems. There’s a lot of room to learn new things in my position. Like when we started on the “Icthystick” I had never done any electronics like that but I was able to innovate and make something that works. The scientists provide the goals and I provide the gear!

Have you had much experience at sea?
No, I get seasick! I am usually the first to go down with it. Before I joined MACE I had no real sea time. When I get sick, I just have to rest and take medication. I am so lucky that this leg of the survey has been very calm.

What are your duties of your position in Seattle and at sea?
In general, I write software and design and develop instruments to help us do our job better. Along with my colleague, Scott Furnish, I am also responsible for installing and maintaining the equipment used during the survey. When at sea, I make sure all the data is being backed up. I respond to any equipment issues and fix things that are not working properly.

When did you know you wanted to pursue a marine career?
I did not necessarily know I wanted a marine career, but I knew I wanted to be involved in science. I love that my job now is a mix of natural science and computer technology. It’s important to me to have a job I think is meaningful.

What are your hobbies?
I enjoy family time: playing with my kids and hiking and biking together. I also love playing with my dog and building things with my kids.

What do you miss most while working at sea?
Pizza! And my family and my dog.

What is your favorite marine creature?
Tufted puffin because they are cute. I’m a bird guy.

Inside the Oscar Dyson: The Bridge

bridge
The main console (left) and the navigation station (right)

The bridge of a ship is an enclosed room or platform from which the ship is commanded. Our bridge is commended by officers of the NOAA Corps, one of the uniformed services of the United States. From the bridge, officers can control the ship’s movements, radar, IT (information technology), communications, trawling and everything else to operate the ship. Full control of the ships generators and engines is from the engine room, although there is a repeater display, so officers can monitor these systems. In our bridgethere is a main console from which the ship is steered. There are also consoles on other sides of the room, so the officers can control the ship when we are pulling up to the dock or when equipment is being deployed off the stern, starboard side, or port side. There is a navigation station where charts are stored and courses are plotted. For our cruise, courses are plotted on paper charts as well as two different digital charts. The bridge is surrounded by windows and the view is incredible!

Personal Log

Each fish we catch has a particular scent, some more “fishy” than others. But when Darin told me to smell a capelin (Mallotus villosus) I discovered something quite surprising. The small, slender fish smells exactly like cucumber. Or should I say that cucumbers smell exactly like capelin? It is amazing!

me
Capelin are in the smelt family: I smelt a smelt!

After all these clear sunny days, we had our first foggy one, a complete white out! It gave me an appreciation for the officers that have to navigate through these conditions using radar alone. I also noticed the fog horn sounded every two minutes; Ensign Ben told me that this is a nautical rule when visibility is less than 2 miles and the ship is underway. In between blasts, I scooted out to the bow to take the photo below.

fog
Thick fog surrounded us

I have seen two different whales on my trip so far. I saw one humpback whale from a distance while it was feeding. It was tough to make out the whale itself, but it was easy to spot the flock of birds that was gathered on the water’s surface. I have also always wanted to see an orca whale, and I finally got my chance. It was a fleeting encounter. I had just stepped out onto the deck and saw an orca surface. I raised my camera as it surfaced again and managed to take a picture of the dorsal fin. Unfortunately, our ship and the whale were cruising pretty fast in opposite directions. But it was still a magical moment to observe this amazing creature in its natural habitat.

whale
A feeding humpback whale
orca
A cruising orca whale

Like I have said before, working on a moving platform has its challenges. Even getting around a ship presents a unique set of peculiarities. First of all, most doorways have 4-inch rails on the floor. When you are stumbling down at 4am to begin your shift or excitedly moving outside to see a whale, you have to keep those in mind! Most interior doors are pretty standard, although some come equipped with hooks at the top in order to secure them open. However, the exterior doors are watertight and must be handled appropriately. To open them from either side, you first have to push the lever up and then open the door by the handle. It is really important to avoid placing your hand in the door frame while the door is open because the thick, heavy door would crush your hand is if it swung shut. For this reason, and to keep the ship secure, you also have to remember to close these doors behind you and pull down the lever on the other side. On account of a nearby storm, we are supposed to get some big seas overnight, so now everything must be secured!

Ah, the joys of shipboard living!

sea
(from left) a raised door frame, a latch on the back of a door, and a watertight exterior door

Andrea Schmuttermair, Pollock Processing Gone Wild, July 12, 2015

NOAA Teacher at Sea
Andrea Schmuttermair
Aboard NOAA Ship Oscar Dyson
July 6 – 25, 2015

Mission: Walleye Pollock Survey
Geographical area of cruise: Gulf of Alaska
Date: July 12, 2015

Weather Data from the Bridge:
Latitude: 55 25.5N
Longitude: 155 44.2W
Sea wave height: 2ft
Wind Speed: 17 knots
Wind Direction: 244 degrees
Visibility: 10nm
Air Temperature: 11.4 C
Barometric Pressure: 1002.4 mbar
Sky:  Overcast

Science and Technology Log

I’m sure you’re all wondering what the day-to-day life of a scientist is on this ship. As I said before, there are several projects going on, with the focus being on assessing the walleye pollock population. In my last post I talked about the transducers we have on the ship that help us detect fish and other ocean life beneath the surface of the ocean. So what happens with all these fish we are detecting?

The echogram that shows data from the transducers.

The transducers are running constantly as the ship runs, and the information is received through the software on the computers we see in the acoustics lab. The officers running the ship, who are positioned on the bridge, also have access to this information. The scientists and officers are in constant  communication, as the officers are responsible for driving the ship to specific locations along a pre-determined track. The echograms (type of graph) that are displayed on the computers show scientists where the bottom of the ocean floor is, and also show them where there are various concentrations of fish.

This is a picture of pollock entering the net taken  from the CamTrawl.
This is a picture of pollock entering the net taken from the CamTrawl.

When there is a significant concentration of pollock, or when the data show something unique, scientists might decide to “go fishing”. Here they collect a sample in order to see if what they are seeing on the echogram matches what comes up in the catch. Typically we use the Aleutian wing trawl (AWT) to conduct a mid-water trawl. The AWT is 140 m long and can descend anywhere from 30-1,000 meters into the ocean. A net sounder is mounted at the top of the net opening. It transmits acoustic images of fish inside and outside of the net in real time and is displayed on a bridge computer to aide the fishing operation. At the entrance to the codend (at the end of the net) a CamTrawl takes images of what is entering the net.

This slideshow requires JavaScript.

Once the AWT is deployed to the pre-determined depth, the scientists carefully monitor acoustic images to catch an appropriate sample. Deploying the net is quite a process, and requires careful communication between the bridge officers and the deck crew. It takes about an hour for the net to go from its home on deck to its desired depth, and sometimes longer if it is heading into deeper waters. They aim to collect roughly 500 fish in order to take a subsample of about 300 fish. Sometimes the trawl net will be down for less than 5 minutes, and other times it will be down longer. Scientists are very meticulous about monitoring the amount of fish that goes into the net because they do not want to take a larger sample than needed. Once they have determined they have the appropriate amount, the net is hauled back onto the back deck and lowered to a table that leads into the wet lab for processing.

Here the scientists, LT Rhodes, and ENS Kaiser assess the catch.

We begin by sorting through the catch and pulling out anything that is not pollock. We don’t typically have too much variety in our catches, as pollock is the main fish that we are after. We have, however, pulled in a few squid, isopods, cod, and several jellies. All of the pollock in the catch gets weighed, and then a sub-sample of the catch is processed further. A subsample of 30 pollock is taken to measure, weigh, collect otoliths from, and occasionally we will also take ovaries from the females. There are some scientists back in the lab in Seattle that are working on special projects related to pollock, and we also help these scientists in the lab collect their data.

The rest of the sub-sample (roughly 300 pollock) is sexed and divided into a male (blokes) and female (sheilas) section of the table. From there, the males and females are measured for their length. The icthystick, the tool we use to measure the length of each fish, is pretty neat because it uses a magnet to send the length of the fish directly to the computer system we use to collect the data, CLAMS. CLAMS stands for Catch Logger for Acoustic Midwater Survey. In the CLAMS system, a histogram is made, and we post the graphs in the acoustics lab for review. The majority of our pollock so far have been year 3. Scientists know this based on the length of pollock in our catch. Once all of the fish have been processed, we have to make sure to clean up the lab too. This is a time I am definitely thankful we have foul weather gear, which consists of rubber boots, pants, jackets and gloves. Fish scales and guts can get everywhere!

This slideshow requires JavaScript.

Personal Log

Here is one of many jellies that we caught. .

I am finally adjusting to my nighttime shift schedule, which took a few days to get used to. Luckily, we do have a few hours of darkness (from about midnight until 6am), which makes it easier to fall asleep. My shift runs from 4pm-4am, and I usually head to bed not long after my shift is over, and get up around noontime to begin my day. It’s a little strange to be waking up so late in the day, and while it is clearly afternoon time when I emerge from my room, I still greet everyone with a good morning. The eating schedule has taken some getting used to- I find that I still want to have breakfast when I get up. Dinner is served at 5pm, but since I eat breakfast around 1 or 2pm, I typically make myself a plate and set it aside for later in the evening when I’m hungry again. I’ll admit it’s a little strange to be eating dinner at midnight. There is no shortage of food on board, and our stewards make sure there are plenty of snacks available around the clock. Salad and fruit are always options, as well as some less healthy but equally tasty snacks. It’s hard to resist some of the goodies we have!

Luckily, we are equipped with some exercise equipment on board to battle those snacks, which is helpful as you can only walk so far around the ship. I’m a fan of the rowing machine, and you feel like you’re on the water when the boat is rocking heavily. We have some free weights, an exercise bike and even a punching bag. I typically work out during some of my free time, which keeps me from going too crazy when we’re sitting for long periods of time in the lab.

Up on the bridge making the turn for our next transect.

During the rest of my free time, you might find me hanging out in the lounge watching a movie (occasionally), but most of the time you’ll find me up on the bridge watching for whales or other sea life. The bridge is probably one of my favorite places on the ship, as it is equipped with windows all around, and binoculars for checking out the wildlife. When the weather is nice, it is a great place to sit outside and soak in a little vitamin D. I love the fact that even the crew members that have been on this ship for several years love seeing the wildlife, and never tire of looking out for whales. So far, we’ve seen orcas, humpbacks, fin whales, and Dall’s porpoises.


Did you know? Otoliths, which are made of calcium carbonate, are unique to each species of fish.

Where on the ship is Wilson?

Wilson the ring tail camo shark is at it again! He has been exploring the ship even more and made his way here. Can you guess where he is now?

Where's Wilson?
Where’s Wilson?
Where's Wilson?
Where’s Wilson?

Nikki Durkan: Fish Heads and Otoliths, June 21, 2015

NOAA Teacher at Sea
Nikki Durkan
Aboard NOAA Ship Oscar Dyson
June 11 – 30, 2015

Mission: Midwater Assessment Conservation Survey
Geographical area of cruise: Gulf of Alaska
Date: Sunday, June 21, 2015

Weather Data from the Bridge:
Wind speed (knots):  13.01
Sea Temp (deg C):  10.45
Air Temp (deg C): 9.46

Career Highlight

Meet:  Patrick Ressler PhD, Chief Scientist on board the Oscar Dyson

Employed by: Resource Assessment and Conservation Engineering Division
Alaska Fisheries Science Center, NMFS, NOAA

Hails from: Seattle, Washington

Fun in the fish lab!  Happy Father's Day, Patrick!
Fun in the fish lab! Happy Father’s Day, Patrick!

What are your main responsibilities as Chief Scientist? As chief scientist I’m responsible for the scientific mission and for the scientific party.  In terms of the science, it’s my job to make sure that everything that needs to happen does happen, before as well as during the cruise, and that the scientists have positive and productive interactions with each other and with the ship’s crew.  Some of the decisions that need to be made are scientific or technical, some are logistical, some are managerial.  Though I don’t and can’t do all of the different jobs myself, I need to have some understanding of all the elements of our survey work and research projects, and pay attention to the ‘big picture’ of how it all fits together.   I am also the main line of communication between the scientific party and the ship (principally the captain), and between our scientific party and the lab back onshore.

What do you enjoy about your profession? Science involves a great deal of creativity and collaboration. The creativity comes into play when designing a study and also when problem solving; complications always arise in research, and it is part of Patrick’s job to address the issue or know who to ask to assist in overcoming the obstacle.  He also enjoys doing literature reviews because the process involves more than data collection and meta-analysis; the studies tell stories in a way, scientists leave clues about their interests, bias, and even personalities in their pursuit of research topics.

Do you eat fish? Yes! — Patrick uses the seafood guide when making decisions about purchases and eats salmon often. He smokes his own fish and looks forward to cooking at home with his wife and two children.

Vinny (TAS) and Emily Collins bringing in the catch of the day.
Vinny (my co-TAS) and Emily Collins bringing in the catch of the day.
Otolith extraction - the head incision is made just in front of the operculum (gill covering)…not my favorite part of the day, but as close as I’ll ever get to be a surgeon.
Otolith extraction – the head incision is made just in front of the operculum (gill covering)…not my favorite part of the day, but as close as I’ll ever get to be a surgeon.


Science and Technology Log

Fish heads and more fish heads: Once on board, the fish are sorted by species and we then determine length, weight, sex, and gonad development for the Pollock. The next step is to extract the otoliths, a calcium carbonate structure located in the skull that allows the fish to hear and provides orientation information. These small structures provide scientists with data on ages of the Pollock populations and environmental fluctuations. Understanding how Pollock populations respond to stresses such as the pressures of commercial fishing operations or variations in prey availability, help fisheries managers make informed decisions when setting quotas each year.


Pollock otolith
Pollock otolith

These structures are analogous to the human ear bones; the otoliths allow the fishes to determine horizontal and vertical acceleration (think of the feeling you experience while moving up and down in an elevator). The otoliths pull on the hair cells, which stimulate an auditory nerve branch and relay back to the brain the position of the head relative to the body. A disturbance in this function is also why we humans experience motion sickness. Many of you may also be familiar with the growth rings of a tree and how scientists can measure the width of the rings to determine age and growth rate; similarly, each year, a fish will accumulate deposits on the otoliths that can be interpreted by scientists back in the lab. NOAA has a neat program you can try: Age Reading Demonstration. My co-Teacher at Sea (Vinny Colombo) and I will be bringing back samples to use in our classrooms!

My cod-face with a Cod that tried to swallow a Pollock. Photo credit:  Patrick Ressler
My cod-face with a Cod that tried to swallow a Pollock. Photo credit: Patrick Ressler

For some species, the information gathered from these otoliths can also be used to infer characteristics about the environment in which the fish travels. Climate scientists use similar data from trees, ice cores, coral reef cores, and sediment deposits to produce geochemical records used in modeling paleoclimates and projecting future changes in climate. Likewise, the otoliths contain a geochemical record because the calcium carbonate and trace metals correlate with water samples from certain areas. Scientists can then ascertain the otolith’s chemical fingerprint using a mass spectrometer and uncover information on the fishes’ spawning grounds and migration routes. In some cases, these data are even used to establish marine protected areas.

Personal Log

I have great appreciation for the hard work the crew puts in on a daily basis and am thankful for the humor they continue to provide! I’ve seen more than a few impressions of overly stuffed Puffins and fish faces, shared laughs while Rico pulls fish scales out of my hair, danced to Persian pop songs, and continued to laugh at the ridiculously overused puns in the Bridge. Humor is vitally important out here! The ship operates 24 hours a day and shifts are long, with spurts of demanding physical labor. A lot of coffee is consumed on board and the Oscar Dyson even has a fancy espresso machine! Sadly, I figured out early on that coffee makes me quite nauseated on board. I am a firm believer in the health benefits of coffee and thanks to John Morse (a fellow teacher at Steamboat Mountain School), I have accumulated many scientific articles to back up my claims; however, in this case I had no choice, and after a few headaches, I am free from the bean addiction…for now!

Trying out the engine room sound powered phone


Did you know? In the event of a power failure, the Oscar Dyson is equipped with sound powered phones – the sound pressure created when a person speaks into the transmitter creates a voltage over a single wire pair that is then converted into sound at the receiver – no electricity necessary!

DJ Kast, Drifter Buoy! May 29, 2015

NOAA Teacher at Sea
Dieuwertje “DJ” Kast
Aboard NOAA Ship Henry B. Bigelow
May 19 – June 3, 2015

Mission: Ecosystem Monitoring Survey
Geographical area of cruise:
George’s Bank
Date: May 29, 2015, Day 11 of Voyage

Drifter Buoy!

My buoy and I- ready to deploy!  Photo by Jerry Prezioso
My buoy and me ready to deploy! Photo by Jerry Prezioso

NOAA has an Adopt a Drifter program! The program is meant to work with K-16 teachers from the United States along with international educators. This program provides teachers with the opportunity to infuse ocean observing system data into their curriculum. This occurs by deploying or having a research vessel deploy a drifter buoy. A drifting buoy (drifter) is a floating ocean buoy equipped with meteorological and/or oceanographic sensing instruments linked to transmitting equipment where the observed data are sent. A drifting buoy floats in the ocean water and is powered by batteries located in the dome. The drifter’s sea surface temperature data are transmitted to a satellite and made available to us in near real-time. The teachers receive the WMO number of their drifting buoy in order to access data online from the school’s adopted drifter. Students have full access to drifting buoy data (e.g., latitude/longitude coordinates, time, date, SST) in real or near real-time for their adopted drifting buoy as well as all drifting buoys deployed as part of the global ocean observing system. They can access, retrieve, and plot as a time series various subsets of data for specified time periods for any drifting buoy (e.g., SST) and track and map their adopted drifting buoy for short and long time periods (e.g., one day, one month, one year).

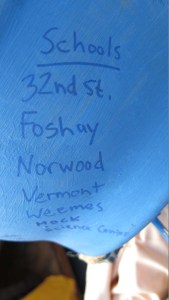
I am receiving one from the Chief Scientist onboard the NOAA Ship Henry B. Bigelow so the students in all my programs can access it, and this will be helpful to convey modeling of currents, and can help build models of weather, climate, etc .I was so excited when I found out that the chief scientist would be giving me a drifter for me and my students to follow. I decorated the buoy with programs that have inspired me to apply to the Teacher at Sea Programs, the current programs I am working for at USC (JEP & NAI), my family, and my mentors.

Representing the USC Readerplus Program that hosts my Wonderkids Programs.  Photo by Jerry Prezioso.
Representing the USC Readerplus Program that hosts my Wonderkids Programs. Photo by Jerry Prezioso.
Quick change into my NOAA Teacher at Sea Shirt. Thank you so much for all these opportunities.  Photo by Jerry Prezioso.
Quick change into my NOAA Teacher at Sea Shirt. Thank you so much for all these opportunities. Photo by Jerry Prezioso.
Special recognition to JEP, USC Dornsife, and my Young Scientist Program & NOAA TAS! Photo by DJ Kast
USC Wonderkids and USC Seagrant Logos. Photo by DJ Kast


Thanks to NMEA and the USC Wrigley Institute, USC Catalina Hyperbaric Chamber for continuously supporting my ocean going adventures. Photo by DJ Kast
Thanks to NMEA (National Marine Educators Association) and the USC Wrigley Institute, USC Catalina Hyperbaric Chamber for continuously supporting my ocean going adventures (Plus my favorite gastropod, Spanish Shawl Nudibranch for color). Photo by DJ Kast
Representing Rossier, USC QuikSCience, and the NOAA Henry B. Bigelow Ship. Photo by DJ Kast
Representing Rossier, USC NAI, USC QuikSCience, and the NOAA Ship Henry B. Bigelow Ship. Photo by DJ Kast


Important family that have always supported me with my science education career. Photo by DJ Kast


My list of ocean educators that inspire me to always strive for more. Photo by DJ Kast
My list of ocean educators that inspire me to always strive for more. Plus a shout-out to the Level the Playing Field Institute, and their USC (Summer Math and Science Honors) SMASH program.  Photo by DJ Kast
Special thanks to the schools participating in the USC Young Scientist Program and USC Wonderkids Programs. Photo by DJ Kast


JEP HOUSE and Staff!

JEP House and Dornsife Represent! Photo by DJ Kast
Important JEP People's.  I forgot to take a final picture of this but this included Brenda, Adrienne, and Mandy. Photo by DJ Kast
Important JEP People’s.
I forgot to take a final picture of this but this included Brenda, Adrienne, and Mandy. Photo by DJ Kast

I am teaching a marine biology class this summer for the USC Neighborhood Academic Initiative program. I am so excited to be following the drifter buoy # 39708. It was launched at 8:53 EDT on May 28th, 2015 and its first official position is: 41 44.8 N 065 27.0 W. I will definitely be adapting a few of the lesson plans on the following site and creating my own to teach my students about weather, climate, and surface currents.

http://www.adp.noaa.gov/lesson_plans.html

Deployment:

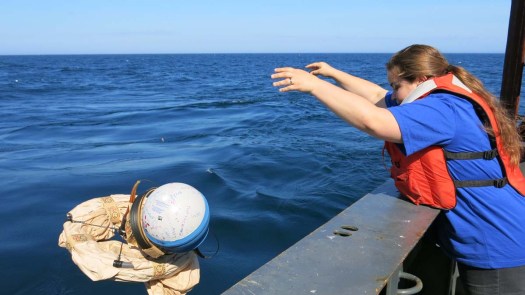
To deploy the buoy, you literally have to throw it overboard and make sure it hits nothing on its way down. When it is in the water, the cardboard wraps dissolve away, and the cloth drogue springs open, filling with water and causing the buoy to drift in surface water currents instead of wind currents.  The tether (cable) and drogue (long tail that is 15 meters long) will unwrap and extend below the sea surface where it will allow the drifter to float and move in the ocean currents

Photo of the drogue deployed in the water. From the NOAA Adopt a Drifter Program website.
Deploy the Buoy! Photo by Jerry Prezioso
My buoy in the Water! Photo by DJ Kast
My buoy in the Water! The cardboard wraps will dissolve away, and the cloth drogue will spring open and fill with water allowing the buoy to drift in surface water currents instead of wind currents.   Photo by DJ Kast

Since I was now an expert drifter buoy deployer, I was also able to deploy a buoy from the St. Joseph’s school in Fairhaven, Massachusetts. This drifter buoy’s tracking number is: 101638 and launched on May 28th, 2015 at 8:55 EDT and its first official position is: 41 44.9 N 065 27.0 W

Photo of me with the St. Joseph buoy that will also be deployed. Photo by Jerry Prezioso.
Ready to deploy. Photo by: XO LCDR Patrick Murphy

Tracking the buoy (from Shaun Dolk):

The easiest way to track these buoys in real-time is to use the Argos website https://argos-system.clsamerica.com/cwi/Logon.do.

Guest account:  Username: BigeloTAS and Password: BigeloTAS.

  1. Once logged in, select the “Data access” tab on the top left side of the screen.
  2. Select “Mapping”; a pop-up window will appear.
  3. Ensure “by ID numb. (s)” is selected from within the “Platform:” option (top left).
  4. Enter your desired ID number in the search field at the top of the screen.
  5. Enter the number of days for which you’d like data (20 days is the maximum).
  6. Select “Search” to generate a trajectory plot for the given parameters.

**Please note, because you can only view the 20 most recent days of data, you’ll need to save the data if you wish to view the entire track line!**

To save data into Google Earth format, simply click on the Google Earth image (second tool from the right on the map settings bar, found just below the “Search” tab). You’ll need to save data at least every 20 days to ensure no interruptions in your final track line. Of course, to view the track line in its entirety, open Google Earth and ensure all of the data files are selected. If you desire to look at the data, not the track lines, go to “Data access”, then “Messages”, and enter your desired ID numbers. Again, data is only accessible for the most recent 20 days, so if you’d like to download the data for archival purposes, go to “Data access”, then select  “Message download”. From here, you’ll want to save the data in .csv, .xls, or .kml format.

My buoy 39708 is transmitting properly and providing quality data! Below are some of the maps of its early trajectory and its current movement so far.

Photo sent by Shaun Dolk
Early Trajectory! Photo sent by Shaun Dolk
Map-2015-05-29-15-40-17
Photo sent by Shaun Dolk

PS for Science- Otoliths

While we were deploying the buoys one of the engineers named Rahul Bagchi brought over a strainer that is attached to the water intake pipe. The strainer was covered in Sand Lances.

Sand Lances on the inside of the strainger. Photo by Dj Kast
Sand Lances on the inside of the strainer. Photo by DJ Kast
IMG_7567
Sand Lances on the outside of the strainer. Photo by DJ Kast


Fortunately, there are another two scientists on board that need sand lance samples for their research purposes and they were collected. My research scientist friend Jessica needs the otoliths or fish ear bones for part of her research on cod, since sand lances are eaten cod. Otoliths are hard, calcium carbonate structures located behind the brain of a bony fish. Different fish species have differently shaped otoliths. They are used for balance and sound detection-much like our inner ears. They are not attached to the skull, but “float” beneath the brain inside the soft, transparent inner ear canals. The otoliths are the most commonly used structure to both identify the fish eaten by consumers up the food chain, and to age the fish itself.

Otoliths and time scale. Photo by NOAA NEFSC
Otoliths with the winters pointed out. Photo by: Bedford Institute of Oceanography

The otoliths also have daily growth bands. Alaskan Fishery scientists manipulate the daily growth bands in salmon larvae creating an otolith tag that identifies where the fish came from by controlling the growth rate of their fish populations.

Photo of a tagged otolith from the Sawmill Bay fishery in Alaska. Photo from: Alaskan Fisheries

New material (protein and calcium carbonate) is added to the exposed surface of the otolith over time, showing a fish life history (otolith start growing at day 1 even in larval stages). The lighter zones have higher calcium deposit which is indicate summers, while darker zones have higher protein levels which indicate winter. One pattern of a light and dark zone indicate a year and is consequently how the fish is aged.

Tiny white speck is the sand lance otolith. Photo by DJ Kast
The sand lances Jessica and I were dissecting for otoliths. Photo by DJ Kast
She also took a base of the tail for her research as well. Photo by DJ Kast
She also took a white muscle sample from the dorsal surface of the fish for her research as well. Photo by DJ Kast

Jessica Lueders-Dumont is using the otoliths for three main purposes in relation to her Nitrogen Isotope work.

1. She is hoping to see the changes from year 1 to the adult years of the fish to give an accurate fish life history and how they relate to the rest of the Nitrogen isotopes in the area’s food chain.

2. To see how current nitrogen isotopes compare to the archeological otoliths found in middens or sediment sites, since otoliths can be preserved for hundreds of years.

3. She is trying to create a baseline of nitrogen 15 in the Gulf of Maine so that she can see biogeochemical evidence of the N15 she finds in plankton in higher trophic levels like fish.

I will definitely be dissecting some fish heads with students to check for otoliths and using a microscope to age them.

PSS for Science:

The chief scientist and I decided we should put some Styrofoam Cups under pressure. This polystyrene foam is full of air pockets. This is important because the air pockets (volume) shrink with increasing pressure, essentially miniaturizing the cups.

I have done this before using the help of Karl Huggins at the USC Wrigley Institute’s Catalina Hyperbaric Chamber. We had a TA that wanted to teach about SCUBA diving so we had her students decorate Styrofoam cups and a head and placed it in the chamber. Apparently the Styrofoam was too good of a quality because it re-expanded on the way back up. http://www.youtube.com/watch?v=f6DDBFovht0

Also, I also found out you can do this with a pressure cooker- oh the experiments I will do when I get back. 😀

Before photos:

Front view of my NOAA TAS cup. Photo by DJ Kast
Back side of the NOAA TAS cup. Photo by DJ Kast
Just wanted it to say how amazing it has been on the NOAA Henry B. Bigelow. Photo by DJ Kast
Just wanted it to say how amazing it has been on the NOAA Ship Henry B. Bigelow. Photo by DJ Kast
I made a cup for my programs as well. Photo by DJ Kast
USC Wonderkids Program on a Styrofoam cup before shrinkage. Photo by DJ Kast.
Saying hi to all of my students from inside one of the cups. Photo by DJ Kast
In the mesh bag, and attached to the Rosette for shrinkage. Photo by DJ Kast

After Photos: the Styrofoam cups went down to 184 m or 603 ft on the Rosette/ CTD in South George’s Basin.

Shrunken Cups in the Mesh bag attached to the Rosette. Photo by DJ Kast
Shrunken Cups in the Mesh bag attached to the Rosette. It went down to 184 m or 603 ft Photo by DJ Kast
Look at these tiny cups! Photo by Jerry Prezioso
Cups compared to the original size (front). Photo by DJ Kast.
Cups compared to the original size (back). Photo by DJ Kast.