Mission: Hydrographic Survey- Approaches to Houston
Geographic Area of Cruise: Gulf of Mexico
Date: July 1, 2018
Weather Data from the Bridge
Latitude: 29° 10.1’ N
Longitude: 093° 54.5’ W
Visibility: 10+ NM
Sky Condition: 3/8
Wind: 16 kts
Temperature:
Sea Water: 29.4° C
Air: 27° C
Science and Technology Log
At this point I have been able to understand more of the sonar technology taking place during the survey aboard the Thomas Jefferson. The ship uses two types of sonar: multibeam and side scan. Both work together transmitting and receiving sound pulses to and from the ocean floor. This provides a multispectral analysis.
Julia Wallace, a physical scientist, works at the sonar acquisition station. This requires a large amount of multitasking as she communicates with the bridge (ship steering deck), watches the safety cameras, and makes sure both sonar devices are working correctly.
Multibeam sonar is located underneath the hull of the ship. Multibeam is used to detect bathymetry (the depth of the ocean floor). Multibeam backscatter (reflected wave energy) gives a reading of the surface intensity. For example, a strong signal would mean a harder surface like rock or pipeline. With multibeam sonar, you can also adjust the sound wave frequency. For example, high frequency (primarily used during this survey in the Gulf of Mexico) is used for shallower waters allowing for higher resolution images. Images from multibeam have a color gradient to allow for clear vision of contours and depth differences. One way surveyors aboard the TJ may use backscatter images is to determine areas where bottom sampling might be applicable.
A NOAA ship using mulitbeam sonar. (Courtesy of NOAA)Bathymetry acquired using multibeam echosounder layered over a nautical chart. Blue and green wave lengths penetrate further in water, so the coloring corresponds to this observation. This poster is from a previous Thomas Jefferson hydrographic survey near Savannah, Georgia. (Prepared by CHST Allison Stone)3D bathymetry imagery from the Okeanos Explorer. (NOAA)A close-up view of multibeam data. The third window down shows multibeam backscatter.
The side scan sonar is used alongside multibeam to provide black and white scans of images. Like multibeam backscatter, side scan measures the intensity of the sound returning from the sea floor. For example, a side scan return with high intensity could indicate a difference in material like pipeline or a wreck. A low intensity value could mean that the side scan sonar waves have reached a muddy substrate. Julia used the analogy of a tennis ball being bounced against a wall of different materials. For example, the tennis ball hitting a concrete wall would bounce back with higher intensity than one being bounced against a soft wall. Side scan sonar is very effective at detecting features that protrude off the sea floor, and for shallow water surveys, typically can see farther and cover a greater area the sea floor than multibeam echosounders alone.
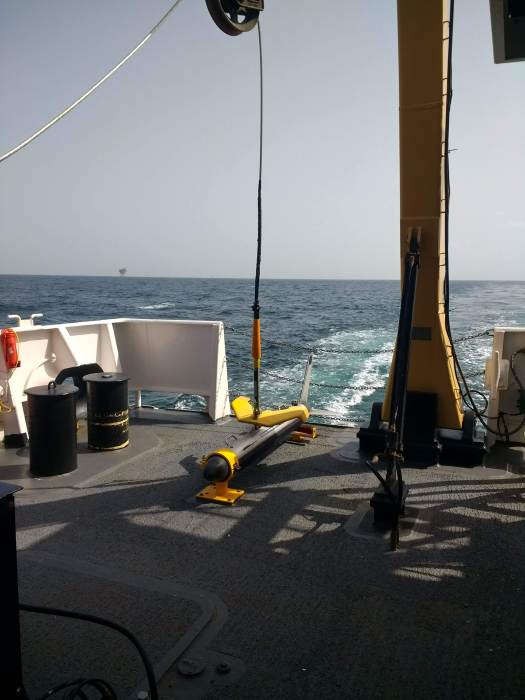
The side scan sonar sensor is located on a torpedo-shaped “towfish” and pulled behind the boat. When viewing side scan images, surveyors typically look for the acoustic shadow cast by a feature protruding off the sea floor. By measuring the length of the acoustic shadow, hydrographers can determine whether the feature requires additional investigation. For example, the outline of a shipwreck, bicycle, or pipeline. However, it can also detect mammals like dolphins or schools of fish.
Diagram of side scan sonar. (Courtesy of thunder bay 2001, Institute for Exploration, NOAA-OER)The Thomas Jefferson sidescan sonar on deck.In the early morning, the sidescan sonar picked up the image of an incorrectly charted shipwreck. Height is estimated using the “shadow” of the wreck.Sidescan sonar imagery layered on a nautical chart. It is important to remember that sidescan data does not account for depth, it is a measure of differences in sea floor substrate.Look closely and you can see arc lines in the sidescan imagery. Lt. Anthony Klemm explains that these arcs are from ships dragging anchor and stirring up the sea floor.
While this is happening, surveyors are also towing a MVP or Moving Vessel Profiler to capture information about the water column. This is important because multiple factors in the water column need to be corrected in order for accurate sonar calculations. For example, the speed of sound in salt water is roughly 1500 m/s but may change while the ship is traveling over different parts of the sea floor or passing through a thermocline (steep temperature gradient) or halocline (steep salinity gradient). The MVP is similar to the CTD used on the launch boat (see previous post), but the MVP allows the ship to continue moving at about 10 knots (average survey speed), while the CTD must be cast when the ship is stationary.
Information from the Moving Vessel Profiler. From left to right, the MVP tracks sound speed, temperature, and salinity in relation to depth.
For more information on multispectral analysis and sonar, see these resources:
One of my goals in the classroom is to teach students to be comfortable making and learning from mistakes. Making mistakes in math and science is common and welcome because they lead to great discussion and future change. Often, my sixth graders get discouraged or so caught up in failure that they become paralyzed in making further attempts. While aboard the Thomas Jefferson, I have witnessed several aspects not go according to plan. I think these experiences are important to share because they provide real-life examples of professionals coming together, learning from mistakes, and moving forward.
Around 4:00 am, the towfish side scan sonar became entangled with the MVP. This was a horrendous disaster. The crew spent about 16 hours contemplating the issue and collecting data using the multibeam only, which is less than ideal. One of XO LCDR McGovern’s many roles aboard the ship is to serve as the investigator. She reviewed tapes of the early morning, talked with the crew, and later held a debrief with all involved. When something like this happens, the ship must write a clear incident report to send to shore. There were many questions about why and how this happened as well how to best proceed. In the end, the towfish and MVP were untangled with no damage present to the sensor. Within the same day, both were cast out and back in use.
I find this to be an astounding example of perseverance and teamwork. Despite being disappointed and upset that a critical tool for collecting accurate data was in dire shape, the crew came up with a plan of action and executed. Part of the engineering and scientific processes include evaluation and redesign. Elements of the sea and a center drift of the side scan lead to a documented new plan and refiguring the process so that this is unlikely to happen again.
Lt. Charles Wisotzsky’s sketch of the complications with launching both the sidescan sonar (which tends to centerline) and MVP towfish with a current coming from port side.This camera image captures the entanglement of the sidescan sonar and MVP.
Peaks
+Saw a tuna eat a flying fish
Flying Fish. (www.ocean.si.edu)
+There is a large sense of purpose on the ship. Despite complex sleep schedules to enable 24 hour operations with a smaller crew, people are generally happy and working hard.
+ There seems to be an unlimited supply of ice cream in the ice cream freezer. Junior Officer, ENS Garrison Grant introduced me to a new desert- vanilla ice cream, a scoop of crunchy peanut butter, and chocolate syrup. I also found the rainbow sprinkles.
Geographic Area of Cruise: Pacific Ocean; U.S. West Coast
Date: June 29, 2017
Weather Data from the Bridge
Date: June 29, 2017 Wind Speed: 7.7 kts
Time: 6:15 p.m. Latitude: 4805.5N
Temperature: 12.7oC Longitude: 12520.07W
Science and Technology Log
The technology present on this ship is amazing and at the same time quite overwhelming. These systems allow for data to be collected on a wide range of variables both continuously and simultaneously. Below are a couple of photos of the acoustics room where multiple sensors are monitoring the feedback from sonar systems placed below the ship’s hull. One of the acoustic probes sends out sound waves in a cone-like formation directly below the ship. Another unit emits sound waves in a horizontal pattern. The ship was designed to run as quietly as possible so as to not disturb the marine life present in the waters as the ship passes by and also to reduce the interference of the ship’s sounds with the acoustics feedback.
Acoustics technician Dan Palance manages multiple computers
Acoustics technician Dan Palance managing the multiple computers that are constantly collecting data.
Multiple programs help to eliminate the “noise” received by the probes until all that remains are images that represent schools of fish and their location relative to the ocean floor.
Diagram of Multibeam Sonar System
Diagram of Multi-frequency scientific sounder
The images above were taken from a poster on board the Reuben Lasker. They illustrate the range of the water column surveyed by the various acoustic systems.
The “soundings” are received by the ship, processed and “cleaned up” using a series of program algorithms. The image below shows the feedback received from one of the systems.
Displays of feedback from an acoustics system
Once the background “noise” has been eliminated, the resulting image will show locations of fish, school size, and the depth (y axis) at which they can be found.
Graph of acoustic feedback, with background “noise” eliminated, depicting depth and size of fish schools
Extension question for my students reading this: Approximately how deep are the schools of fish being picked up by the sonar at this location?
Acoustics aren’t the only tools used to try pinpoint the locations of the fish schools. As I wrote about on an earlier blog, the CUFES egg sampler is used to monitor the presence of fish eggs in the waters that the ship passes over. Water samples are analyzed every half hour. If egg samples appear in an area where there is also a strong acoustics signal, then that may be a location the ship will return to for the night’s trawl. The main focus of this trip is to monitor the anchovy and sardine populations, so extra attention is paid to the locations where those eggs appear in the samples.
Personal Log:
Each time we drop the net for an evening trawl it is always retrieved with a bit of suspense: What’s going to be in the net this time? How big is the haul? Will we capture any of the key species or haul in something completely different?
I can honestly say that while on board there were no two hauls exactly the same. We continued to capture large quantities of pyrosomes – unbelievable amounts. Check out the net-tearing load we encountered one night. We literally had to weigh them by the basketful!
Here I am getting ready to help unload this large catch.
TAS Dawn White prepares to help unload large catch
Net-tearing load of pyrosomes!
Above is the codend of the net filled with pyrosomes and fish. A 5-basket sample was pulled aside for analysis. The remainder was simply classified and massed.
While I was certainly don’t need to see another pyrosome any time soon, there were plenty of other times when some very unique species made an appearance!
Pacific Jack MackerelSolitary Common SalpTAS Dawn White holds a Blue SharkDogfish Shark
Did you know?
The dogfish shark (pictured above) was one of about 50 or so that were caught in the same haul. We had trawled through a school that was feeding on the small fish found at the ocean surface during the evening hours. This is the same species of shark that is commonly provided to students for dissection. Use the search terms “dogfish shark dissection” and see what you find!
Geographical area of cruise: Latitude: N 57˚50 Longitude: W 153˚20 (North Coast of Kodiak Island)
Date: June 23, 2016
Weather Data from the Bridge: Sky: Clear Visibility: 10 Nautical Miles Wind Direction: 268 Wind Speed: 14 Knots Sea Wave Height: 2-3 ft. on average Sea Water Temperature: 12.2° C (54° F) Dry Temperature: 16° C (60.8° F) Barometric (Air) Pressure: 1023 mb
Science and Technology Log
I’m continually searching for ways to connect what I am learning to what is relevant to my students back home in the Midwest. So, as we left Homer, AK for our survey mission in Kodiak Island’s Uganik Bay, I was already thinking of how I could relate our upcoming survey work to my students’ academic needs and personal interests. As soon as the Rainier moved away from Homer and more of the ocean came into view, I stood in awe of how much of our planet is covered with water. It’s fascinating to think of our world as having one big ocean with many basins, such as the North Pacific, South Pacific, North Atlantic, South Atlantic, Indian, Southern and Arctic. The study of ocean and its basins is one of the most relevant topics that I can teach when considering the following:
the ocean covers approximately 70% of our planet’s surface
the ocean is connected to all of our major watersheds
the ocean plays a significant part in our planet’s water cycle
the ocean has a large impact on our weather and climate
the majority of my students have not had any firsthand experience with the ocean
Earth’s One Big Ocean as seen from outside of Homer, AK
Each of the ocean basins is composed of the sea floor and all of its geological features which vary in size and shape. The Rainier will be mapping the features of the sea floor of the Uganik Bay in order to produce detailed charts for use by mariners. The last survey of Uganik Bay was completed in 1908 when surveyors simply deployed a lead weight on a string over the edge of a boat in order to measure the depth of the water. However, one of the problems with the charts made using the lead line method, is that the lead line was only deployed approximately every 100 meters or more which left large gaps in the data. Although not in the Uganik Bay, in the 1930s NOAA began using single beam sonar to measure the distance from a ship’s hull to the sea floor which made surveying faster but still left large gaps in the data. Fast forward from approximately 100 years ago when lead lines were being used for surveying to today and you will find the scientists on the Rainier using something called a multibeam sonar system. A multibeam sonar system sends out sound waves in a fan shape from the bottom of the ship’s hull. The amount of time it takes for the sound waves to bounce off the seabed and return to a receiver is used to determine water depth. The multibeam sonar will allow our team on the Rainier to map 100% of the ocean’s floor in the survey area that we have been assigned.
Evolution of Survey Techniques (Illustration Credit: NOAA)
NOAA Ship Rainier June 22, 2016 in Uganik Bay off of Kodiak Island
All Aboard!
NOAA Corps Junior Officer Shelley Devereaux
The folks I am working with are some of the most knowledgeable and fascinating people that I have met so far on this voyage and Shelley Devereaux from Virginia is one of those people. Shelley serves as a junior officer in the NOAA (National Oceanic and Atmospheric Administration) Corps and has been working aboard the Rainier for the past year. The NOAA Commissioned Officer Corps is one of the seven uniformed services of the United States and trains officers to operate ships, fly aircraft, help with research, conduct dive operations, and serve in other staff positions throughout NOAA.
Here is what Shelley shared with me when I interviewed her one afternoon.
Tell us a little about yourself: I’m originally from the rural mountains of Appalachia and moved to Washington DC after college. I lived in DC for about seven years before I joined the NOAA Corps and while in DC I really enjoyed cycling, hiking, cooking, baking and beer brewing.
How did you discover NOAA Corps and what do you love most about your job in the NOAA Corps?
I went to Washington DC after I received my undergraduate degree in math and worked a lot of different jobs in a lot of different fields. In time, I decided to change careers and went to graduate school for GIS (Geographic Information Systems) because I like the data management side of the degree and the versatility that the degree could offer me. I was working as a GIS analyst when my Uncle met an officer in the NOAA Corps who talked with my Uncle about the NOAA Corps. After that, my Uncle told me about NOAA Corps and the more I found out about NOAA Corps the more I liked it. Especially the hydro side! In the NOAA Corps each of your assignments really develops on your skill base and you get to be involved in a very hands on way. Just this morning I was out on a skiff literally looking to determine what level a rock was in the water. And, later in my career I can serve an operations officer. So I loved the fact that I could join the NOAA Corps, be out on ship collecting data while getting my hands dirty (or at least wet!), and then progress on to other interesting things. I love getting to be part of all the aspects of ship life and being a surveyor. It’s a wonderful feeling knowing that what we do here has a tangible effect on the community and the public because we are making the water safer for the people who use it.
NOAA Corps Junior Officer Shelley Devereaux manages her sheets during near shore work in Uganik Bay
What are your primary responsibilities when working on the ship?
I am an ensign junior officer on a survey ship. Survey ships operate differently than other ships in the NOAA fleet with half of my responsibilities falling on the junior officer side of ship operations which includes driving the ship when we are underway, working towards my officer of the deck certification, working as a medical officer, damage control officer and helping with emergency drills. The other half of what I get to do is the survey side. Right now I am in charge of a small section called a sheets and I am in charge of processing the data from the sheets in a descriptive report about the area surveyed. So, about half science and half ship operations is what I do and that’s a really good mix for me. As a junior officer we are very fortunate that we have the opportunity to and are expected to learn the entire science of hydrography.
Junior Officer Shelley Devereaux checks the ship’s radar
What kind of education do you need to have this job and what advice do you have for young people interested in a career like yours?
You need a college degree with a lot of credits in science and/or math. Knowing the science that is happening on the ship is important to help your understanding of the operations on the ship which helps you be a better ship operator. Realize that there are a lot of opportunities in the world that are not always obvious and you need to be aggressive in pursuing them.
Personal Log
You didn’t think I’d leave out the picture of Teacher at Sea in her “gumby suit” did you? The immersion suit would be worn if we had to abandon ship and wait to be rescued.
Teacher at Sea (TAS) Kurth Hi Mom!
Happy Solstice! Quirky but fun: For the past six years I have celebrated the solstice by taking a “hand picture” with the folks I am with on the solstice. I was thrilled to be aboard the Rainier for 2016’s summer solstice and include some of the folks that I’m with on the ship in my biannual solstice picture.
Winter Solstice 2015 with Sisu (family pet) and my husband JamesAll Hands on Deck! Summer Solstice 2016
Did You Know?
Glass floats or Japanese fishing floats are a popular collectors’ item. The floats were used on Japanese fishing nets and have traveled hundreds and possibly thousands of miles via ocean currents to reach the Alaskan shoreline. The floats come in many colors and sizes and if you’re not lucky enough to find one while beach combing, authentic floats and/or reproductions can be found in gift shops along the Alaskan coast.
NOAA Teacher at Sea Jeanne Muzi Aboard NOAA Ship Thomas Jefferson August 2 – 8, 2015
Mission: Hydrographic Survey Geographical area of cruise: North Atlantic Date: August 7, 2015
Weather Data From the Bridge: Temperature:79°F (26°C) Partly Cloudy
Humidity: 41%
Wind Speed: W 9 mph
Barometer: 29.89 in (1012.0 mb)
Dewpoint: 53°F (12°C)
Visibility: 10.00 mi
Heat Index: 79°F (26°C)
Science and Technology Log:
The Thomas Jefferson is in port at the naval base at Newport so the small launch boats are being used for hydrographic survey training.
Last minute instructions on deck.Lowering the Launch into the water!Onto the launch..…and we are off!
On my two trips out, I have absorbed an enormous amount of information about how to set up all the computer equipment so each part “talks” to the other, how to know if the underwater multi-beam sonar is set correctly, how to lengthen or shorten the swath of the beams so the “pings” travel the correct distance/speed and how to examine the survey data and discuss what is seen (for example, is that disturbance we see the wake from a passing ship? Are we running the lines too close to the jetty? Is that an underwater cable? Do you see that large school of fish moving?).
Coordinating all the tasks on all the screens is important.Learning about multi-beam sonarExamining data
Doug Wood, a senior hydrographic survey technician, explained how to start the generator on the launch, turn on all the surveying and charting technology and created different scenarios so that we could set various lines to survey. Once we had our location, the Coxswain (the person in charge of steering and navigating the boat) could guide the launch along that line and we could begin logging data. As the sonar began delivering data to the screen, we were able to see rocks, buoys and even large fish that appeared along with their shadows. The multi-beam sonar was capable of picking up lots of information about what was on the sea floor.
Gassing up the launch. Photo credit: Stephanie StabileReturning to the ship!
If you are interested in finding out more about how NOAA maps with sound, take a look at this article by clicking on this link:
Look at how detailed NOAA’s nautical charts must be:
Personal Log:
One of the most interesting parts of being on the Thomas Jefferson has been having conversations with everyone onboard. It seems that every officer, engineer, seaman or steward has a remarkable story about the path that brought him or her to serve on NOAA’s TJ.
Yesterday, I had a chance to ask three Junior Officers and a Lieutenant J.G. some questions about their work. Ensign Katie Seberger, Ensign Marybeth Head and Ensign Max Andersen were kind enough to let me chat with them as they worked in the chartroom updating checklists and working to improve safety routines. LTJG Matthew Forrest took a minute to talk with me in the mess. When I asked what the best thing about their job was, each answered that they really enjoyed their work.
Ensign Katie Seberger and Ensign Marybeth Head
Ensign Seberger explained that she had loved the ocean and wanted to study marine science her whole life and the best part of her job is being out on the water. Ensign Head said that doing something for the big picture is the best and it is easy to get really excited about her work. Ensign Andersen said the best part of his job has been getting a chance work with the Z boats; the newest surveying tool the crew of the TJ will begin using soon. LT.JG Forrest said that it was the opportunity to be a part of something much bigger than you, and contribute every day to something important. He also said an enjoyable part of his job is working with a great team.
Ensign Max Andersen
Each of the officers had to think about what the worst part of their job was. Ensign Seberger said that while it is exciting to travel, it is sometimes hard not knowing where you are going next. Ensign Head said that for her, it is difficult to be disconnected from the water, and that even though she is sailing on a ship, she grew up on small boats with the salt spray on her face, and she misses that. Ensign Andersen said the worst thing is the uncertainty of the ship’s schedule and not knowing where you will be next. LTJG Forrest said the worst thing is the lack of sleep because it is not unusual for them to be up working for 16 hours sometimes. He also said it was hard to be so far from his family and disconnected from everything going on at home.
LTJG Matthew Forrest
Each of the officers had great advice for young students who would like to one day do the type of work they do. Ensign Seberger suggested that its important to volunteer doing what you think you would like to work at so you can find out if it is for you. Ensign Head’s advice to students was to be “persistent and memorable.” She explained that you need to keep at whatever you are doing and not give up. The people that quit will be forgotten. The people that keep working will not. Ensign Andersen’s advice to young students is to make your own path and don’t settle for the status quo. He thinks you might have to work harder to make your way, but it’s worth it. LTJG Forrest felt that kids should understand that all the work done on the Thomas Jefferson is built on a foundation of the fundamentals of math and science so all kids should try to soak up as much math and science as they can. He also said to always be ready to work hard.
Each of the officers said they enjoy their work very much and could not imagine doing anything else!
In my last blog entry the Question of the Day was:
Why is surveying the ocean floor so important?
The ocean floor is covered with all sorts of things including natural things, like rocks, reefs, hills and valleys, and manmade objects, such as cables, docks, shipwrecks and debris. If ships don’t know where things are it can be very dangerous. Storms often change the position of things underwater so it is very important that charts are accurate and updated. Hydrographers capture the data from the seafloor using sonar, process the data and utilize the information to create precise and informative ocean charts.
In my last entry, The Picture of the Day showed an anchor ball. An anchor ball is a round, black shape that is hoisted in the forepart of a vessel to show that it is anchored. It must be taken down when the ship is underway.
Anchor Ball
Today’s Question of the Day is:
How was the ocean floor mapped before sonar was invented?
Today’s Picture of the Day: What is Ensign Gleichauf lowering into the water?
The last couple of days have been the best ever: beautiful weather, hard work, deep science. We acquired data along the continental shelf and found a cool sea floor canyon and then set benchmarks and tidal gauges.
In hydrography, we gather data in seven steps, by determining: our position on Earth, depth of water, sound speed, tides, attitude (what the boat is doing), imagery and features. Step 1 is to determine where we are.
In this picture you can see a GOES satellite antenna (square white one) that is used to transmit tide data ashore and a GPS antenna (the small white eggs shaped one) that provides the tide gauge with both position and UTC time. Photo by Barry JacksonIn this picture Brandy Geiger, Senior Survey Technician, uses GPS to record the positions of the benchmarks we have just set for the tide gauge. Photo by Barry JacksonWhere we are happens to be the most beautiful place on earth. Photo by Barry Jackson
In Step 2, we determine the depth of the water below us.
Bathymetry is a cool word that means the study of how deep the water is. Think “bath” water and metry “measure.” When your mom tells you to get out of the tub, tell her to wait because you’re doing bathymetry.
As I explained in my first blog, we measure depth by sending out a swath of sound, or “pings,” and count how long it takes for the pings to return to the sonar, which sits beneath the ship or smaller boat.
Yesterday we used the multi-beam sonar to scan the sea floor. Here is a screen shot of the data we collected. It looks like a deep canyon, because it is!
Here is the image of the sea floor canyon Starla Robinson, a Senior Survey Technician, and I discovered. We decided it should be named Denla Canyon, after the two scientists who discovered it.
Here I am, gathering pings.
While collecting data, I kept in contact with “the bridge,” the team responsible for navigating the ship, by radio to ensure the ship’s safety and maximum, quality data acquisition. Photo by Starla Robinson
Step 3, we take into consideration the tide’s effect on the depth of the water. Tides are one predictable influence on water depth. There are over 38 factors or “constituents” that influence the tides. The gravitational pull of the sun and the moon at various times of the day, the tilt of the earth, the topography, and many other factors cause water to predictably bulge in different places on earth at different times. The Rainier crew works 24 hours a day and 7 days a week, so they must find a way to measure depth throughout the days and month, by taking into account the tide. Arthur Doodson, who was profoundly deaf, invented the Doodson Numbers a system taking into account the factors influencing tide in 1921. Flash forward to the 21st century, our Commanding Officer, Commander Rick Brennan worked with a team of NOAA scientists to develop a software program called TCARI, as an alternate method to do tide adjustments, taking into account 38 factors, even the moon’s wobble. Inventions abound at NOAA.
The Rainier crew worked for 14 hours today to set up a tide gauge station, an in depth study of how the tide affects our survey area. On this map, there is a Red X for each tide gauge we will install. This process only happens at the beginning of the season, and I feel fortunate to have been here–the work we did was….amazing.
Each Red X is approximately where a tide gauge will be installed. The one we installed today in Driver Bay is in the north west corner of the sheet map.
You can see an animation here that shows the combined effect of two sine waves that produce a signal like our tide data. Just imagine what it looks like when you factor in 38 different variables.
The earth goes around the sun in 24 hours and moon goes around the earth in a little more than 12 hours, much like these two gray sine waves. Interestingly, when you add two different waves, you get the wonky blue sine wave, with ups and downs. This combined effect of the sun and the moon (two dots) causes the ups and downs of the tide (blue wave). Graph taken from Russell, D. Acoustics and Vibration Animation, PSU, http://www.acs.psu.edu/drussell/demos/superposition/superposition.html.
Low tide is the best time to see sea stars, mussels and barnacles, but it is also a more hazardous time in the tidal cycle for mariners to travel. Therefore, navigational charts use the mean lower low water level, low tide, for the soundings, or depth measurements on a chart. The black numbers seen on a nautical chart, or soundings, represent depth measurements relative to mean lower low tide. Driver Bay, the area on the chart where we installed the tide gauge today, is the crescent shaped bay at the northwest end of Raspberry Island.
This is a nautical chart used to help mariners navigate safely.
Installing Tide Gauge Stations
Before gathering sonar data, ground and boat crews install a tide gauge to measure changes in water level and to determine the mean lower low water level datum. A tide gauge is a neat device that has air pumped into it, and uses air pressure, to determine how deep the water is. The tide gauge uses a formula of (density of sea water)(gravity)(height) = pressure. The gauge measures pressure, and we apply factors for gravity and sea water. The only missing factor is height, which is what we learn as the gauge collects data. This formula and nuances for particular locations is a fascinating topic for a blog or master’s thesis. Scientists are looking for tidal fluctuations and other location specific variances. Then, by computer they determine the mean lower low tide depth, factoring in the tidal fluctuations.
There are permanent tide gauge stations all over the world. The nearest permanent tide gauge station to our study area is in Kodiak and Seldovia. These permanent gauges take into account many factors that affect tides over a 19 year period of time, not just the gravitational pull of the moon.
The tide gauge stays in place for at least 28 days (one full tidal cycle). During the month, data of the tides is collected and can be compared to the other tide gauges we install.
Installing the Tide Gauges and Benchmarks
Excitement built as the crew prepared for the “Tide Party,” packing suitcases full of gear and readying the launches. Installing Tide Gauges signals the beginning of the season and is one of the few times crew gets paid to go on shore.
Why Bench Mark?
There are three reasons I have figured out after many discussions with patient NOAA crew as to why we put in bench marks.
I installed this benchmark in Driver Cove by having a hole drilled in bedrock and affixing the benchmark with concrete if anyone ever returns and needs to know their exact location. Photo by Barry Jackson
The first reason we install benchmarks is to provide a reference framework to ensure both our tide staff and the tide gauge orifice are stable and not moving relative to land. The second reason is if we ever come back here again to gather or compare data to previous years, we will know the elevation of the tidal datum at this location relative to these benchmarks and can easily install a new tide gauge. The third reason is that the earth and ocean floor changes constantly. As scientists, we need to make sure the survey area is “geologically stable.” We acquire several hours of GPS measurements on the primary benchmark to measure both its horizontal and vertical position relative to the earth’s reference frame. Should there ever be an earthquake here, we can come back afterwards and measure that benchmark again and see how much the position of the Earth’s crust has changed. After the last big earthquake in Alaska, benchmarks were found to move in excess of a meter in some locations!
Teacher on Land Polishing Her Benchmark Photo by Brandy Geiger
Installing the Benchmark
Today, our beach party broke into two groups. We located stable places, at about 200 foot intervals along the coastline. We drilled 5 holes on land and filled them with concrete. A benchmark is a permanent marker you may have seen at landmarks such as a mountain peak or jetty that will remain in place for 100 years or more. We stamped the benchmark by hand with a hammer and letter stamps with our station identification. If we chose a good stable spot, the benchmark should remain in the same location as it is now.
Tide Gauge
As one group sets up benchmarks, another group installed the tide gauge.
Here, Chief Jim Jacobson, Lead Survey Technician, sets up a staff, or meter stick, I used to measure the change in water depth and others used for leveling. Photo by Barry Jackson
To install the tide gauge, you must have at least three approved divers who install the sensor in deep water so that it is always covered by water. Because there were only two crew on board trained to dive, Lieutenant Bart Buesseler, who is a dive master, was called in to assist the team. The dive team secured a sensor below the water. The sensor measures the water depth with an air pressure valve for at least 28 days. During this time there is a pump on shore that keeps the tube to the orifice pressurized and a pressure sensor in the gauge that records the pressure. The pressure is equal to the number of feet of sea water vertically above the gauge’s orifice. An on-board data logger records this data and will transmit the data to shore through a satellite antenna.
Divers install the tide gauge, and spent most of the day in the cold Alaska waters. Good thing they were wearing dive suits! Photo by Barry Jackson
Leveling Run
After the gauge and benchmarks are in place, a group does a leveling run to measure the benchmark’s height relative to the staff or meter stick. One person reads the height difference between 5 different benchmarks and the gauge. Then they go back and measure the height difference a second time to “close” the deal. They will do the same measurements again at the end of the survey in the fall to make sure the survey area has not changed geographically more than ½ a millimeter in height! Putting the bubble in the middle of the circle and holding it steady, leveling, was a highlight of my day.
Observation
Finally, a person–me– watches the staff (big meter stick above the sensor) and takes measurements of the water level with their eyes every six minutes for three hours. Meanwhile, the sensor, secured at the orifice to the ocean floor by divers, is also measuring the water level by pressure. The difference between these two numbers is used to determine how far below the water’s surface the orifice has been installed and to relate that distance to the benchmarks we have just leveled to. If the numbers are consistent, then we know we have reliable measurements. I won’t find out if they match until tomorrow, but hope they do. If they don’t match, I’ll have to go back to Driver Bay and try again.
As we finished up the observations, we had a very exciting sunset exit from Raspberry Island. I was sad to leave such a beautiful place, but glad to have the memories.
Last minute update: word just came back from my supervisor, Ensign J.C. Clark, that my tidal data matches the gauge’s tidal data, which he says is “proof of my awesomeness.” Anyone who can swim with a car battery in tow is pretty awesome in my book too.
The data Starla Robinson and I collected is represented by the red line and the data the gauge collected is represented by the blue line. The exact measurements we collected are on the table.
Spotlight on a Scientist
Lieutenant Bart Buesseler came to us straight from his family home in the Netherlands, and before that from his research vessel, Bay Hydro II. The main reason our CO asked him to leave his crew in Chesapeake Bay, Maryland, and join us on the Rainier is because he is a dive master, capable of installing our sensors under water, and gifted at training junior officers.
Lieutenant Beusseler knows he needs to be particularly nice to the amazing chefs aboard Rainier, including Floyd Pounds, who cooks food from every corner of our ocean planet with a hint of a southern accent.
During his few years of service, LTJG Buesseler adventured through the Panama Canal, along both coasts of North America, and has done everything from repairing gear to navigating the largest and smallest of NOAA vessels through very narrow straits. He loves the variety: “if I get tired of one task, I rotate on to another to keep engaged and keep my mind sharp.” He explains that on a ship, each person is trained to do most tasks. For example, he says, “during our fast rescue boat training today, Cal led several rotations. But what if he is gone? Everyone needs to be ready to help in a rescue.” Bart says at NOAA people educate each other, regardless of their assignments, “cultivating information” among themselves. Everyone is skilled at everything aboard Rainier.
In the end, he says that all the things the crew does are with an end goal of making a chart. His motto? Do what you love to do and that is what he’s doing.
Personal Log
Today was a special day for me for many reasons. It is majestic here: the stark Alaskan peninsula white against the changing color of the sky, Raspberry Island with its brown, golden, crimson and forest green vegetation, waterfalls and rocky outcroppings. I’m seeing whales, Puffins, Harlequin Ducks and got up close with the biggest red fox ever. Most importantly, I felt useful and simultaneously centered myself by doing tide observations, leveling and hiking. I almost dove through the surf to make it “home” to the ship just in time for a hot shower. Lieutenant Buesseler’s reference to “cultivating information” rings very true to me. In writing these blogs, there is virtually nothing I came up with independently. All that I have written is a product of the patient instruction of Rainier crew, especially Commander Brennan. Each day I feel more like I am a member of the NOAA crew here in Alaska.
NOAA Teacher at Sea Susy Ellison Aboard NOAA Ship Rainier September 9 – 26, 2013
Mission: Hydrographic Survey Geographic Area: Carbondale, CO Date: November 5, 2013
Weather: You can go to NOAA’s Shiptracker (http://shiptracker.noaa.gov/) to see where the Rainier is and what weather conditions they are experiencing while I am back at school in Glenwood Springs, CO.
GPS Reading: 39o 24,13146 N 107o 12.6711 W
Temp: -8C
Wind Speed: 0
Barometer: 1026.00 mb
Visibility: Clear
Science and Technology Log
How do you become a hydrographer? After spending 2 ½ weeks aboard the Rainier as a Teacher at Sea, I found that this question had as many answers as the ship had hydrographers. In fact, if you take time to concatenate the data (obviously, I have become fond of my newest vocabulary word!), you will learn that being a hydrographer is incredibly multi-faceted and is a confluence of ocean-, cartographic-, and computer-based sciences, with some outdoor skills thrown in for good measure.
Cdr Rick Brennan and some of the hydrographers of the future in Cold Bay, Alaska
The Rainier’s CO, Commander Rick Brennan, finished college with a degree in Civil Engineering. In 1991, his senior year, he discovered NOAA when a professor suggested he check out the NOAA Corps during a recruiter’s visit to campus. He started as a NOAA Corps member in 1992 and has been involved in hydrographic survey work ever since. His studies in the NOAA Corps training included coursework on ships, radar, and navigation, and led to his appointment as Commanding Officer (CO) of the NOAA Ship Rude (http://www.moc.noaa.gov/Decomm Ships/ru-index.html). This ship was NOAA’s smallest hydrography vessel at only 90’ long.
Commander Brennan has seen many changes in hydrography during his career. First and foremost, has been its evolution as an academic discipline. The University of New Hampshire, based in Durham, NH, founded the Center for Coastal and Ocean Mapping in 1999. Their Joint Hydrographic Center was created through a partnership between the University and NOAA. (http://ccom.unh.edu/about-ccomjhc, http://www.eos.sr.unh.edu/) Prior to this, hydrography was part of more general courses in oceanography. Now, you can get a Master’s Degree in Hydrography.
The last 20+ years have also seen significant changes in hydrographic technology, especially in the tools used to map the ocean floor. Prior to 1994, hydrographic vessels were outfitted with single beam sonar, instead of the multi-beam sonar that is today’s standard. The single beam only provided bathymetric data at a single position on the seafloor directly below the vessel, while multi-beam sonar can give us high resolution information about the seafloor across a swath of the seafloor stretching several hundred meters to either side of the vessel. The Rainier, as NOAA’s premier hydrography vessel, was fully outfitted with multi-beam sonar by 1998. Other technological advances have included significant changes in information processing, from the days of paper tape and punch card programming, to the development of hydrography-specific data analysis programs such as CARIS.
While data collection capabilities have changed exponentially over the past 20 years, CDR Brennan noted changes in how that data is used. NOAA has set the industry standard worldwide for collecting hydrographic data. Departments within NOAA are able to use that data to more than make charts. Fisheries biologists can use the detailed seafloor information in their assessments of ecosystem health and the availability of suitable prey species for all parts of the complex ocean-based food web. Shorelines are dynamic; charting plays a role in establishing baseline data in a changing world. Brennan foresees a future where navigators will view charts using a variety of platforms besides merely lines on paper; this will take educating mariners in how to utilize some of the new electronic tools that are available.
Brennan reflected that, while there have been significant advances in the field of hydrography, there is still much work to do. NOAA publishes an annual review of its hydrographic survey goals (http://www.nauticalcharts.noaa.gov/hsd/NHSP.htm) . While this might not sound like the most scintillating of reads, it’s a fascinating look at the enormity of the concept of charting our coastline. Depending on how you view coastline—is it a smoothed-out line of the coast, does it include all the ins and outs and bays, or does it include all the United States’ navigable coastline extending out 200 nautical miles—one thing is certain, there’s a lot of it. In Alaska, alone, NOAA has identified 324,465 square nautical miles as Navigationally Significant. The identified total for all of the United States, including the Caribbean, is 511, 051 square nautical miles. Alaska is big! The crew of the Rainier will have plenty of work!
Chief Survey Technician Jim Jacobson at work in the computer lab
Chief Survey Technician Jim Jacobson’s favorite area to survey is Southeast Alaska with its varied topography, underwater features, and interesting ports. He should know, since he’s been a member of the Rainier’s survey crew since 1990. Jim graduated from the University of Washington with a degree in Oceanography—at that time there were no hydrography-specific programs. When he began, a large part of the training consisted of good old, OJT—on the job training, learning new skills as new equipment and techniques became available. Needless to say, there have been more than a few changes over the past 20+ years.
Jim began his career before GPS was a part of hydrographic survey. Setting benchmarks to establish sea levels was done using transits and theodolites, triangulating from known points on land to establish location and elevation on shore. Information was transmitted using microwave towers that were erected on site. Fast forward to 2013, where GPS is part of everyone’s vocabulary and the ability to know ‘exactly’ where you are is often in the palm of your hand. The Rainier’s tide gauge stations are set using GPS units that can identify location and elevation to within centimeters.
He also began his career using single beam sonar, instead of today’s multi-beam. While single beam doesn’t have the pinpoint accuracy that multi-beam sonar might offer, there were a few advantages. It was a faster way to collect data, since you weren’t collecting as much information with each ‘ping’. Thus, you could complete more ‘sheets’ (an identified area for mapping) during your time at sea.
There have been incredible advances in data analysis since Jim started on the Rainier. Data collected each day has become more complex, requiring more hours of ‘cleaning’ to remove extraneous pings and information. Hydrographers use increasingly complex computer software to produce charts, often spending up to 5 hours to process one hour’s data.
What’s next? Jim imagines a future with underwater mapping done by ROVs, remotely operated vehicles, cruising the seafloor to send back terabytes of information. ROVs are already used in a variety of information-gathering capacities, sending back high-quality video of seafloor conditions, information on water chemistry, or video of marine life from far below the surface.
Here’s what hasn’t changed–hydrographers work in all sorts of weather and ocean conditions!
Christi Reiser didn’t start out planning to be a hydrographer. She has, perhaps, the most diverse resume of any of the survey team. Christi is currently a college student, and will be receiving her BA in Geography from the University of Colorado, Denver at the end of this year. Her hydrography career began in May, 2012 when she was hired as an intern on the Rainier, earning college credit while working for NOAA.
Christi Reiser
Since high school, Christi has earned an Associate’s Degree in Business, was employed as a saddle maker in Austria, and worked for an oil company as a mapping technician. While all of those pathways gave her something to ponder, it was the GIS part of her mapping job that really ignited the fire that sent her back to college to pursue a degree in Geography with a focus on GIS and a minor in Environmental Science. To further stoke that fire, Christi worked to design and pursue an internship experience that would allow her to ‘test drive’ a career combining GIS, hydrography, and life on the high seas. Through a combination of motivation, Google-based searching, a diverse and applicable set of educational and experiential skills, and the courage to make some phone calls and take a few risks, Christi ended up on the Rainier, working as a paid intern. How cool is that? She earns college credit, gains expertise working with challenging software and data acquisition programs and equipment, charts the uncharted ocean floor, and sees parts of Alaska that aren’t on the usual tourist’s destination list. One of her projects during her first season on the Rainier was the creation of an online blog describing her work. You can check it out at http://rainierinternship.blogspot.com/
Through her internship Christi has found that NOAA is one of the most education-oriented organizations she has worked for, constantly providing opportunities to learn new skills and information. She is excited to be working in a GIS-based field and considers it to be one that is ‘never-ending’, since only 4% of the sea floor has been mapped! After graduation, her next step may be a Master’s Degree in Geography, to add more science research experience to her knowledge base. After that? Well, all I can say is that Christi plans to create a new job that “doesn’t even exist”. Stay tuned.
So, the next time you’re talking to your guidance counselor about college plans, or wondering what you might want to be when and if you grow up, consider the field of hydrography. Where else do you get to wear a life jacket to work?
Field Operations Officer (FOO)Meghan McGovern goes over the Plan of the Day. Where else do you get to wear a life jacket to work?
Personal Log
Now that I’ve been home a few weeks, it’s time to reflect on my Teacher at Sea experience. I’ve been asked, more than once, “Did it meet my expectations”? That’s an easy question to answer—the answer is “No, it exceeded my expectations!” I came away from my time on the high seas with much more than just knowledge of the complexities of seafloor mapping. As a firm believer in the concept that ‘everything is interesting’, it would be hard to point to any aspect of my trip that wasn’tsomething fun and interesting to learn!
The science of hydrography is amazing. Just thinking about mapping something that you can’t actually see is an incredible concept. I have always been fascinated with maps and the process of creating a map, but I look at those maps a little differently now, going beyond the story the map tells to thinking about how that map was made. The science of mapping has undergone many changes since those first sailors with their lead lines creating maps of harbors and shorelines. In case you’re still wondering why hydrography and the Rainier’s mission is so important, check out this clip from a PBS special that aired in September–http://www.pbs.org/newshour/bb/climate-change/july-dec13/arctic_09-17.html
The teamwork, efficiency, and camaraderie on the ship were a common thread uniting each day’s activities. Each crew member played a role in the success of the ship’s mapping mission. It took everyone from the engine room to the bridge to keep it all ‘shipshape’. There was really no job too small—everything and everyone had a necessary role. I especially appreciated the fact that every crew member was willing to answer the myriad questions I had; from specific questions about their job to questions about how they ended up on the Rainier.
Perhaps we should have used some of our sonar capabilities to search for the pot of gold at the end of this rainbow!
At the end of my Teacher at Sea experience I have to conclude that NOAA is one of our country’s best kept secrets. What other federal agency can bring you such treats as the daily weather report or tide predictions for an entire year, monitor fisheries along our coastal areas, keep track of our changing climate, or survey marine mammals? Of course, you shouldn’t forget all those nautical charts produced by the hydrographers on the Rainier. NOAA’s webpage says it all (http://www.noaa.gov/); from the ocean floor to the top of our atmosphere—and everything in-between. In a world with a rapidly changing climate I can’t think of an agency that is doing more important work.
Many thanks to NOAA and the Teacher at Sea program for providing me with this incredible learning experience.
NOAA Teacher at Sea Yaara Crane Aboard NOAA Ship Thomas Jefferson June 22, 2013 – July 3, 2013
Mission: Hydrographic Survey Geographical area of cruise: Mid-Atlantic Date: Saturday, June 22, 2013
Latitude: 38.81°N Longitude: 75.10°W
Weather Data from Bridge:
Wind Speed: 10.27 knots
Surface Water Temperature: 20.59°C
Air Temperature: 20.60°C
Relative Humidity: 79.00%
Barometric Pressure: 1023.18mb
Science and Technology Log
My first view of the NOAA ship Thomas Jefferson.
This morning I came aboard the Thomas Jefferson via small boat transfer from the pilot station dock in Lewes, Delaware. Since coming on board, I have been welcomed by so many people, toured the ship, had a safety training, cautiously drove the small boat around the Delaware Bay, and tried to learn some background about hydrographic surveys. That is quite a lot of new things to process in only 5 hours!
The major purpose of hydrography is to create a thorough imaging of the ocean floor, particularly to warn mariners of any obstructions or shallows. There is evidence that nautical charts showing depth have been in use since as early as the sixth century BCE, and can easily be created through the use of a lead weight and a string. These days, NOAA ships have much more high tech ways of surveying the ocean floor. The Thomas Jefferson spends most of its time at sea charting waterways and coastlines to ensure safe travels for both private and commercial mariners to be able to navigate safely. Priorities in a nautical charting mission are based on factors including: waterway usage rates, stakeholder requests, rates of change to the sea floor (both natural and anthropogenic), and age of the chart’s source. For example, a waterway to a port used by oil tankers would be very important to survey because the result of a tanker running headlong into an obstruction would be disastrous. After Hurricane Sandy hit the East Coast in October 2012, the Thomas Jefferson was assigned to survey the sea floor of New York City’s harbor in case of any new obstructions that might have been blown in undetected. No other ship was allowed to sail through the harbor until the Coast Guard received the new charts. So far this summer, the Thomas Jefferson has already spent countless hours surveying the area around Long Island Sound and the Delaware Bay.
To have a better grasp of the major scientific research that occurs on a hydrographic research vessel, I spent a portion of the afternoon speaking with Ensign Andrew Clos. Ensign Clos mentioned that the two most important tools for data collection are the side scan sonar (SSS) and the multi-beam echo sounder (MBES). These two tools work through the use of sound waves to collect both 2D and 3D data. The SSS and the MBES send sound waves which are reflected back to the ship and transformed into images analyzed by the scientists on board. The side scan sonar is towed by the ship in very carefully spaced horizontal lines to gather the initial data about the existence of any objects in the water. An acoustic image is created and analyzed for anything out of the ordinary, in which case the MBES is launched for further investigation. The MBES is hull-mounted to the ship and survey launches, and lets out sound waves in a 128° cone which much more accurately determines the depth and position of the object. The MBES can collect millions of data points in a day, which is converted into three-dimensional images.
This SSS image is of the wreck of the Herbert D. Maxwell. The white area to the upper right is called a shadow because the sonar cannot pass into that area. (Photo courtesy of NOAA)This MBES image shows a fuller picture of the wreck of the Herbert D. Maxwell. (Photo courtesy of NOAA)
The scientists aboard spend many hours sifting through the data, and correcting the data for differences in depth based on tidal flows and water data. Sound waves travel through water at approximately 1500 meters/second (m/s), much faster than the 340 m/s in air. However, differences in salinity and temperature can impact the accuracy of measurements. All of the branches of NOAA must work together to piece together the puzzle of the ocean floor.
Personal Log
Hanging out at the beach the day before getting aboard the TJ.
This has been quite a busy week for me, which has culminated in this spectacular adventure. Monday was our last day of final exams, and today I feel like that was a lifetime ago! I spent most of yesterday morning driving to Delaware, and was rewarded with spending the afternoon relaxing on Rehoboth Beach. As it turns out, relaxing is on the table for tomorrow, too. The TJ is waiting on a repair to the MBES, and will need to stay anchored close to port for at least one more day. Commander Krepp has allowed some of the members of the crew to arrange for a day out paddling and kayaking around the beach. Still, there is work to be done and safety to consider aboard a NOAA vessel, so even that excursion has to be carefully managed into two shifts.
Weather-wise, it has been a beautiful weekend. There is a slight breeze, but not enough to make waves worth mentioning. The TJ is also anchored just behind a breakwater which helps to keep waves at bay. All of this adds up to a very calm shipboard experience, with barely any feeling of rocking or swaying while aboard the ship. I have rarely suffered from motion sickness and hope to continue my good record throughout this cruise. No seasickness means I can make my way over to the ice cream bar for a little afternoon snack…
Did You Know?
Fossil remains of horseshoe crabs have been found spanning approximately the last 450 million years. They are called living fossils because they are some of the rare species that have survived extinction with little genetic diversity.
The horseshoe crab is a living fossil found on Delaware’s shores.
NOAA Teacher at Sea Sue Oltman Aboard R/V Melville May 22 – June 6, 2012
Mission: STRATUS Mooring Maintenance Geographical Area: Southeastern Pacific Ocean, off the coast of Chile and Ecuador Date: June 1, 2012
Weather Data from the Bridge: Air temperature: 23.7. C / 74.6 F
Humidity: 73.1%
Precipitation: 0.3 mm
Barometric pressure: 1013.15 mB
Wind speed: 4.7 kt SE
Sea temperature: 24.77 C
We are almost at the equator! The coordinates of the Galapagos Islands, where Puerto Ayora is, are 0, 90W. The weather has been warm but a nice pleasant breeze is going all the time – the trade winds, a constant wind out of the southeast. It’s helpful as the ship is heading in the same direction as the wind! When out on deck, it feels like perfect weather, it’s easy to forget how direct the sun is so close to the equator. Sunscreen is a necessity! We are approaching the place where every day is an equinox.
It’s neat to think I will be staying at a hotel on the equator (equalizer of day and night.) Students, when I get to my hotel I will check and see whether water goes down the drain clockwise or counterclockwise, as we discussed in science class!
Most of the crew will take the ship to its home port in San Diego after dropping the science team off in the Galapagos. A new team of scientists will be waiting to board. The Stratus Team is crunching away at data gathering and wrapping up our reports. Thoughts are starting to drift towards scenery of volcanic islands, beaches, giant tortoises and exotic birds which we look forward to seeing very soon! So the science continues, no matter where you go…but we have a few more days left as sailors!
The crew tries to arrange some fun on occasional nights as we have to make our own entertainment…there is no TV and very limited internet (quite slow when it works!) and of course, no leisurely phone calls or text conversations from out here in the deep blue. Sometimes it’s a movie – North by Northwest (a theme – our direction of travel), City of God, and a North Korean movie none of us had ever seen, as well as a poker game. Most of us have books we are reading, but it was a big surprise that there is a fantastic library here! It has a few dozen shelves of books, mostly fiction, something for everyone’s taste. I’ve already read two books and have started a third.
There are about twice as many books than are shown in this picture! The library also has a TV and DVD player for watching a movie.
There are few books on the Galapagos Islands floating around and we have all been skimming them to decide how we will spend our time when we arrive in port. Many of us like to listen to our iPods and I have mentioned before, spend some time exercising. Photography is a shared hobby, too, and now that our cruise is nearing an end, there is a lot of photo sharing going on. A few crew members find some spare time to fish from the side as we move forward. The ones that have been caught were shared at mealtimes. I especially enjoyed the yellowtail!
Being on a ship for a couple of weeks has also given me a look behind the scenes for every shipment of imports that comes across the seas to ports in theUnited States, such as Brunswick, Georgia. Each cargo ship has a crew of people bringing the goods over safely, loading and unloading, and doing it again. We have traversed over 2,000 miles and done it in excellent weather. The shipping industry and the goods my family and I use is something I had not given a second thought to before. I have a new appreciation for the maritime industry.
Science and Technology Log
Since deploying the moored buoy, we have put quite a few drifters in the water including the one I personalized for our school!
Elsie and Jamie launch a drifter, one of many data gathering instruments that will drift with the current and report ocean temperature, and its location is tracked online.
Since we are getting closer to land, there is a higher likelihood of finding fishing gear in the water, so we have to be on alert for that at all times. We don’t want our instruments to get tangled up in the long lines fishermen leave in the water hoping for a catch to come along. One day, the ship did run into some long lines and had to stop and make sure it wasn’t in the propellers. Another very cool instrument we’ve been deploying are ARGO drifter floats http://argo.whoi.edu/argo.whoi_about.html – Think of a scientific instrument that will measure temperature, conductivity (salinity) and depth and that can be programmed to move around at different depths, GPS keeping track of its location for several months or even years. They have computer processors in them and a little motor that “drives” it deeper or shallower as the need for data at certain coordinates dictates. Here is a diagram of the ARGO drifters we have been launching. http://argo.whoi.edu/argo.whoi_components.html
As the data from last year’s Stratus 11 deployment is analyzed, plus the hourly data from our UCTD profiles, several trends have become evident. I have also been able to get a look inside some of the instruments. Can you imagine sending a tablet computer hundreds of meters into the ocean? That is exactly what has been done. In the photo, you can see an example of an instrument that measured ocean currents for a year at great depth and pressure.
Sean Whelan downloads the data from instruments and then prepares the instruments to be shipped back to Woods Hole.Collecting data from a current meter using the touch screen and stylus, this instrument has withstood a year of underwater conditions on a card like you keep in a digital camera.
There is also redundancy of instruments (more than one) in case one fails or the battery dies, which sometimes does happen. Regarding the trends – the science team has anticipated this, having seen it similarly each year, these are their hypotheses as the Stratus experiment continues. As we near the equator, the salinity is rising – there is more evaporation when the sun is more direct. As some of the ocean water becomes humidity in the atmosphere, the salt is left behind in the ocean, as salt does not change to a vapor in our atmosphere – it is left dissolved in the ocean and thus increases the ocean’s salinity. A “big” increase in salinity would be 1 part per thousand in a small area, for example, so we are tracking the trend of small changes. In the hourly UCDT deployments we have been conducting, we have measured between 34.08 and 37.7 parts per thousand.
Bob Weller and Sebastien Bigorre check the monitors for the status of the multi beam sonar display.
Oxygen content is important for all life as well as for many practical applications. The absence of oxygen (or lower amounts) allows other chemical reactions to take place in the water. The formation of certain acids becomes possible, which is deadly for some organisms, and favorable for others. An example we saw of this was a piece of hardware that was on the mooring cable had a very low oxygen levels, had sulfuric corrosion on it.
Another measure important to scientists is fluorescence which detects the amount of phytoplankton in the ocean – small organisms at the base of the ocean food web which use the CO2 to reproduce.
Society has great dependence on the ocean to absorb the right amount of carbon dioxide in the atmosphere, but at a certain point, the ocean chemistry will change and affect this balance of life. Climate prediction allows us to keep the pulse of the stability of this balance and all of this data we have gathered is part of the scientific puzzle of climate prediction.
NOAA Teacher at Sea Sue Oltman Aboard R/V Melville May 22 – June 6, 2012
Mission: STRATUS Mooring Maintenance Geographical Area: Southeastern Pacific Ocean, off the coast of Chile and Ecuador Date: May 30, 2012
Weather Data from the Bridge: Air temperature: 21.4 C / 65 F
Humidity: 77.6%
Precipitation: 0
Barometric pressure: 1015.1 mB
Wind speed: 15.8 kt SE
Sea temperature: 22.42 C
Location: 19.55 S, 85.2 W
The Trade Winds are now constant, helping us along to our destination!
Personal Log
An interview with the Captain, Dave Murline
SO: How long have you been a ship captain?
DM: Since 1994. Since then there has been an increase in paperwork, regulations and inspections due to a world-wide push to make going to sea safer.
SO: What kinds of skills are necessary?
DM: You need a well rounded background in Seamanship, good people skills and the habit of treating everyone with respect.
SO: Does being on a science research ship bring any specific/different expectations than being on another type of merchant ship?
DM: Yes, on a research vessel, you are dealing with scientists and their instruments as opposed to general cargo. Every voyage is different and brings on its own set of new challenges. Scientists tend to work outside of the norm so there are always new ways to figure out how to use the ship in the best way that we support the mission. This is a job that always keeps me thinking and using my imagination!
SO: We are in the middle of a huge ocean, and our destination – a buoy – is like a pinpoint on a map. What has to be considered to make sure you get to the exact location?
DM: We need to consider weather, currents and also vessel traffic around the area. Some hazards to navigation are reefs (shallow), islands, clearances to foreign countries EEZ (Exclusive Economic Zone within 200 Miles of any country), and pirates. Once I encountered pirates on the Arabian sea, but on a ship like this, were able to out maneuver them. We have not gone back there!
I’m on deck with Captain Dave Murline who is cooking up some freshly caught yellowtail. If you like to fish, a side benefit is when you get to enjoy your hobby!
SO: Have you ever gotten lost?
DM: I’ve never been lost at sea, but get lost sometimes driving around in my hometown!
SO: Can you name a really interesting research cruise you have been on?
DM: Every voyage is unique and interesting. I’m always looking forward to the next mission and challenge. Our work varies from studying the atmosphere sea interaction to marine mammals. There is so much to learn about our oceans, it is all very fascinating.
SO: What is something most people don’t know about your job?
DM: There is tons of paperwork with my job! That is what I consider the “work” part. Also, along with many other responsibilities, I am the ship’s medic which can be a “scary” part of the job as we are often working far away from any medical facilities. That is why “Safety” is our number one priority on any cruise.
SO: Thanks for letting us get the inside scoop on being the Captain of the R/V Melville!
There are so many interesting people on the ship with a variety of skills. We eat all meals together and many of the crew support the science team in different ways. They are from many areas of the country and it has been great to get to know them!
My work out routine has become more varied – Unfortunately, the noise with mineral spirits/paint odors are a package deal along with the stairmaster in the machine shop, so I found another way to get some exercise in after noticing what some of the crew did. I spent about an hour doing many laps around the ship, up and down all the stairs of the outdoor decks, with the beautiful ocean all around me. For entertainment, I not only had my iPod, but for added visual interest, all kinds of valves, winches, life preservers, hoses, and the occasional engineer fixing something. A good line from my music today – I sing my heart out to the infinite sea! (The Who)
There is a little store on the ship that has been locked up tight. All of the guests on the ship are anticipating the sale in the ship store tomorrow! There are t-shirts, hats, and other items as Melville souvenirs.
Science and Technology Log
A successful but slimy recovery!
The Stratus 11 Buoy was successfully recovered in a process that began before breakfast and lasted into the evening. Remember the thousands of meters of cable?
First, a computer command triggered the acoustic release of the anchor. There is not a way to safely recover this anchor, so it is left on the ocean floor. Once released, the bottom of the cable, with all 80 plus of the glass balls for flotation, gradually make their way to the surface. So when we came out after breakfast, the yellow encased glass balls were all bobbing on the ocean’s surface. A few folks had to go out in the life boat so the chain could be attached to the ship’s crane, then we started reeling them in. A beautiful rainbow was in the sky like a special treat for us!
Sean, Eugene and Rob hold onto the deepest part of the cable which has surfaced, thanks to the glass balls encased in yellow cases.
Sometimes one or more will implode due to the massive pressure, and this time, only two did. Little by little, as the cable was wound onto the winch, the instruments started coming in. The deepest ones come in first and the shallowest ones last, opposite from deployment. They were cataloged and cleaned and if all is well, will be used next year on Stratus 13. It is amazing how all of these sensitive tools can last for a year under such conditions! The battery left with the buoy is good for up to 14 months. Sometimes, there would be fishing line entangled with the tools, as there is some good fishing in this area. As we started to get to the more shallow instruments – and by this I mean 150 meters or so – we started seeing that organisms had started taking up residence on them! This is called a fouling community. There are slimy growth algae and these little shells with a neck called gooseneck barnacles, sometimes with a crab in the shell. The closer to the surface we got, the population of these barnacles just kept increasing and increasing! There were quite a few instruments that were so covered in the barnacles; you could not even identify it!
Nan’s organizational skills help the team know which instrument provided what data to maintain the integrity of the research.Wearing a coating of fouling organisms, the Stratus 11 buoy looks nothing like the one we deployed 2 days ago! This is typical after a year in the ocean.Sean snags the Stratus 11 buoy to bring it in to the Melville. Photo: Rob BallStratus 11 has been successfully recovered, barnacles and all! The crane carefully hoists it onto the aft deck. Photo: Rob Ball
As we recovered more instruments, we were drawn closer to the old buoy, which had acted as an artificial reef for the past year. Whales sometimes like this, so once again, we spotted our cetacean friends! Once the last instrument was on deck, it was time to recover the actual buoy. Like earlier in the day, we needed a few folks out in the boat to help make sure the buoy stayed with the ship and did not float away, as we had released it from the crane. It took longer than expected, but it was finally on board and it, too, had its own fouling community.
All hands were needed to help clean the instruments. At first, it was a novelty to see a cute little crab crawl out of a colorful barnacle shell, but then all of us became quite ruthless, ripping and scraping them off of the tools with no regard for the destruction of their little ecosystem. We had quite a pile to get through and had no time for this – what was at first cute was not only annoying, but downright nasty!
Cleaning the shallow instruments was the messiest of all! Jamie from NOAA and I tackle a couple of more instruments, with a plethora of barnacles at our feet.
Some folks’ clothes were so disgusting, so caked with grime and detritus of the sea that it was decided to sacrifice them to the great Pacific instead of potentially fouling the ship’s washing machine. With all of the great attitudes and camaraderie, it wasn’t too bad to be doing this clean up together as a team. All felt a great satisfaction at seeing two facets of the mooring project – the deployment a couple of days earlier and now a successful recovery with no injuries or loss of instruments. A good nights rest was in order!
Sebastien, Pamela, Elsie, me, Eric and Jamie have a moment of fun on a long day of hard work. A terrific group to cruise with! Photo: Ursula Cifuentes
You saw it here first… The EM122 Multi Beam sonar mapped out some brand new ocean floor for future research and deployment. The newly mapped area is seen on the screen – and in a year or so, will be added to the mapping database on Google Earth. So, before this part of the ocean floor makes its mapping debut to the world, you get an insider’s sneak preview here!
Sneak peek! A brand new map of a section of ocean floor, using the EM 122 Sonar and the “mowing the lawn” technique
NOAA Teacher at Sea Sue Oltman Aboard R/V Melville May 22 – June 6, 2012
Mission: STRATUS Mooring Maintenance Geographical Area: Southeastern Pacific Ocean, off the coast of Chile and Ecuador Date: May 27, 2012
Weather Data from the Bridge: Air temperature: 21 C / 64.9 F
Humidity: 84.1%
Precipitation: 0
Barometric pressure: 1014.5 mB
Wind speed: 11 kt SE
Sea temperature: 21.75 C
Science and technology Log
I’m seeing for real that being a research scientist can be really exciting and hands-on when working out in the field. In our routine of launching UCTDs every hour while steaming towards our target, more acquisition of ocean data takes place in other ways. At certain coordinates, WHOI deploys drifter buoys that monitor ocean characteristics as they drift with the current. The data can be followed on line not only by the scientists, but by the public! Two were launched this morning on our watch at coordinates 21º S, 84º W. And one of them is Kittredge’s adopted buoy! It is serial number 101878. As you can see in the video clip and photo below, I’ve made sure a little bit of Kittredge Magnet school is left here in the Peru Basin of the Pacific Ocean, where it is about 4,400 m in depth.
It’s time to launch the drifters! All the fish that see this will know about our school!
KMS went swimming in another way, too – my KMS hat flew off my head while working on the aft deck. (Sorry, Mrs. Lange!) Science Rocks in the South Pacific!
The team did a second CTD deployment – this one to the bottom, about 4,500 m. This is precise work, to analyze maps and bathymetric data to be accurate to find the depth at which it is desired to anchor the Stratus 12 buoy. Keith, Jamie and I were “spotters” with the rosette as the crane lowered it down. Pamela, who is studying phytoplankton, retrieved samples of water with organisms from this deployment. However, due to customs in Ecuador, it is tricky for her to get her samples back to Chile. Ecuador does not allow anything into the islands that may potentially contain anything living thing, even a sealed sample of water containing plankton. So the samples will continue with the ship to San Diego and then be shipped to her in Chile.
We made it to the old buoy! It was exciting to see Stratus 11 come into view. The bottom area was surveyed in great detail within a few miles of the Stratus 11 to confirm Seb’s chosen spot for Stratus 12.
Dr. Bob Weller and Jeff Lord have a pre-deployment meeting with the captain and some key crew members who will be assisting.
The next day, the deployment of the new mooring, Stratus 12, is a full day of coordinated teamwork – about 4,500 m of cable with 2,000 m of instruments. The first 50 meters at the surface has 20 instruments! It took over 8 hours to put the buoy and all attached instruments in the water, and that is after hours of assembly on the aft deck. One new instrument added was at the deepest part of the ocean in this area and will provide data on deep ocean temperatures and salinity, something currently missing from climate models.
We enjoyed perfect ocean and weather conditions on the day of the launch! The Stratus 12 buoy is in the background behind me.After the last instrument is placed on the mooring line, its anchor is sent down. At 10,000 lbs., the anchor drop makes a really big splash!All hands are on deck to contribute to the mooring assembly and launch.
The all night watches are not over, though – we must continue to collect bathymetric data to map the ocean floor around here. Only about 5% of the ocean floor is actually mapped, and when the team returns next year, they may not be on the same ship. Not all ships have the same sophisticated multi beam sonar as the Melville. Those on watch are actually watching the sonar monitor display as the ship engages in the “mowing the lawn” technique to create a detailed map. The Melville will “hang around” in this area for a couple of days before we remove Stratus 11 from the water. This allows time for data to be transitioned from one buoy to the new one. I am told recovering the buoy is going to be some dirty, grimy work!
Why here, anyway?
The area off the coast of Pacific off Northern Chile and Peru has been historically difficult for climatologists /meteorologists to model. To predict climate, varying parameters of atmospheric conditions are fed into a computer to simulate what the outcome will be. The predictions made are then compared to actual conditions to determine the reliability of the computer model. Meteorologists have not been able to accurately predict this region: the actual ocean conditions are much cooler than the computer predicts.
Another finding showing the importance of this area is that when the type, thickness, and altitude of clouds in the Northern Chile /Peru basin are changed for simulations, almost the whole Pacific Ocean’s heat distribution is in turn affected! Satellites gather data remotely, but the constant stratus clouds block satellite data transmission, so it is just not reliable. Data must be collected right here. Given that oceans cover 71% of the planet, and the Pacific is the largest, fully understanding this region is critical to building accurate climate models. Therefore, the Stratus research brings us to 20º S 85º W.
Personal Log
Animal life has been spotted! On two days, we saw whales! One – perhaps a Blue Whale – was far away and just its fluke was seen. The next day we had two whales swimming close to the ship, and we were able to watch them and hear them breathe for a while. According to the crew, seeing whales in this area is rare. It’s odd to be in a body of water teeming with life and see so little of it. We also encountered only one boat, a Spanish fishing vessel.
Bob and Mark continue to feed us well. The food storage area is below the main deck and they use a dumbwaiter to bring the food up to the kitchen where it is prepared and served. There is food from all over the world; the ship was in South Africa before reaching South America. All of the meat is from South Africa and also some of the coffee. One night, we had some kudu meat – like steak, but from antelope. It was very good, and tasted like bison. Every country’s Customs sends agents to inspect the food service area while in port. The U.S. Customs is very strict and will not allow foreign food into port, so maybe that is why they are feeding us so much!
The cooks work at least 10 hour days. Bob has been a cook for 21 years and his favorite part of his job is getting to travel. Mark, our other cook, has been in this job for 10 years. Both of them work for Scripps, as it operates the boat.
Here’s how much we have been eating daily – 7 dozen eggs, 5 heads of lettuce, 5 gallons of milk, and there are NEVER any leftovers! The kitchen always keeps some of the meals for the “midnight rations” so those who sleep in the daytime and work on the night shift from midnight to 8a.m. do not miss out on any of the good fixins.
Finally, I am used to the noise and can sleep pretty well. It’s like I am in a room with power tools being used, even with ear plugs, you can hear the engines. Everyone here is in the same boat, though (pun intended!). Our next exciting task is ahead, recovering and cleaning up the Stratus 11 buoy.
NOAA Teacher at Sea
John Schneider
Onboard NOAA Ship Fairweather July 7 – August 8, 2009
Juvenile bald eagle preening
Mission: Hydrographic Survey Geographical Area: Kodiak, AK to Dutch Harbor, AK Date: July 21-26, 2009
Position
In port, Dutch Harbor, AK
Personal Log
The days we spent in Dutch Harbor were a combination of 8-hour work days and evenings spent in town at either the Harbor View Sports Bar and Grill or the Grand Aleutian Hotel. The crew and survey techs put in full days, then go out for a couple of hours using the liberty van. Everyone’s usually back aboard by midnight or so (the van stops running at 2300, but the town’s only about a 20 minute walk.) In Dutch and Unalaska, there are houses of worship, museums, a Safeway, a clinic (which I got to visit / after stepping on a nail), a community indoor pool and a post office. There are also a couple of ship supply places that have excellent quality gear at a minimum markup considering how far away we are.
For me, there were four events that were particularly of note. First, before now I had only ever seen one bald eagle in the lower 48 and a half dozen or so in Kodiak. In Dutch, they are all over. These birds get to be about 3 feet tall and the talons on the juvenile pictured are about an inch long! I took well nigh 100 pictures and had trouble selecting which ones to include. They are stunning animals.
Second, I knew that Dutch Harbor had been bombed by the Japanese in WWII as part of the diversionary action prior to the Battle of Midway. What I never realized was WHY they would bomb a remote, nothing, minor outpost and attack and occupy Attu and Kiska farther out in the Aleutians. The answer lies in spheroid geometry! (OK all you math phobes, this is a cool one that’s not too hard to grasp.) Simply put, the shortest distance between any two points on a sphere (the Earth) is the distance along the surface created by a plane created by three points: the two points in question and the center of the sphere. In other words, it cuts the planet in half! (The red line in the illustration.)
Great circle route from Tokyo to SeattleSpheroid geometry (diagram courtesy USNA)
On the diagram above, the red line is the great circle route from Tokyo to Seattle. As you can see it passes right through the Aleutians. The battle in the Aleutians is sometimes referred to as the “Thousand Mile War” and is largely unknown, However, the Aleutian Islands are the “back door” to attacking North America. That’s why, after the bombing of Dutch Harbor six months after Pearl Harbor, the United States made a concerted effort to fortify the Aleutians and take back Attu and Kiska. By the way, the landings on Attu and Kiska were the first landings on American soil by an enemy since the War of 1812! There are reinforced concrete bunkers and Quonset huts all over the Dutch Harbor area and the fortifications atop Mount Ballyhoo are among the most well-preserved and extensively built in the United States. The fact that our military – both men and women – were stationed in such an inhospitable frontier should be taught to all of our students.
Quonset hut on Mt Ballyhoo
Personally, I am thankful to one of my professors, Jack Lutz, who was stationed on Adak, 350+ miles West of Dutch Harbor. Freedom isn’t free and we are very lucky. So, this information about great circles should lend a bit of insight to the questions I posed earlier about the D.E.W. Line (used for radar protection in the event of Soviet missile launch over the North Pole) and why we encountered ships sailing from North America to Asia while passing through Unimak Pass (It’s right in the middle of the great circle route!)
Gun emplacement overlooking the entrance to Dutch Harbor
On our last day in Dutch, the CO and 5 others including myself went to the old cemetery in Unalaska. Buried there is Karl Mueller of the U.S. Ship Surveyor. He was one of the earliest Americans to work on surveying the Aleutians and was drowned in 1938 when his survey launch hit a previously uncharted reef. For more information on the NOAA personnel lost in the line of duty, go here. It’s important that we know our history in order to appreciate our present and look forward to the future.
Grave marker of Karl Mueller. The Fairweather crew maintains the grave and established a benchmark on the marker.
The last notable event in Dutch was the combined “wetting down” and Sunday Brunch for the new officers. As I pointed out on one of my first logs, CO Doug Baird was promoted to Captain and Mark Andrews was promoted to Lieutenant JG. LTjg Andrews generously invited me to the wetdown and brunch which was attended by the entire crew. The wetdown was at the Grand Aleutian on Saturday night and Sunday brunch was there also. These two events were really something special and the camaraderie was great to experience. Thank you, sirs.
Crab legs, lox, salmon, biscuits w/ crab gravy, kippers (Plate #2 with dessert yet to come!)
NOAA Teacher at Sea
John Schneider
Onboard NOAA Ship Fairweather July 7 – August 8, 2009
Mission: Hydrographic Survey Geographical Area: Kodiak, AK to Dutch Harbor, AK Date: July 18-20, 2009
Position
Shumagin Islands, in transit to Dutch Harbor
Weather Data from the Bridge
Weather System:
(July 18th) Low system approaching from the South
(July 19th) Fog, gusty wind in the morning, clear afternoon, but getting windier; Wind: southwesterly at 4-6 kts; Sea State: 1-2 feet
Weather System: Projected for the July 20-21 overnight
Barometer: falling rapidly (a warning sign of unsettled weather) Wind: sustained at 30-40 kts, gusting to 55 kts (This would qualify as a “gale”)
Sea State: Predicted wave height next 24-36 hrs – 18 feet!
Andy and lunch—a nice halibut!
Science and Technology Log
On the 18th and 19th, the launches went out (including me on the 19th) to clean up some holidays and get more near-shore data. When we got back on the 19th, we found out that a major low pressure system was building to the south and expected to be in our area within a day and a half. A major low system can reach out a couple of hundred miles and the CO decided that we would leave the Shumagins about 18 hours earlier than originally planned. I discussed this with him (he is remarkably approachable) and he reiterates to me what I had already believed: his responsibilities are in three priorities – 1. His crew. 2. His ship. 3. The mission. Our research in the Shumagins does not represent life-or-death, it represents the continuing quest for knowledge and the expansion of our understanding of the Earth. I’m sure you’ve realized it already, but Captain Baird and his officers have earned my highest regard.
We are in the center of the radar screen and two other ships described below – with their courses projected from the boxes that represent them – are behind us. The green line is our track ahead.
On board the Fairweather is a phenomenal array of electronics. Our positioning equipment is able to determine our position with just a couple of meters and when we are on a course it can tell if the course error is as little as a decimeter! Operating in Alaska, where fog is a way of life, RADAR (Radio Direction And Ranging) is an absolute must, and we have redundant systems in the event one breaks down. Probably the coolest thing about the radar is the use of ARPA technology. ARPA (Automated Radar Plotting Aid) is a system that not only identifies other vessels on the water, but diagrams their projected course and speed vectors on the screen. It does this from as far as 64 miles away!
The tail of the halibut and some crabs found in its stomach
By looking at the screen, you can see the lines of other ships relative to your own and navigate accordingly. Furthermore, the system includes ECDIS, which is an Electronic Chart Display and Information System that identifies other ships as to their name, size, destination, and cargo! So when you see on the radar that you are in a situation where you will be passing near to another vessel, you can call them on the radio by name! This technology is essential, especially going through Unimak Pass. Unimak Pass is about 15 miles wide and is a critical point in commercial shipping traffic between the Americas and Asia. As we were transiting Unimak Pass, We were passed by an 800 foot long container ship that was en route to Yokohama, Japan and going the other way was a 750 foot ship going to Panama. This is a critical area due to what is called “Great Circle” navigation. I’ll address this point when in Dutch Harbor next week.
Eat your hearts out!
Personal Log
Last night, after the beach party, Andy Medina (who has been on board for almost 200 days this year) was fishing off the fantail and caught a nice halibut. The crew who hail from Alaska all have fishing permits and when the day is done, if we’re anchored they get to use their free time for fishing. They even got a freezer to keep their filets in. Earlier in the cruise, we actually had halibut tacos made with about the freshest Alaskan halibut you can find (less than 12 hours from catch to lunch!) Of course, with me being a bio guy, I asked for two things: 1 – to keep and freeze the head (I For the last night of the leg before making port in Dutch Harbor (home of the World’s Deadliest Catch boats) the stewards, Cathy Brandts, Joe Lefstein and Mike Smith really outdid themselves. I sure hope you can read the menu board, but if you can’t, dinner was Grilled NY Strip Steak and Steamed Crab legs with Butter!
We went through about 10 trays like this!!!
After dinner, everybody secured as much equipment as possible in the labs, galley and cabins as possible in anticipation of the run ahead of the weather into Dutch Harbor. We ran through the night and got to Unimak pass in the middle of the day on the 20th. About half way through the pass was an unusual announcement, “Attention on the Fairweather, there are a lot of whales feeding off to starboard!” It’s the only time whales were announced and it was worth the announcement. For about 2 to 3 miles, we were surrounded by literally MILLIONS of seabirds and a score or more of whales. Comments from everybody were that they had never seen anything like it. I kept thinking of the old Hitchcock film The Birds and the scenes in Moby Dick where Ahab says to “watch the birds.” We were all agog at the sight.
Fifteen minutes of this! Incredible!
With the collective 200-300 years of at-sea experience, no one had ever seen anything like it. After 2.5 weeks that seems like 2.5 days, we approach Dutch Harbor and are secured to the pier by 1700 hours. Tonight we’ll head into town, but if not for the news in the next paragraph, this would be the worst time of the trip, however . . .
The Best news of the trip: I’ve requested and been approved to stay on board the Fairweather for the next leg! WOO-HOO!!! It’s called FISHPAC and deals with integrating bottom characteristics to commercially viable fish populations! I’m going to the Bering Sea!!!
Questions for You to Investigate
When did the Andrea Doria and Stockholm collide? Where? In what conditions?
What was the D.E.W. Line in the Cold War?
Why did the Japanese want bases in the Aleutians in WWII?
Why did we pass a ship going from North America to Yokohama well over 1000 miles north of both ends of the trip?
What are Great Circles?
Did You Know?
That almost 10% of all commercial fishing catch in the United States comes through Unalaska and Dutch Harbor?
NOAA Teacher at Sea
John Schneider
Onboard NOAA Ship Fairweather July 7 – August 8, 2009
Mission: Hydrographic Survey Geographical Area: Kodiak, AK to Dutch Harbor, AK Date: July 16-17, 2009
Position
Shumagin Islands
Morning safety briefing
Weather Data from the Bridge
Weather System: Light fog, clearing through the day
Wind: light and variable
Sea State: <2 feet
Science and Technology Log
This morning, I went up to the boat deck and took a shot of the FOO in the morning safety briefing on the fantail. Afterwards, while the launches were conducting near-shore and off-shore surveys, the Fairweather ran cross track lines where we had completed a large open-water polygon. Once the large offshore polygons are surveyed by the Fairweather, the ship runs several transects at a 90º angle across the original survey lines. This is to corroborate prior data. When the survey crew finally completes their data analysis, they have checked and re-checked the data a minimum of 4 times before the report leaves the ship. Then, the information goes to NOAA’s charting offices and is reviewed multiple times again before being incorporated and published on charts and in the Coast Pilots.
Personal Log
Perhaps the three most frightening prospects on board a ship at sea are:
Fire
Abandoning a sinking vessel
Man Overboard
Going up the ladder blindfolded
This afternoon, we ran drills addressing the first two situations. In the first drill, we simulated a shipboard fire with thick smoke. Rather than filling the ship with smoke, the crew paired up and practiced escaping from their cabins blindfolded. Each person took a turn being the eyes so their partner didn’t get injured, but could not give directions. My path was relatively easy: Left out of my cabin, right along the wall, up the ladder, right to the next wall, right again, pass the door to the scullery, go over a coaming and left out to the weather deck. I did fine, and my partner, Engineer Joe Kelly, also did. On the other hand, Andrew Clos, one of the survey techs, made one wrong turn and wandered into the mess. Once he got there, well, on board ship folks tend to enjoy a good laugh – either at their own expense or someone else’s. Once Andrew got into the mess, other crew members put chairs in his way, opened cabinet doors, blocked the ability for him to go backwards!
Andrew cornered in the mess!
Oh, they were merciless! Finally, someone led him out and we all shared a good laugh. The XO was, however, quick to point out that Andrew had crawled during the drill – one of the few who had done so. Remember what they teach even in pre-school, if there’s smoke, the smoke rises, so crawl to safety. So I guess the point was well-made. The abandon ship drill is very simple in concept, but with 45-50 people hustling through passageways with life jackets and Gumby suits (not wearing them, but just carrying them) it can be chaotic. Nonetheless, within less than 4 minutes, every crew member was at their abandon ship stations.
“Ensign Forney” at his station in Plot
The best aspect of the drills was the seriousness of the personnel. We all realize, even the crewmen who have been to sea for decades, that life on the sea is held by a thin thread and frivolity belongs in its place. While the launches were operating, Survey Tech Tami Beduhn (with help!) put a chicken suit on the CPR mannequin that we have on board and set it up in Ensign Matt Forney’s station in the plot room. They even put his ball cap on it!
Ensign Matt Forney (left) and the CO at the bonfire.
Speaking of Frivolity
Being more than halfway through the leg and getting work done at a really good pace – through crew efforts and cooperation from the weather – the CO (currently Jim Bush who has relieved CAPT Baird while he is on leave for a short while) approved a “beach party” to be held on one of the accessible beaches (Flying Eagle Harbor – 55º10’ N, 159º30’W) of Big Koniuji Island, the second largest island in the Shumagins. The ship arrived in the “harbor” a few hours before the launches returned and anchored. While the launches were conducting survey ops, the stewards (chefs) and the deck crew repeatedly took the skiff (a small utility boat) and set up a HUGE meal on the beach. As you can see, the bonfire was ready to go – collected from the ample supply of driftwood. We even had a Beachparty Internal Temperance Control Honcho – kind of a 2009 version of Women’s Christian Temperance Union of the late 1800’s! After a while on the ship, it was cool to get ashore. A couple of the crew hiked to the summit of the mountain.
Vocabulary
Scullery – the area of the galley (kitchen) where used dishes are rinsed and put into the dishwasher
Coaming – a raised door sill at a hatch to keep water from flowing inside
The ship waiting offshoreIt doesn’t get any better than this!Yup! We went swimming! That’s me with my arms up. Water was about 43º.
NOAA Teacher at Sea
John Schneider
Onboard NOAA Ship Fairweather July 7 – August 8, 2009
Mission: Hydrographic Survey Geographical Area: Kodiak, AK to Dutch Harbor, AK Date: July 15, 2009
This is the Fairweather’s foredeck.
Weather Data from the Bridge
Weather System: early fog burned off by mid-day
Wind: light & variable
Temperature: 11.5º C
Sea State: light swells
Science and Technology Log
There’s a whole bunch of ship-specific jargon that marine researchers need to be conversant in for clear communication with the officers and crew. A couple days ago I mentioned bow and stern lines and frapping lines and boat falls. Now for aprimer in basic terminology. The bow is the front of the ship. To get there you go forward. (The bow is a place; forward is a direction.) Similarly, you go aft (direction) to get to the stern (place). By the way, the weather deck at the stern is the fantail which is where a lot of work gets done. Descending into the ship you are going “belowdecks” and to get there you go up or down a ladder (not stairs.) Windows are portlights, which are covered with thick black covering at night so as to not shine light off the ship and cause visual problems for the bridge.
The right side is starboard, the left is port. (Easy to remember, left and port both have four letters, starboard and right are longer.) The ship has running lights which on the Fairweather are on all the times. Starboard is green, port is red (again, the longer words go to starboard.) Ropes aren’t ropes, they’re “lines.”
Personal Log
This evening was a spectacle far beyond what I had hoped for, so most of today’s log will be pictures. I think they’ll be self-explanatory! Let me just preface these pictures with a quote from Chef Joe Lefstein. He and I were chatting on the fantail after dinner and there had been some reports of whales nearby. I told him I was getting my camera and he said, “That’s the kiss of death. There won’t be any whales now.” Welllllll . . .
Birds and a spout!Birds and TWO spouts!!!Two whales with their dorsal fins showingA fluke that can identify a whale!
This shot below is going to be sent to the people at the Ted Stevens Marine Research Institute Juneau Humpback Whale Catalog (part of the Alaska Fisheries Science Center in Juneau. Survey tech Will Sautter told me about their site and I think this is a new sighting! I can’t wait to hear from them! Their URL is at the end of today’s page.
Then I got these shots, which shows a whale breaching (jumping out of) the water.
So Joe and I are just blown away by all this (it went on for a good 15 minutes and I took about 75 pictures) and he says, “Can you imagine if we see a breach? I’ve been sailing here for six years and have only seen one.” I turn around to look forward and he yells, “Oh my God, two of them just breached together.” I turned and snapped the following, just catching their splash, and we were treated to another show for another 10 minutes!
Am I lucky or what?! One even waved B’Bye!
Questions for You to Investigate
How do scientists identify individual humpback whales?
How long can humpbacks stay under water?
How many teeth do humpbacks have?
What is the preferred food of a humpback?
Check out this site below and see if you can recognize “my” flukes?
See what you can identify in the picture of the deck at the top: Red wheels (windlass controls), Fire Station, 2 cranes, 8 vents from lower compartments, the boarding ramp, and 3 pairs of bitts.
NOAA Teacher at Sea
John Schneider
Onboard NOAA Ship Fairweather July 7 – August 8, 2009
Mission: Hydrographic Survey Geographical Area: Kodiak, AK to Dutch Harbor, AK Date: July 14, 2009
Position
Shumagin Islands
Here I am in the data acquisition chair.
Weather Data from the Bridge
Weather System: light overcast
Wind: light & variable
Sea State: gentle swells
Science and Technology Log
Today I spent quite a few hours in the plot room learning about the methods being used on Fairweather for recording bathymetric data. In the picture below and to the right you are looking forward at the starboard side of the Plot Room. From the left are Chief Survey Tech Lynn Morgan, Survey Tech Dave Franksen, survey crew members Damian Manda and Gabriel Schmidbauer. Dave is in the chair that I’m occupying in the shot above.
At first, it’s a baffling array of monitors and programs and people. There are 11 stations for survey personnel in the plot room and it is operating 24/7 when we are under way. In the adjacent compartment are the FOO (Field Operations Officer) and the CST (Chief Survey Technician.) The FOO on the Fairweather is LT Matt Ringel. The future FOO is LT Briana Welton (who will become the FOO when LT Ringel rotates off the ship); and the CST is Lynn Morgan. While the crewis quite casual in addressing one another, there are three individuals who are addressed by their titles. Commanding Officer Doug Baird is addressed as “CO,” Executive Officer David Zezula is “XO,” and LT Ringel is “FOO.” Everyone else on board is addressed by casual names. These three officers and the CST are integral to getting our mission accomplished.
More data acquisition!
I’ll address the monitors I’m viewing from top to bottom and left to right. Once you’ve sat in the chair it’s not terribly difficult to follow what’s being displayed . . . but a novice like me isn’t able to decode issues that pop up sometimes. Though I sat a 4hour watch, for the vast majority of that time I had an experienced tech (Will Sauter) very close to help when it was needed. The top right monitor is a closed-circuit TV monitor of the ship’s fantail1 (aft deck.) This is where the remote MVP is deployed from (The MVP is the ship’s equivalent of the CTDs2 we deploy from the launches.) It’s on the starboard quarter and is deployed with a couple of mouse clicks from the chair. Its mouse is the white one to the right and its keyboard is the white one.
The data acquisition monitors
To the left of the closed-circuit TV monitor is the control screen for the MVP. It indicates how deep the “fish” (the sensor) is, the tension on the line, how far behind the ship it is, the GPS accuracy, who is capturing data on the watch and about 20 other parameters. Whenever something is going that involves the ship or its operations, the bridge must be apprised so the Officer of the Watch is on the same page as the survey and boat teams. You key the intercom to the bridge and say something like, “Bridge, we’d like a cast, please.” And they will respond “yes,” “OK,” “affirmative” or something along those lines. Then we follow with “fish is deployed,” “fish on the bottom” and “fish is back.” The MVP gets a sound-velocity-in-water throughout the water column. It can vary by as much as 10 m/s which affects the recorded distance.
The graphic display of the Multi-Beam Echo Sounder called the beam “cone”
The far monitor you see below is a graphic display of the beam-spread from the 8111 Multi-Beam Echo Sounder. The sounder can cover an angle of 150º (which is 75º to either side of the Nadir3.) Ideally, this line should show blue dots across from one point of the cone to the other. As you can see, the left side is a bit higher than the right. This could indicate either that the ship is rolling or the bottom is sloped. The control for adjusting the beam is the left roller ball in the top picture. (The right one is for a different MBES.) The next 3 displays are all controlled with the black keyboard and mouse on the lower shelf in my lap. The left monitor of these three displays technical data about the ship and MBES. One of the devices integrated into the system is an Inertial Motion Sensor which quantifies the amount of roll4, pitch5 and yaw6.
This screen depicts various graphic displays
Having this information allows the raw data to be corrected for some environmental factors. Also in the display are accuracy and precision indicators for the GPS positions, personnel on watch, logging verification to begin and cease, and more. The next display is broken into four subordinate windows. On the top left and center are visuals on the nadir beams directly under the ship. It seemed a bit odd not to simply include the nadir in the bottom half of the display, but the bottom half is processed a bit differently and needs to be segregated. One of the Officers (ENS Patricia Raymond) actually got a screen capture of what appear to be whales directly below the ship. I swear you can identify flukes and fins, but maybe that’s just wishful thinking on my part. I’d have included it here, but there’s just the one copy in plot. The top right in this display shows a minimized version of the path we’re “mowing.” You can see the most recent data in green. Finally, on the bottom, are the side-scan views of the bottom. In this particular shot it’s kind of interesting with what appear to be the remains of glacial moraines and scour on the seafloor.
This display shows technical data about the ship and Multi-Beam Echo Sounder.
The last screen, on the far right, is the screen showing our progress on the polygon. The recently scanned area shows up in a different color than those previously scanned and every time you update the plot, the colors begin anew. Fairweather frequently uses about a 50% overlap to ensure redundancy of data points. On the lower right side of this screen is a graphic of the beams under the ship. It usually looks very much like the image of the “cone” displayed above. The “70.55” indicates the depth (in S.I. Units of meters) and the top right indicates the status of whether we are logging/retaining the data or if it is just reading it. We don’t log when the ship is turning because the data points get too spread out on the outside of the turn.
This screen shows the ship’s progress on the polygon.
Personal Log
At first glance, it seems that mastering all of this would be daunting, but the ease and confidence that are displayed by the team show that it can be done. Again, the Professional Learning Community idea comes into play as they collectively debug issues and plan for future advancements in the technology even as they are using what is current. Listening to the technical banter and seeing how that much brainpower is focused on a task is really cool. Having spent most of the day in plot, it was real nice to spend the (endless) evening just watching the ocean around me. When the sun sets at 2315 (11:15 pm) it’s cool. When it sets at 2313 behind a mountain island off the coast of Alaska it’s unbelievable!
Questions for You to Investigate
How are your inner ears similar to the Inertial Motion detector?
How are your semicircular canals contributors to seasickness?
New Terms/Phrases
Fantail – The aft deck on the ship. It’s where the majority of overboard work is done
CTD’s – Conductivity/Temperature and Depth sensors
Nadir – The beam that runs the shortest distance to the bottom
Roll – the left/right rocking of the ship
Pitch – the front/back rocking of the ship
Yaw – the swinging of the ship to either side of its course (picture a wagging tail)
NOAA Teacher at Sea
John Schneider
Onboard NOAA Ship Fairweather July 7 – August 8, 2009
Mission: Hydrographic Survey Geographical Area: Kodiak, AK to Dutch Harbor, AK Date: July 11, 2009
Position
Sheet L – Shumagin Islands
Weather Data from the Bridge
Weather System: Overcast
Barometer: 1021.4
Wind: mild and veering*
Temperature: 12.1º C
Science and Technology Log
One of the Fairweather’s launches
Today I got to go out on launch 1010. The two primary launches on Fairweather are 29-foot diesel-powered (Caterpillar) single-screw aluminum boats. I was real surprised to find that 1010 is 35 years old! It’s in great shape. Survey equipment on board includes the multi-beam echo sounder, computers, DGPS (Digital GPS gives positional accuracy to about 6 inches!) radar, radios and Iridium satellite telephones. For “creature comforts” there’s a microwave and mini-fridge as well as a very efficient heater/defrost system. Oh, by the way, there are no heads on the launches. (FYI – a “head” is marine-speak for a bathroom!)
Here I am on the launch monitoring all the data
Knowing this in advance, I didn’t have coffee or tea or a big breakfast. Turns out that when “nature calls” the rest of the crew goes in the cabin, closes the door, and you go over the side! Seems gross at first and then you realize that the 30 and 40 ton whales go in the ocean too (besides, it’s biodegradable!) The launches are carried on the boat deck (E-deck) in custom Welin-Lambie davits made for each launch. Welin-Lambie is a company over 100 years old and made the davits for a few ships you may have heard of – the British Royal Yacht Britannia, the Queen Elizabeth 2 cruise ship and oh, yeah, the RMS Titanic! The cradles are self-leveling so when the Fairweather is in heavy seas they remain upright and stable. The picture on the left shows 1010 in its cradle. When it’s time to launch the boat, the securing devices are released, the boat is swung out over the side and two >3 ton winches lower the launch to the rail of D-deck. There it is boarded by the crew and loaded with the needed gear for the day. It is then lowered into the water and sent on its way.
Once we got to the area of our polygon (I’ll explain polygons later in the week) we began acquiring data by “mowing the lawn” – the process of sailing back and forth across a defined area collecting soundings1 (bottom depths.) In every polygon we conduct a CTD cast (CTD = Conductivity Temperature Density.) These three parameters determine the speed of sound in the water and are used to accurately calibrate the soundings. Once we had been working for a while with me observing – and asking what must have seemed like unending questions – PIC2 Adam Argento and AST3 Andrew Clos guided me to monitoring the data being acquired. As you can see on the left there are 4 monitors all running software simultaneously. The picture on the right shows the keyboard and mice. The mouse in my right hand controls the windows on the three screens to the right which are data displays of received info. The left mouse controls which data are being acquired.
After a long day on the launch, it was great to see the Fairweather on this rainy day.
After lunch the coxswain4 (“coxin”) – AB Chrissie Mallory – turned the helm over to me to steer. My first leg was headed North. The positional displays on the Fairweather and its launches all have North being at the top of the displays. (This is called – logically enough – “North Up”.) I rocked! If I had to move off to the right a little, I turned right. Need to move left, turn left. There’s a little delay between when you turn and the position as displayed on the screen. Well, we got to the top of the section and turned around to head South. I needed to adjust a bit to the right, so I turned right . . . BUT . . . the boat is now oriented 180º from the prior run. So in turning right, I actually made the boat go left on the screen! Oh NOOO!!! So I overcompensated the other way. Then had to un-overcompensate . . . and so on. I’m sure when they downloaded the data back on the Fairweather they were wondering what the h*** was going on. Eventually I got the hang of it and didn’t do too badly after a while, but I have a much greater appreciation of what appeared to be really simple at the outset.
After a successful 8+ hours out (by the way, our lunches contained enough food for 6 people!) we headed back to the Fairweather about 15 miles away. To see her after a day out kind of felt like seeing home after a long day out. To the unaware, the ship looks like a mish-mash of all kinds of gear all over the place, but it’s remarkably organized. The reason for the appearance is that the ship is capable of so many tasks that the equipment is stowed in every available space. Fairweather is capable of deploying 7 small boats and operating independently of all of them in coordinated tasking! I’d love the opportunity to take a class of students for an all-day field trip aboard and could do so without ever leaving the dock – there’s so much on board!
A launch returning to the Fairwweather
As you can see in the photo of the Fairweather above, there are two large white inflated “fenders” hanging over the starboard side. This is where we’ll be tying alongside. (I took the next 3 shots from the Fairweather as 1010 approached on a different day.) As the launch approaches, the person on the bow will throw a line to the forward line handler. Notice there’s not a whole lot of room up there as well as the extended arm ready to catch the line. That bow line has a mark on it which lets the line handler on Fairweather know where to temporarily tie off the line. Then the stern line is then thrown to another line handler. Once the launch is positioned properly (no easy task in rolling seas) the hoists are lowered to the launch where they are clamped onto lifting eyes. Each of the clamps on the boat falls5 weighs close to 40 pounds – that’s why in deck ops everyone wears hardhats – and is controlled by both the winch operator and two more line handlers using “frapping lines6.” (in the picture to the left, as the launch approaches, you can see the boat falls, clamps and frapping lines.) Once the clamps are secured, the launch is lifted to the deck rail and the crew gets off, and the launch is lifted back to its cradle.
Piece of cake! Realize, however, that this simply and cleanly executed maneuver, requires: On the Fairweather: 4 line handlers The Chief Bosun 1 or 2 surveyors The bridge crew to maintain position (at least 2 people) 2 or 3 deck personnel to unload gear from the launch A Chief Scientist to task the launch The chefs to feed the launch crew On the launch: Person in charge Coxswain 1 winch operator From 14 to 16 people, all working together. On January 1, 2008, the Fairweather was authorized to paint a black letter “S” on both sides of the ship indicating that she had gone 433 consecutive days without any injuries. Considering the environment in which Fairweather works and the tasking which requires constant deployment and retrieval of heavy equipment, the “Safety S” is a reflection of her crew and officers.
Personal Log
What a great day!
Vocabulary
Soundings – depths measured
PIC – Person In Charge
AST – Assistant Survey Technician
Coxswain – (<O.Fr. coque “canoe” + swain “boy”) Individual who steers a small boat or launch
Boat falls – the lines used to raise and lower boats from a davit
Frapping lines – Lines used to control the boat falls
By the Way
It’s time to do some laundry!!! The laundry room is on D-Deck just forward of the fantail.
NOAA Teacher at Sea
John Schneider
Onboard NOAA Ship Fairweather July 7 – August 8, 2009
Mission: Hydrographic Survey Geographical Area: Kodiak, AK to Dutch Harbor, AK Date: July 10, 2009
Position
Shumagin Islands
This sheet on my door lists my duty station in case of an emergency.
Weather Data from the Bridge
Weather System: Partly Cloudy/Fog/overcast
Barometer: 1022.0
Wind: variable <8 kts
Temperature: 13.0º C
Sea State: 1 foot
Science and Technology Log
Today I was not assigned to the launch details. (The launch crews change frequently and the officers try to have the duty load between the ship and the launches balanced. Launch duty is a minimum of an 8••• hour day on the water and it taxes the crew to have the same personnel repetitively deployed. I’m also not yet up to speed enough to have any use to data processing or ship-board data acquisition. Sooooo, I took a self-directed tour of the interior of the ship!
Personal Log
The computer area outside my stateroom
The ship is divided into Decks and Sections. The sections run from 1– 10 with the bow being 1 and the stern being 10. Decks run from A to G with G being the Flying Bridge and A being the bilge. My cabin is number C-5-106. I’m on C-deck, just about amidships. The sheet of paper above my cabin number is my duty station list for emergencies. Each crewmember has one of these on their door and it tells where you belong in emergencies: Fire/AbandonShip/MOB (ManOverBoard). Just outside my door there is a small computer area about 10’ x 10’. In that area are two terminals for the ship’s LAN. Additionally there is room in this area for each member berthed there (there are four of us) to stow some gear (like the work vest/life jacket on the hook next to my door.) To the left is a yellow ladder and the sign behind it reads “Escape Hatch Do Not Block.” There are escape hatches like this all over the ship and above them the decks are kept unobstructed.
The “chiller” where the food is refrigerated
Unlike a cruise ship, most of the ship is accessible to people on board. Of course the cabins of other folks are off limits. Violate this and the punishment is severe . . . you’d never get a position on another ship in the fleet again. Also, officers’ offices are restricted. Other than that, I spent a good couple of hours nosing around and learning my way around the ship. I found that EVERY spare nook and cranny is used for storage. If she had to, I bet the Fairweather could sail for months at a time with the only limiting factor being fuel. Fairweather even makes her own fresh water by evaporating and re-condensing seawater in order to extract the salt. They should sell it as bottled water!
Hazardous materials remediation equipment in the quartermaster’s storage.
I found a “chiller” where food is refrigerated. It’s HUGE – must have been 300-400 square feet! The freezer was locked, but it must be comparably sized. When I saw the lock on the freezer door I thought of the movie The Caine Mutiny with Humphrey Bogart as Captain Queeg (“they had the keys to the food locker. They ate the strawberries.” (If you’re not familiar with the movie it is certainly worth renting!). I also found several smaller compartments where dry goods for the chefs were stored. There were cake mixes, spices, cases of condiments (including 3 flavors of Tabasco Sauce) . . . name it, and the chefs can find it!
If you look up through the circular hatch you can see the caged hazmat locker.
Further forward I found the quartermaster’s stores. Line, chain, tools and an entire 250 square foot caged off area for Hazardous materials and asbestos remediation equipment. I opened a hatch in the floor and there was a ladder that went straight down. So, I went in to find another compartment of stores. The shot below is from the bottom of that ladder, and you can see the caged hazmat locker up through the hatch. In this lower compartment were survival coats and immersion suits, printer cartridges, more work vests and more. As I worked my way aft, I went into C-9 and C-10. C-10 is the steering compartment and the rudder posts (those are the “axles” of the rudder that come up into the ship) are about a foot in diameter! There’s a motor just to turn them and for them to operate in tandem there is an 8” steel bar connecting them. You can see it with the yellow stripes. C-10 is also the home to the stern mooring lines, lubricants, hoses and power cables and spare propellers for the launches as well as the hydraulic motors for the winches and equipment on the fantail.
Just forward of C-10 is C-9. C-9 has dozens of parts drawers with thousands of parts and fittings for all over the ship. It is also the home to the exercise equipment. The crew has figured out how to cram just about everything they need into the compartment. Free weight, Pilates balls, punching bag, speed bag, treadmill, and weight bench! There are even a few bicycles hanging from the overhead that are used in port.
This is the part of the ship called the steering compartment which houses the machinery that controls the direction of the ship.
To close the story (I’ll have to do your tour of decks D and up on a later day) I made it all the way down to A-Deck. A-Deck is the bottom of the ship. It is accessed by going through a shower compartment forward on C-deck into a small, half-height, sloped-ceiling opening in which there is a 24-inch diameter hatch. The 24-inch hatch connects with rungs welded into the wall and it goes straight down. Descend this ladder and your feet are on B-deck. Open an even SMALLER hatch and you can see the inner bottom of the ship. This compartment is only about 3••• feet tall, but I squeezed through the hatch and put my feet on the bottom. In retrospect, I should have taken off my Crocs to see how cold the steel was. I’ve been told that people actually go into this space to do work. I think if I could wiggle my way in somehow, the only way to ever get me out would be to drydock the ship and cut me out through the bottom!
This room has many drawers that contain thousands of different parts and fittings for all over the ship. It also has the exercise equipment.Here I am squeezing through the hatch that leads to the very bottom of the shipHere are my feet touching the bottom of the ship.
Questions for You to Investigate
Where does the term “scuttlebutt” (meaning rumors and gossip) come from?
The survey technicians use the term NADIR a lot in regards to the multi-beam echo sounder. What is a nadir?
When was the Marine Mammal Protection Act passed?
What was “Seward’s Folly” and how do you think it turned out for America?
Which is closer to the Shumagin Islands, New York City or Moscow? San Diego or Guam?
NOAA Teacher at Sea
John Schneider
Onboard NOAA Ship Fairweather July 7 – August 8, 2009
Mission: Hydrographic Survey Geographical Area: Kodiak, AK to Dutch Harbor, AK Date: July 9, 2009
Position
Shumagin Islands
Weather Data from the Bridge
Barometer: 1022.3
Wind: light & variable
Temperature: 12.1ºC
Sea State: <1 foot
This top of this picture shows the area that has been surveyed, and the bottom half has not been surveyed yet.
Science and Technology Log
While part of the survey crew was doing more bottom sampling, launches 1010 and 1018 were deployed to acquire other data from areas ranging between 5 and 15 miles away. The launch deployments today were for 8 hours and the chefs prepare to-go lunches for the crews. The Fairweather is well-suited to its task here in the Shumagins. The crew is experienced at this and it shows. While the launches are away gathering data close to shorelines, the ship sails backand-forth across wide swaths of open ocean using the multi-beam sonar to document depth. Some members of the crew call this “mowing the lawn” which is a perfect analogy (I like to think of it more like a Zamboni cutting the ice in a hockey rink!)
The swath covered by the multi-beam sonar can extend to 75º up from vertical on each side of the ship. As you can see in the picture, the top half of the screen is green. This is an area that has been surveyed with Multi-Beam Echo Sounders (MBES). The white at the bottom is bottom that has not been surveyed. Fairweather is sailing a course from East to West onthe screen and the MBES is sweeping a path indicated on the screen in orange. The colors are significant – they represent different depths. (If you look closely you can see a color bar on the left of the screen. Red=shallow, blue=deep.) the number on the right is the depth in meters. Fairweather does all its bathymetry (<Greek bottom/depth + measure) in meters as they are the units of scientific analysis. Hopefully in the next few days I’ll get to have a better understanding. Right now it kind of glazes over . . . too much input!
Deck Maintenance
Look Carefully – Blue writing!
A ship the size of the Fairweather (230 feet, 7 decks) has an enormous amount of maintenance required just to keep it ship-shape. The permanent crew of AB’s (Able Bodied Seaman,) engineers, stewards and officers keep the Fairweather spotless and running flawlessly. This morning there was need for a modification to a pulley used to deploy the bottom sampler. It was constructed in a short amount of time. The marine environment is merciless on steel and the ship is constantly being stripped of old paint, primed and repainted. Doing this requires that the old finish be removed with a “needle gun” which is a compressed air powered tool consisting of a 1.5cm diameter head of about 25 “needles.” The “needles” are more like 1 mm flathead finishing nails that bounce on the surface like mini-jackhammers.
By impacting the surface thousands of times a minute, old paint is loosened from the underlying steel and chips off. The really cool aspect of this is that the underlying steel isn’t even dented! When I started on this piece of steel it was painted with one layer of primer and two layers of white paint. Now it’s down to bare metal and the markings from the original construction of the davit are clearly legible! After being stripped, a coat of anti-oxidation paint is applied, then primer, then one or more coats of paint. The crew never stops and the condition of the Fairweather is a testament to their diligence.
Personal Log
The weather is absolutely perfect. It is sunny, warm, calm seas. I’m sure it can be (and probably will be) worse at some time during the trip, but for now everyone is soaking it all in! The Fairweather has a ship’s store with some snacks, necessities, T-shirts and other items. It’s open periodically (announced on the PA) and I’ll be sure to hit it up before leaving Dutch Harbor (but I’ve got to get to an ATM – they don’t take American Express.) 😉
Animals (or other cool stuff!) Observed Today
Whales about a mile off the bow – not close enough to see well – brittle stars, tube worms, more coral(!) and the daily dose of sea birds. This morning there was a bit of time when some fog was rolling over a mountain island about 10 miles away and it looked like the fog was just cascading over the top from the other side. Gorgeous!
NOAA Teacher at Sea
John Schneider
Onboard NOAA Ship Fairweather July 7 – August 8, 2009
Mission: Hydrographic Survey Geographical Area: Kodiak, AK to Dutch Harbor, AK Date: July 8, 2009
Position
Small boat/launch operations vicinity; Herendeen Island (Shumagin Islands Group)
Weather Data from the Bridge
Wind: light & variable
Temperature: 12.7ºC
Sea State: 1 foot
National Ocean Service Benchmark
Science and Technology Log
Today I’ll be heading out on the Ambar (an aluminum hulled inflatable) to check on a tide gauge off Herendeen Island. It might get chilly being off the Fairweather, but the weather has been fantastic since we left. Waves <1 foot, winds below 5 or 6 knots. Weather actually got better as we went to the tide station. (I’ll try to get a good shot of each of the launches.) The tide station is a remarkably simple in concept, yet a terribly complex operation to execute. A month ago, Fairweather personnel installed a tide station on Herendeen Island. This involved sending a launch to the island where personnel did the following setup work:
The tide gauge interface being downloaded to a weather/shockproof laptop computer
Drill a 1/2 inch hole 3” deep into a solid piece of granite and set a bronze bench mark into it.
Drill 3 more holes into a huge granite boulder at the water’s edge. Construct, on that boulder, a vertical tide gauge with markings every centimeter, ensuring that the bottom of the gauge is both lower and higher than the tide should go.
Precisely and accurately determine the height of the benchmark in relationship to the heights on the tide gauge.
Send a diver down below the lowest tide levels and install a nitrogen-fed orifice connected to a hose and secure it to the sea floor.
Connect the hose to a pressurized tank of nitrogen on shore.
Install a solar power panel near the station with a southern exposure.
Install the data acquisition interface. This piece of equipment forces a single nitrogen bubble out of the orifice every six minutes (one-tenth of an hour) and measures the pressure it takes to release the bubble which is then used to calculate the depth of the water (as a function of pressure.)
Collected data are automatically sent by satellite to NOAA. A month later, the survey team re-visits the site and performs a series of 10 visual observations coordinated with the automated sequences of the nitrogen bubble data recorder. These visual observations are then compared to the automated data acquired. If their statistical differences are within accepted parameters, the data are considered valid and will be used further. If not, the data are discarded and collection is re-started.
It’s a little weird to see the Ambar leave after dropping us off on an island that has seen very few footprints!
Not only is the process painstaking, but the technology and Research & Development needed to design the equipment must have been extremely difficult. However, given the amount of our nation’s dependence on marine commerce and movement of goods, it is time and effort more than well spent. Once we returned to the ship, I was able to lend a hand on the fantail (that’s the aft area of the deck where a LOT of work gets done) where the survey team was collecting samples of the ocean bottom. Bottom sapling is done at specific locations proscribed by NOAA guidelines for coastal waters. It is important for mariners to know the type of bottom in an area in case they need to anchor or engage in commercial fishing.
Bottom samples are collected using a Shipek Grab. This 130-pound tool captures a 3-liter sample of the bottom. The scoop is spring loaded on the surface and when it strikes the bottom a very heavy weight triggers the scoop to close, picking up about 1/25 of a square meter of bottom. Bottom characteristics are then recorded with the position and will eventually be placed on nautical charts. Sometimes even small animals get caught in the grab. Today we saw brittle stars, tube worms and a couple of little crabs. However, the biggest surprise to me was finding numerous small pieces of CORAL in the samples! I certainly did not expect to see coral in ALASKAN waters!
Personal Log
A piece of coral on a pebble. (It’s on a 3×5 file card for scale.)
Lest you think that it’s all work and no play, we anchored tonight after a 12 hour+ work day. With sunset at around 2330 hrs (11:30) there was still time for some fishing (nothing was kept but we caught a couple small halibut) and movies in the conference room. There are movies aboard almost every night as well as closed circuit images from 4 areas of the ship. I’ve also started taking pictures of the menu board every night but won’t post all of them because of space limits on my file size – besides, you all simply wouldn’t believe how well we are fed on the Fairweather. Just as an example: how does blackened salmon wraps sound for lunch??? Oh yeah!!! (You have permission to be jealous!)
Coming back, the Fairweather, after being out of sight from the Ambar, is a welcome sight!
Animals (or other cool stuff!) Observed Today
Saw a whale in the distance, quite far off, just before lunch. Two seals a couple hundred meters aft of the port quarter. While at the tide station we saw two whales’ spouts near the shoreline, one seal poked his big ol’ head up from the kelp bed and checked us out a couple of times, saw a bunch of loons, cormorants and puffins, and while at the tide station, Dave Francksen (a very helpful member of the survey team) caught sight of an octopus.
This octopus was about 2 feet across from tentacle-tip to tentacle-tip and changed color when it got over the spotted light-colored rocks.
Questions for Your Investigation
What phylum and class are octopi? Are Brittle Stars?
What “day shape” does the Fairweather display when anchored? When conducting survey operations?
NOAA Teacher at Sea
John Schneider
Onboard NOAA Ship Fairweather July 7 – August 8, 2009
Mission: Hydrographic Survey Geographical Area: Kodiak, AK to Dutch Harbor, AK Date: July 6, 2009
Position
57° 43.766’ N, 152° 30.946’ W (Pier at USCG base – Kodiak)
Weather Data from the Bridge
Barometer: 1022mB (30.15”) This is a nominally high pressure air mass characterized by cool temperatures and clear skies.
Wind: 4-6 kts (gusts to 12) 30º off the port bow (ship is facing ~60º at the pier)
Temperature: low 60’s Sea state: calm
The FAIRWEATHER alongside the USCG Pier, Kodiak
Science and Technology Log
Our mission on this cruise is to conduct small-boat hydrographic research and documentation of the sea floor in the Shumagin Islands region. This is an area about 250 miles Southwest of Kodiak. It’ll take about a full day of steaming just to get there. I took a rough estimate of an area of approximately 900 square miles in the Shumagins and found a total of about 100 depths recorded! I realize that the numbers may be hard to read, but the picture to the left is just South of Nagai Island in the Shumagins and includes about 900 square miles. As you can see, there are very few markings in the area. Compare this with the picture to the right of an area of the same size more thoroughly surveyed.
A nautical chart of the area the Fairweather will be surveying, called the Shumagin Islands.
The 1953 Coast Pilot says of the Shumagins “…comprising 15 sizable islands and many islets and rocks, extend for a distance of 60 miles from the coast of the Alaska Peninsula from which the group is separated by Unga Strait.” The newest edition (2008) is worded identically! It’s obvious that there is a need for research in the area and newer charts available to mariners will benefit from the data we collect in the next leg of the Fairweather’s tasking. Regarding data collection and storage, yesterday I was shown the compartment (room) where the on board computer servers are kept. It is one of the significant responsibilities of the duty officers to regularly check the temperature of that compartment as the entirety of the data collected is stored on those servers. If the entire mission runs flawlessly and the data are allowed to be compromised, the mission is ultimately a failure.
Barnacles
Historically, soundings were taken by lowering a weighted line—called a “lead line” because the weight was often made of lead—to the bottom and seeing how deep the water is at that location. Positions were estimated by manually triangulating “fixes” using visual bearings to known landmarks. Later (from the 1950’s through the 1970’s) positions were established using LORAN (Long Range Radio Navigation) and Radar and depths were determined using depth sounders which bounce an electronic “ping” off the bottom. All of these earlier methods were very prone to human error and imprecision.
Bald eagle
Current technologies integrate multi-beam sonar interfaced with computers and satellites to determine position (within just a couple of feet) and not only the depth of the water straight down, but off to the sides. When the data are uploaded to the Fairweather, the computers on board coordinate the exact time, GPS position, tide level, temperature, salinity and clarity of the water at the position of the data acquisition allowing the computers to correct for the different rates of transmission of the sonar signal through differing densities of water to determine the most accurate sea floor information ever possible. So now, as a navigation term, “by the Mark, Twain” (meaning 2 fathoms of depth) is obsolete…but the literary contributions of Samuel Langhorne Clemens remain a tribute to America’s heritage!
Personal Log
All the dark spots are Bison!
Today at the 1400 pre-cruise briefing I was fortunate to be present when two of the officers on the Fairweather were acknowledged as having been promoted. The response of the crew demonstrated the respect these officers had earned. If lunch today was any indication of how the meals will be on board, I can’t wait for dinner and don’t want to go home! Fajitas with about 15 different toppings available, corn on the cob, salad and soup!
Animals (or other cool stuff!) Observed Today
Fox along the road!
While gazing down into the water alongside the ship, I noticed what appear to be 2 different species of jellies – one looking similar to the East Coast’s Aurelia aurelia about 10” in diameter and the other being unknown to me. The unknown was radially symmetrical (as are all jellies) but all of them had 8 distinct lobes on the bell and measured about half the size of the other species.
I also noticed barnacles, mussels and sea anemones living on the pilings that hold up the pier. The anemones at left must have been three inches in diameter at the body tube and the tentacles extended in a halo about 10-12 inches in diameter. On a 2.5 hour drive this afternoon I also saw 2 bald eagles, a herd of bison, a red fox and a kingfisher. (The fox picture is a bit blurred, it was a bit skittish and I took it through the windshield.)
Questions for You to Investigate
What animal did Benjamin Franklin want to use as a National Symbol? When were the Shumagin Islands named? For whom are they named? What is scurvy and how is it prevented?
Location: At anchor Popof Strait, Shumagin Islands, AK
Latitude: 55 deg 17.30’ N
Longitude: 160 deg 32.14’ W
Visibility: 5 nm
15:00
Direction: 110 deg
Wind Speed: 10 kts
Sea wave height: 0-1 ft
Swell wave height: n/a
Seawater temperature: 10.0 deg C
Sea level pressure: 1018.2 mb
Cloud Cover: 5/8
Weather: Fair to Partly cloudy, spots of fog dissipating. 12.12 deg C
Plan of the Day:
Continue the launch survey with 2 boats. In house data cleaning and processing. Meeting with LIDAR tech stationed in Sandpoint.
Science and Technology Log
I personally spoke with a survey technician, Amanda McKinney on board to gather more information on hydrography and the process behind it. There were two main topics that we discussed: Application and history of marine survey, and the math/science behind the techniques.
Application/History
The technology used for marine survey has been improving by leaps and bounds and we are currently using a collection of old and new technology to gather data. Many nautical charts have not been charted for almost 80 years or more and some areas have never been accurately charted at all. The old process was to drag a lead line behind a transiting ship. This process was full of errors because you could never accurately know your depth, even if the length of the line was known; it was drug and therefore skewed the data. Very often a charted depth from these old processes are found to be dangerous wrong. Another mode of survey is the wire drag, where multiple ships drag a wire through the water column. Once a target has been hit, the depth of that underwater target is calculated, but never truly charted accurately. Side scan sonar came around and improved the survey capability, but it too has its drawbacks. Because the “fish” is towed there are many more mathematical corrections that must be made in order to get a reading that is close to the actual target. It does produce wonderfully clear pictures of what is around the “fish” but those images lack depth of field and the sonar cannot read directly below the transmitter. Quite often with side scan images, divers are needed to dive the sight of a possible target to get accurate readings. Multi-beam sonar can be used in conjunction with side scan to better improve the over all picture of the underwater area. Because multi-beam is able to give more accurate readings and the data is complied in 3-D images, surveyors can have both a clear image and precise depth reading all together. It is hoped in the future that there will be new sonar systems that can scan at 480 beams over .25 x .25 deg per beam with 40+ pings per second. The highest level of technology currently used by NOAA is the Reson 8125 (this system is attached to two boats currently) and it sends out 240 beams over 0.5 x 1 deg / beam at 15 pings per second and runs with 455kHz. Remember, that a short pulse (wavelength) will give better vertical resolution and higher frequencies give shorter pulses or wavelengths.
The math required to figure the depth is not very difficult, however in the case of the ocean, the computers must adjust all readings for depth, salinity, temperature and density, which in a way makes the math more difficult if done by hand.
Depth=Speed+ Time/2
Personal Log
I was able to spend some time with the survey tech’s today and got through some of the PowerPoint presentations that are available here on the intranet to educate myself more on the technology and process. I was pleased to see that I can apply some of the simple ideas to my classroom. When I teach certain science skills I will have real life data sets and examples for the kids to analyze. I also hope to get some of the kids excited in the field of sonar and survey, much needs to be done to improve the accuracy and reliability of these systems and the product they produce.
Sunday equals fishing off the fantail in between shifts. We have a resident pack of gulls that have found it much to their benefit to hang out for the halibut leftovers that get tossed overboard or that slip from bait hooks.
I found a whale bone yesterday on Egg Island and had the boat shop guys saw it in half so that both of us TAS’s could bring something back for the classroom. It is not a large chunk, but authentic to say the least. I also gathered some sea sponge that had washed up and a very unique white rock.
I was very surprised to see the people working on a Sunday. No one should ever question the dedication of the folks on board or say that this is an easy job. One of the engineers has not had a day off in two months or more. The ship is something that has to be tended too by her crew and command 24 hours a day 7 days a week. Self-sufficiency comes with some responsibilities!
Question of the Day
Which is better: side scan or multi-beam sonar?
There is not one that is better than the other so much as they can compliment each other to produce and more detailed and accurate product, namely the nautical charts and other products that use the information gathered via the sonar medium.
Location: Sonar Patch cruise, SE of Devils Bay on AK peninsula
Latitude: 55 46.163 N
Longitude: 158 03.557 W
Visibility: < 1 nm
Direction: 229 degrees
Wind Speed: 16 kt
Sea wave height: 1-2 ft
Swell wave height: 1.2 ft
Seawater temperature: 8.9 deg C
Sea level pressure: 1021.1 mb
Cloud Cover: n/a fog
Weather: Fair and foggy, 8.9 deg C dry / 9.4 deg C wet
Plan of Day: 1.5 days of sonar readings in patch with lines of 2.5 hours each. Launch #5 boat for survey north of ship around a possible rock pinnacle.
Science and Technology Log
Sonar Systems on board RAINIER: How they work.
What is Sonar?
In its most basic sonar are sound waves that are produced and then bounced back off of an object and recorded. Since the speed of sound is a known figure, the amount of time it takes for the sound wave to return to the transmitter/receiver gives a collectable image of that object. The deeper objects are the longer the sound wave takes to bounce back. Two types of sonar are single beam and multi-beam. Single beam is able to give high detail to an object but only shows a narrow swath, while multi-beam has a large footprint and can show a larger over all area. There are limits to the depth sonar can go because of the density of the water column. If the water is very dense the sound waves are slowed down and do not transmit the correct timing, therefore the image will be distorted. All images created must be analyzed after the density, temperature and salinity of the water column is taken into consideration.
Sonar is a very powerful sound wave and it can be dangerous, although it is at a frequency that humans or marine mammals cannot hear. If a diver were scanned they would be susceptible to a high-level concussive power. The emitter itself requires a large volume of power and if a human were to be near it during an emission it would do a great deal of damage. Think of the concussion from a bomb or firework, sonar is many, many more times as powerful.
RAINIER’s Sonar:
The ship is equipped with a deep sonar transmitter; it is attached to the hull and is used for scanning deep water where resolution is not a large issue. The boat “mows the lawn” in a patch of ocean. Each pass is numbered and the data collected. The lines are about 2 hours at 7-8 knots long. For more detailed work or a smaller area the ship will use one of its 6 launches that are also equipped with various sonar transmitters. These small boats will conduct and similar pattern of lines and collect the data right on board. The data is then transferred to the computers on board to go through technician cleaning and final analysis.
Sonar Types:
Single-beam – one beam sent and received.
Multi-beam – up to 240 beams per 180 degrees sent and received. As depth increases the foot print widens.
Analysis of data:
When the soundings are collected they are run through a Carris computer program where the technicians can manually scan each line. There are techs assigned to each “sheet” or area. Each line is cleaned, meaning outliers are removed or other “noise” is deleted. Once the data is clean a complete 3-D image of the patch can be looked at with all the data points represented. Once an entire area has been scanned objects become very clear, as if you were looking at them. From outlines of sunken ships from the side to large monolithic rocks protruding from the ocean floor, the detail and accuracy of the image is amazing. Once there is enough data the sounds can be turned into color-coded overlays that fit right on top of the fathom charts, so as to give a 3-D view of what those fathom readings represent. Red and orange or shallow and the colors move through yellow, green and finally blues, which are the deepest readings. Mountain ridges, lava floes, old wrecks, valleys and monoliths all come to life on the chart.
Personal Log
Steve Foye gave me a quick training with another new member of the crew on the job of Lookout on the flying bridge last night. He reviewed the 32-point compass and the difference between saying North relative to the ship verses trying to figure out the “real” compass coordinate. He explained you could use directions (NW or SE) or give the coordinates (90 or 270). Dead ahead would be 000, north relative to the ship or 360, all are correct for locating something directly off the bow of the ship.
Question of the Day:
When is the ship required to sound foghorn and place lookouts on the Bow/Flying Bridge?
When the visibility gets below 1 nm the ship is required to blow the foghorn or ring a bell every 2 minutes. A lookout is placed on the flying bridge during hours of darkness or low visibility. They move to the bow when the foghorn is turned on so they do not damage their ears.
Time: 10:15
Latitude: N 57°31.730
Longitude: W 154°58.325
Visibility: 10 + m
Wind direction: 250
Wind speed: 18 knots
Sea wave height: 2 – 3 feet
Swell wave height: 2 – 4 feet
Sea water temperature: 10.6 °C
Sea level pressure: 1020.1 mb
Air temperature: 12.2 °C
Cloud cover: 2/8
Science and Technology Log
I talked more with P.S. Shyla Allen about how the multibeam echo sounders work on the ship to gather data about the depths of the ocean. Both the RAINIER and the launch ships use the following method to gather data. All of these vessels use echo sounders with anywhere from 120 to 240 beams that scan the ocean floor. The following diagram illustrates how this is done:
Figure 1: Multibeam Echo Sounding
Here, “z” is an echo sounding two-way travel time beam, and the multibeams are spread over the footprint distance of “f”. The size of the sound footprint, “f”, depends on the depth at which the measurement is taken, “z”. The greater the depth is, the greater the footprint is. However, the greater the footprint is also means less accuracy on the outer edges of the footprint. Therefore, the ship will run a “mowing the lawn” pattern across the given section to get desired overlapping of data:
Figure 2: Mowing the Lawn pattern
The width of these lines is determined by: width of x = 3 * z. By using this rough equation, the ship will be able to overlap the areas of least accuracy, i.e. the areas on the outer range of the footprint:
Figure 3: Ship running mowing the lawn pattern so the footprints overlap.
From this data, the depth and contours of the ocean floor can be determined. I also asked P.S. Shyla Allen about the problems and sources of error associated with this data collection. She responded by detailing three main issues that must be corrected when cleaning the data, i.e. the data must undergo three main correction factors before accurate readings can be analyzed. These three factors include: a) tide changes, b) sound velocity, c) the motion of the ship and GPS positioning. To correct for tide changes, the researchers must have accurate readings of the tides. Tide gauges are installed along the coastline at various points, and all readings are reduced to Mean Lower Low Water (MLLW). This basically gives the average of the lowest possible depth at a given location. To correct for sound velocity changes, which is the most important correction factor dealt with, researchers take measurements of water temperature and salinity level at the given depth reading. For every change of 1 ppm in salinity, there is a change of 3 m/s in sound velocity. Therefore, salinity is perhaps one of the most important factors. Finally, the motion of the ship and GPS position need to be corrected for. This includes correcting for the pitch, roll, and gyration of the ship as well as error in the GPS system. Because the ship uses Differential GPS (DGPS), this error is already accounted for. However, for the pitch, roll, and gyration of the ship, two antennas are used to on the port and starboard sides. These antennas, often referred to as Motion Reference Units (MRU), are very stable feed into the same computers that process the data. Therefore, the computer takes into account the readings from these antennas and combines this information with the corrections made for the tidal changes, sound velocity factors, and positioning of the ship. After cleaning the static from the data, a nautical chart can be produced. This method of charting the ocean floor is definitely more efficient than when researchers used lead lines—long ropes with lead that would be dropped down and then measured to determine the depth!
Personal Log
I woke up this morning after sleeping for about 12 hours—I think the seasickness medicine I took last night made me very sleepy. Luckily, however, all traces of seasickness are gone; I can even sit here at the computer and type without noticing the pitching of the ship very much at all. I think all of my muscles must be getting stronger as a result of reacting to the changing ground and all of the stairs I go up and down every day. I spent some time on the bridge this morning mostly asking questions about the tools used there and what various measurements mean. I find it very interesting that simply reading tiny numbers and using small switches and knobs will run this 231 foot ship. However, my experience aboard ships tells me that it is not even close to impossible. I know that even the slightest adjustment at the helm on a sailboat can change the course of the boat. I am reminded of sailing in the British Virgin Islands and the dispute over if it was more important to maintain the way point or try to make the boat go very fast. However, that is not an issue on this boat. We are supposed to reach the Shumagin Islands tonight, and tomorrow we will start the launches—I can’t wait!
Question for the Day
How many sets of data points must be filtered out before the data is considered clean? On what does this number depend? How does one determine if a data point is an outlier or and actual reading?