NOAA Teacher at Sea
Lisa Carlson
NOAA Ship Bell M. Shimada
July 5, 2023 – July 19, 2023
Mission: Fisheries: Pacific Hake Survey (More info here)
Geographic Region: Pacific Ocean, off the coast of California
Date: July 16, 2023
– – ⚓ – –
Weather Data from the Bridge
July 14 (1200 PT, 1500 EST)
Location: 38° 34.9’ N, 123° 42.7’ W
15nm (17mi) West of Stewarts Point, CA
Visibility: <1 nautical miles
Sky condition: Overcast, fog
Wind: 19 knots from NW 330°
Barometer: 1014.6 mbar
Sea wave height: 3-4 feet
Swell: 5-6 ft from NW 300°
Sea temperature: 11.0°C (51.8°F)
Air temperature: 13.1°C (55.6°F)
Course Over Ground: (COG): 330°
Speed Over Ground (SOG): 10 knots
July 15 (1200 PT, 1500 EST)
Location: 38° 56.3’ N, 124° 02.1’ W
13nm (15mi) West of Point Arena Lighthouse, Point Arena, CA
Visibility: 10 nautical miles
Sky condition: Overcast
Wind: 20 knots from NW 340°
Barometer: 1013.1 mbar
Sea wave height: 3-4 feet 3-4
Swell: 7-8 ft from NW 320°
Sea temperature: 10.8°C (51.4°F)
Air temperature: 13.3°C (55.9°F)
Course Over Ground: (COG): 270°
Speed Over Ground (SOG): 9 knots
July 16 (1200 PT, 1500 EST)
Location: 39° 36.2’ N, 124° 01.6’ W
14nm (16mi) Northwest of Fort Bragg, CA
Visibility: 10 nautical miles
Sky condition: Overcast
Wind: 29 knots from NW 320°
Barometer: 1011.4 mbar
Sea wave height: 3-4 feet
Swell: 5-6 ft from NW 320°
Sea temperature: 11.3°C (52.3°F)
Air temperature: 13.9°C (57.0°F)
Course Over Ground: (COG): 280°
Speed Over Ground (SOG): 7 knots
– – ⚓ – –
Science and Technology Log
Without a vessel and without a crew, none of this mission would be possible. As I’ve said before, this crew is special. Like any job, employees are required, but that does not mean that you will work well cohesively and passionately towards a goal. The two weeks I’ve been spending with this crew who is so wholeheartedly excited about their job and role, while being on the ocean, has been so rewarding and inspiring. More later, this is starting to remind me of crying along with my sobbing fourth graders on the last day of school.
While I’ve discussed a lot of the daily operations of the crew and ship, and what I’ve been learning and working on myself, however, I have not discussed the vessel and agency that has made all of this possible. Many people question, “What is NOAA?” when I explain this opportunity.
About NOAA

“The National Oceanic and Atmospheric Administration (NOAA) is a U.S. government agency that was formed in 1970 as a combination of several different organizations. The purpose of NOAA is to study and report on the ocean, atmosphere, and coastal regions of Earth.”
National Geographic Education: “National Oceanic and Atmospheric Administration (NOAA)”
“Our mission: To understand and predict changes in climate, weather, ocean, and coasts, to share that knowledge and information with others, and to conserve and managecoastal and marine ecosystems and resources.”
NOAA: “About Our Agency”
NOAA: “About Our Agency”
NOAA Ship Bell M. Shimada can carry a total crew of 24, which include NOAA Corps officers, engineers, other crew members, and scientists.
“The NOAA Commissioned Officer Corps (NOAA Corps) is one of the nation’s eight uniformed services. NOAA Corps officers are an integral part of the National Oceanic and Atmospheric Administration (NOAA), an agency of the U.S. Department of Commerce, and serve with the special trust and confidence of the President.”
NOAA OMO: “NOAA Commissioned Officer Corps”
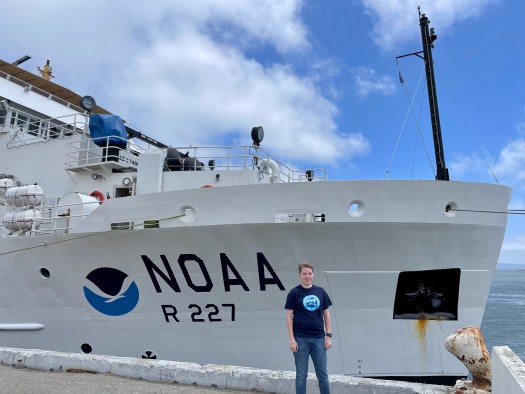
The Vessel
NOAA Ship Bell M. Shimada, commissioned in 2010, is a fisheries survey vessel designed to produce a low acoustic signature, built to collect data on fish populations, conduct marine mammal and seabird surveys, and study marine ecosystems. The quiet operation provides scientists the ability to study fish and marine mammals without significantly altering their behavior.
Stats and Specs (Link for more information)
Length: 208.60 ft
Beam (width): 49.2 ft
Draft (bottom of the lowered centerboard to waterline): 29.7 ft
Displacement (full load): 2,479 tons (4,958,000 lbs)
Speed: 11.00 knots
Endurance: 40 days
Range: 12,000 nautical miles
Home port: Newport, Oregon
Crew:
– 24 (5 NOAA Corps officers, 4 licensed engineers, and 15 other crew members)
– Plus up to 15 scientists
Namesake
“[Dr.] Bell M. Shimada (1922-1958), served with the United States Fish and Wildlife Service and the Inter-American Tropical Tuna Commission, and was known for his studies of tropical Pacific tuna stocks.”
Wikipedia: “NOAAS Bell M. Shimada”
The ship’s namesake was known for his contributions to the study of Tropical Pacific tuna stocks, which were important to the development of West Coast commercial fisheries following World War II. Dr. Bell Shimada and colleagues at Pacific Oceanic Fisheries Investigations (POFI) Honolulu Laboratory were among the first to study the population dynamics of tunas and the oceanography affecting their abundance and distribution.

Dr. Bell M. Shimada, circa 1957.
Wikipedia: “Bell M. Shimada”
“In her remarks at the christening and launch, [Dr. Shimada’s daughter] Julie Shimada offered the following, “I hope the Bell M. Shimada is a lasting testament that no life is too short, no career too brief, no contribution too small, to make a difference.”
NVC Foundation: “NOAA Honors Nisei With Launch of Fisheries Vessel “Bell M. Shimada””
– – ⚓ – –
Interviews with the Crew
(Part 1 of 2)
(Take note of the similarities and differences between how these crew members chose an ocean-related career and got to be assigned to NOAA Ship Bell M. Shimada)

Executive Officer
Commander Laura Gibson
What is your role aboard NOAA Ship Bell M. Shimada?
CDR Gibson’s role includes a lot of administrative work, handling the budget, standing bridge watches as the Officer on Duty (OOD), along with other executive duties.
What do you enjoy the most about your role?
The mission and camaraderie of the crew, as well as getting to know the ship and happy, successful operations.
When did you know you wanted to pursue an ocean-related career?
CDR Gibson enjoys Scuba diving and grew up on lakes. She worked on a research ship in college and continued working on the water which led her to NOAA. She mentions her Dad as a large motivator and inspiration of wanting to pursue an ocean-related career.
What do you think you would be doing if you were not working for NOAA?
Working a boring 9-5 desk job!
Favorite animal
Rhinoceros
Fun Fact: she brings a stuffed animal dog with her from her son, named Barfolomew.
His nickname is Barf!


Operations Officer
Lieutenant Nicole Chappelle
What is your role aboard NOAA Ship Bell M. Shimada?
Coordinate with scientists to make the plan of the day, assist in navigation and operation of the vessel.
What do you enjoy the most about your role?
Nicole enjoys seeing all of the sea life and creatures, and hearing and learning what the scientists are doing and why.
When did you know you wanted to pursue an ocean-related career?
She originally wanted to work with animals, which she did as a member of a rehabilitation team at Sea World. She then wanted to join uniformed service. Nicole chose NOAA’s uniformed service (NOAA Corps) because their science missions aligned with her interests.
What do you think you would be doing if you were not working for NOAA?
Working with animals and marine life or being a scuba instructor.
Do you have an outside hobby?
Horseback riding, Scuba diving, jogging, kayaking, hiking.
What’s something you were surprised to see or learn about living and working onboard when you first started?
Nicole remarked on the times she’s been out in the ocean, hundreds of miles away from shore, and how few other vessels you see there. She says it gave her a much greater appreciation for just how big the ocean is.
Favorite animal
Horses

Junior Engineer
Deb Rose
What is your role aboard NOAA Ship Bell M. Shimada?
Junior Engineer Deb Rose (in her words) handles the “hotel services” of the vessel. Her role includes plumbing, electrical work, repairs, and many other behind the scene tasks to keep the vessel running safely.
What do you enjoy the most about your role?
I get to fix stuff! Troubleshooting, figuring out what’s wrong, and fixing the problem were among steps that she described as part of her work onboard.
When did you know you wanted to pursue an ocean-related career?
While working at Firestone, Deb met and befriended Jason who became a wiper on NOAA Ship Oscar Elton Sette. She saw pictures and heard his stories of how he is now a licensed engineer, and decided to follow in his footsteps! She mentions Jason as a motivator that inspired her to pursue an ocean-related career.
What do you think you would be doing if you were not working for NOAA?
Continue to work on the Alaska Marine Highway ferries. (These ferries cover 3,500 miles of Alaska’s coastline.)
Outside hobbies: Video games, Scuba diving, swimming, fishing
What’s something you were surprised to see or learn about living and working onboard when you first started?
How few women there still are in the industry. Deb has often been the only or one of the only female crew members both on land and at sea. She hopes that this trend will keep changing and that women will be in more engineering industries.
Favorite animal
Her favorite animals are the Jackson Chameleon and dogs.
Fun Fact: Humans are more related to salps than any other creatures we catch. She can also identify 12 Rockfish species!

Deck Department
Connor Rauch
What is your role aboard NOAA Ship Bell M. Shimada?
Connor is a General Vessel Assistant as part of the Deck Department. He helps deploy and recover the trawl net and CTD rosette, stands watch as a lookout, helps keep the ship clean, and much more! He took classes at Seattle Maritime Academy for one year and is now applying his education on his first NOAA vessel!
What do you enjoy the most about your role?
He is enjoying his first assignment on a NOAA vessel and traveling up and down the Pacific coast. He says he is also enjoying being on the water, applying new knowledge to tasks, and training to a real ship. He also enjoys learning about trawling and commented on how nice the people onboard are.
When did you know you wanted to pursue an ocean-related career?
He wanted to try something new after working for a non-profit group during the Covid-19 pandemic assisting those in need. He decided to work on the water since he grew up sailing and kayaking. He thought of working on local ferries, but after taking classes at Seattle Maritime Academy, he had the confidence to apply for NOAA.
Do you have an outside hobby?
Reading, kayaking, camping, and hiking.
What’s something you were surprised to see or learn about living and working onboard when you first started?
Connor said he was pleasantly surprised at how tight the crew is, how easy it is to sleep, how comfortable the ship is, and the good food!
Favorite animal
Beavers and dog
– – ⚓ – –
Personal Log
As this experience comes to the end, I reflect on all parts of this mission. The crew, vessel, marine life, food, sleep, friendships, and more. I’m so thankful I was able to have this experience and share NOAA’s Teacher at Sea program more with coworkers, family, friends, and my students. Meeting and talking with the crew resulted in long conversations and plenty of laughs and connections amongst each other that they previously had not known.
Winds and swells picked up over the weekend and on Sunday July 16 we only caught six Hake. After that trawl and an increase in marine mammals being sighted when we were trying to trawl, fishing was called off for the rest of the Leg. At 1020 Monday July 17, we completed our last transect for Leg 2 of the Survey and headed due North for the long trek to Newport, Oregon. We still found ways to entertain ourselves, nap, snack, share stories and riddles, take photos of sunsets and marine mammals, watch shooting stars and have a movie night. Below are photos of our art craft: fish prints of two Chilipepper Rockfish!


– – ⚓ – –
Did You Know?
NOAA Ship Bell M. Shimada has an endurance, the amount of time the vessel can be at sea in a row, of forty days. This is not because the ship can’t make its own fresh water through reverse osmosis from sea water, or a lack of fuel, oil, extra parts, or a way to exhume waste and trash in an environmentally friendly way…
but because of food!
Our galley crew is amazingly talented and spoils us with a huge all you can eat buffet, desserts, and drinks every day! But, as per various laws and for the safety of the crew, they are lawfully entitled to fresh fruit, vegetables, meat, etc. within set guidelines and window of time.


– – ⚓ – –
Animals Seen Today
Pacific White-Sided Dolphins! Although these energetic friends caused us to abandon a trawl attempt after multiple marine mammal watches ended early because of their presence, they were so much fun to watch! I brought my DSLR camera up to the bridge deck and eventually sat down on the deck watching them jump and race through the ocean waters next to the hull. Below are some of my favorite photos I took of the pod.