Elli Simonen:  Survey Launches, July 24, 2023

NOAA Teacher at Sea

Elli Simonen (she/her)

Aboard NOAA Ship Fairweather

July 10, 2023 – July 28, 2023

Mission:  Hydrographic Survey of the Pribilof Islands 

Geographic Area of Cruise: Pribilof Islands, Alaska

Date: July 24, 2023

Weather Data

Location:  56°36.8259’N,169°32.2224’W

Outside temperature: 11°C

Water temperature: 10°C

True Winds: 16kn, 185.4°

Skies: Foggy with Drizzy Rain

Visibility: 5nmSea

Wave: 1-2 ft

Swell Wave: 1 ft

Science and Technology Log

We are currently at anchor off the north shore of Saint George Island and the survey launches are going out daily to survey a portion of the surrounding waters.  I have been on the survey launches twice, each time surveying a different area.

Survey Launch July 22, 2023

The Pribilof Islands are the breeding grounds for more than two thirds of the world’s fur seal population and their numbers peak in July.  Our surveying operations do their best not to disturb the Fur Seals.  I was on a launch that was assigned the harbor.  However, upon entering, we saw a colony of Fur Seals and had to turn back around.  We then went onto survey another area in open water.  Later that morning, the winds increased and all survey launches returned to the ship out of caution for the weather.

view over the edge of a survey launch vessel of the harbor on a small island. it's a cloudy day, and the sky, trees, and water are all shades of blue-gray. the only color comes from the bright orange life ring mounted on the vessel.

Entering the harbor at Saint George

view at a distance of fur seals swimming near the shore of St George island. the fur seals appear as small dark shapes poking out from the water. the land is covered in large gray boulders.

Fur Seals in the Saint George harbor

Survey Launch July 23, 2023

We went out to survey an area closer to shore and were out all day – a good weather day.  We surveyed using set lines; this is where survey lines are parallel and evenly spaced apart. During post survey data processing, these lines of coverage will be used to update soundings on the chart. Set lines are used in areas of shallow water where there is not much bathymetric data, such as the Pribilof Islands.  This process allows the survey team to complete a larger survey area in less time.  

Our surveying boundary close to shore is defined by the navigational area limit line (NALL), which is the distance from shore that vessels can reasonably navigate.  The other boundaries are mapped out by the survey team ensuring coverage of the entire area.  During surveying in addition to depth data, any information about features that can impact navigation need to be noted.  This can include an outcrop of rocks, shipwrecks or a kelp forest.  We did see a kelp forest close to the shoreline during this survey, and indicated that in our data.  Kelp forests can increase or decrease in size depending on the year and water temperature, but generally stay in the same place.

The swath is the width of the survey lines.  During surveying the swath gets larger as the depth increases.  In this survey, as you move away from shore the depth becomes deeper, so the width of the swath increases as well.  This is due to the fact that the MBES angle is fixed and the depth is related to the swath by the tangent function.

photo of a computer screen showing, in a large window, a map of the survey area. black lines surrounded by swaths of bright red, green, or yellow bands of color snake up and down the map, representing the transects surveyed.

Screen showing the set line spacing and data taken near the shore.

cliffs along the shore of St George, as seen from a survey launch. the water is turquoise-colored in the foreground and brownish closer to shore. tall cliffs of black, brown, and gray colors, with some green growth at higher points, rise out of the photo. there are white specks - the seabirds - all over the cliffs.

Close to the shoreline of Saint George.  The color change of the water indicates a kelp forest.  Thousands of sea birds are on the cliffs.

calculations on a whiteboard. at top is a simple depiction of a boat, labeled 'launch.' a triangle extends down from the bottom of the launch toward the seafloor. the top angle (between the lines extending from the launch) is labeled 130 degrees. arrows show the direction of the echosounder pings (labeled MBES) toward the seafloor. The height of the triangle is labeled "depth" and the base "width of the swath."
Below this image is a drawing of a right-angle triangle, one half of the above. The top angle is labeled 65 degrees (half of 130 degrees), the height is labeled "Depth" and the base is labeled "1/2 swath." 
written calculations read: tan (theta) = opposite side length / adjacent side length. tan 65 degrees = (1/2 swath)/depth. (depth)(tan 65 degrees) = 1/2 swath. 2 (depth)(tan 65 degrees) = swath. 2(depth)(~2.1) = swath, ~4.2 (depth) = swath.

How the width of the swath can be calculated.

headshot of Elli on a survey launch vessel. she's wearing a heavy jacket and a Teacher at Sea beanie. we can see St George's island in the background.

TAS Elli Simonen on a survey launch close to shore of Saint George, one of the Pribilof Islands

At the Helm of the Survey Launches

Coxswains are responsible for steering and navigating the survey launches.  They use a variety of instruments and sensors to maintain safety and guide the survey launches over the planned survey lines. The heading is the direction the bow of the ship is pointing, expressed as a degree measurement from 0° to 360°. We were mainly surveying lines that were running north-south and the heading measurement was 0° when we went north and 180° south.

a small black instrument panel showing the heading, currently 002.0 (close to 0).

Heading indicator showing the direction of the survey launch and allows for autopilot.

a compass mounted to a surface on the survey launch. it reads close to 0 N.

Magnetic Compass showing heading on the survey launches.

photo of a computer screen showing a map of the survey area

Screen for coxswains on survey launches showing depth, the water column and survey lines.

two people at the helm of the survey launch vessel. Elli grips the helm while Ashley looks on. we can see gray ocean surface out the windows. the compass is mounted to the dashboard above the helm.

TAS Elli Simonen attempting to steer the Survey Launch with NOAA Corps member ENS Ashley Howell.  It is much harder than it looks!

Personal Log

Day to Day

Most of my days have been spent on the ship or lately, on survey launches.  If I’m on the ship, I usually spend most of the day in the survey room with the survey technicians.  Breakfast is served from 7-8 am, lunch is from 11-12 pm and dinner is 5-6 pm.  Sometimes a movie is shown in the lounge in the evenings, but the other day we streamed the Women’s World Cup to see the USA win their opening game! 

Some of the common areas of the ship

view of the survey room. a large island in the center contains cabinets and a map table. computer desks line the walls. four people sit working at computers, while a fifth stands reading something.

The survey room where all the survey technicians have their work stations.

view of the galley, or kitchen, from the service bar on the outside.

The galley with lunch available

tables and chairs in the dining area. the legs of the chairs have been capped with cut open tennis balls to slow sliding during rough conditions.

The mess, where we all eat meals.

three washing machines and two dryers in the laundry room of NOAA Ship Fairweather.

Washers, dryers and soap are provided for everyone’s use.

Did You Know?

Elli Simonen: Geology, Engineering and Mapping, July 19, 2023

NOAA Teacher at Sea

Elli Simonen (she/her)

Aboard NOAA Ship Fairweather

July 10, 2023 – July 28, 2023

Mission:  Hydrographic Survey of the Pribilof Islands 

Geographic Area of Cruise: Pribilof Islands, Alaska

Date: July 19, 2023
Weather DataLocation: 57°11.82’N, 170°27.52’W

Outside temperature: 13°C

Water temperature: 11°C

True Winds: Direction 242.4°, 13.7 kn

Skies: Overcast and Foggy

Visibility: 2 nm

Sea Wave: 2 ft

Swell Wave:  Direction 240°, 4 feet height

Science and Technology Log

We have arrived at the Pribilof Islands after being en route from Kodiak for 3 days.  We are currently surveying.

Geology of the Aleutian Islands

The Aleutian islands stretch from North America into the Pacific and contain 40 active volcanoes.  This string of islands is where the Pacific Plate sinks under the North American Plate causing some of the largest earthquakes of the last 100 years.  NOAA Ship Fairweather often receives alerts about Volcanic Eruptions including information about ash in the water when sailing around the Aleutian Islands.


On July 15th at 10:48 pm, at a depth of 13 miles, a 7.2 magnitude earthquake struck just south of the Aleutian Peninsula, triggering a tsunami watch and then warning.  NOAA Ship Fairweather was in the direct vicinity, but did not feel a noticeable shake. Luckily the tsunami watch and warning were canceled shortly after, and the earthquake did not cause significant wave heights.  Investigation of observed water levels at the Sand Point, AK tide station showed some variability when compared to the tide predictions.

a photo of a graph displayed on a computer screen. The graph is titled NOAA/NOS/CO-OPS Observed Water Levels at 9459450, Sand Point AK from 2023/07/15 12:00 LST_LDT to 2023/07/16 23:59 LST_LDT. We can see that the x-axis displays time - starting at 18:00 hours on July 15, with grid marks every 3 hours until 09:00 hours on July 16. the y-axis is out of view. A dotted blue line labeled "predictions" rises smoothly to a high point around 01:30 on July 16, and then dips again. A solid red line, labeled "water levels," mostly tracks the "predictions" line but is visibly wobbly around midnight on on July 16.

Observed water levels the night of the earthquake and tsunami warning.

Video showing the Bow of NOAA Ship Fairweather sailing just south of the Aleutian Peninsula

Engineering On Board

The engineering team on NOAA Ship Fairweather consists of 8 engineers.  They are in charge of maintaining the engine, all power and water on board.  They typically work in 4-8 hour shifts, 24-hours per day, to ensure everything is running smoothly.  The ship’s two main engines power shafts that are connected to controllable pitch propellers.  To move a boat forward, both the pitch of the propellers and Revolutions Per Minute (RPM) are adjusted.  Pitch is the angle of the propeller blades and RPM is how many times the propellers rotate per minute. 

The engine room also supplies clean potable water for the entire ship.  Through the process of reverse osmosis, sea water is compressed in cylinders and salt is filtered out.  The water then goes through multi-stage and UV filters to ensure safe sanitation. 

Power is supplied by three generators and one emergency generator.  These generators power all electric, navigational and satellite receiver systems.

an engine in the engine room

One of the Engines

a tank, pipes of different sizes, a control panel

Reverse Osmosis Unit, used to make potable water from seawater

Elli, wearing her Teacher at Sea hat, stands in front of a large floor-to-ceiling control panel. Behind her there is a closed door with a yellow sign cautioning people to wear ear protection beyond that point.

TAS Elli Simonen in the Engine Room

Surveying with NOAA Ship Fairweather

We have been surveying at the Pribilof Islands for the last 1-2 days.  We are surveying using the ship and the team is on a 24 hour rotation.  The survey area is divided up into polygons, or smaller areas, of which we completely cover one at a time.  The ship drives back and forth in overlapping lines over the designated polygon.  In addition to the MBES data, we gather both backscatter and water column data as well.

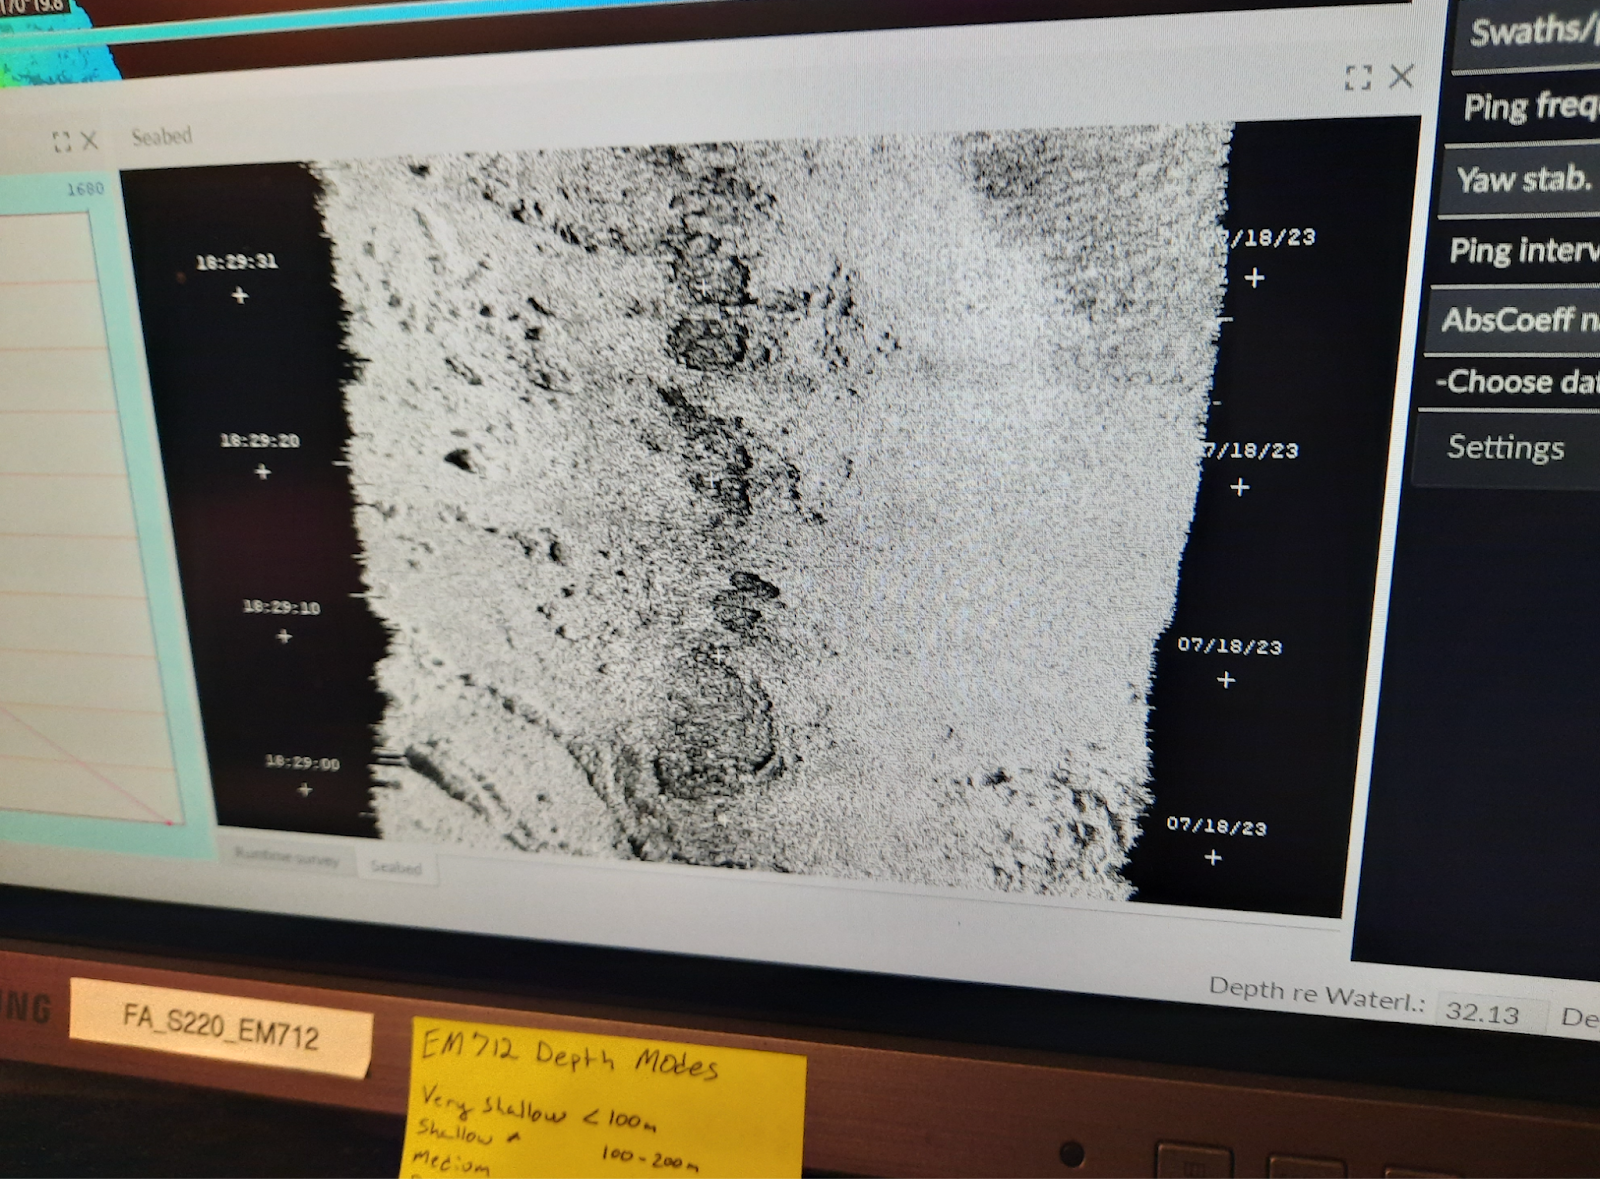
Backscatter is a visual representation of the surface of the seafloor.  Backscatter provides information about the intensity of the returned echos, from which the “hardness” of the bottom as well as other characteristics can be used to differentiate between different types of seafloor composition.  Darker colors represent harder surfaces such as rocks and hard coral and lighter colors represent softer surfaces such as sand and mud.  This information is important for ships to know for anchoring purposes, as well as benthic habitat characteristics.

The water column data shows us what is under the ship throughout the water column– from the surface of the water to the seafloor.  It detects bubbles, objects protruding from the seafloor, fish, or even a whale or a seal.

a triangular swath of echosounder data in different colors (red, green, blue) indicating the intensity of the returned echoes

Water column Data

photo of a computer screen displaying seafloor bathymetry (in black and white) from backscatter

Backscatter showing a representation of the seafloor

Finnegan and Elli sit in desk chairs in front of an array of computer monitors. There's a bookshelf filled with binders, an electrical box mounted to the wall, papers clipped to another wall. Finnegan and Elli are both wearing navy-colored NOAA logo-ed apparel.

TAS Elli Simonen with Survey Technician Finnegan Sougioultzoglou

Personal Log

Safety and Routine Checks

Before coming on board, I did not realize all the preemptive safety measures that need to be taken to ensure the health and safety of everyone on board.  The staff and crew need to be self-sustaining on all accounts; another person, equipment or supplies cannot be added mid-sail.  There are cooks onboard as well as medical staff.  There are 3 drills and situations that the entire crew participates in, including myself – Fire, Mariner Overboard and Abandon Ship.  You need to know the pattern of alarms for each, as well as where to go and what to do.  For example, for Mariner Overboard I go to the fantail of the ship, with others, and point at the person in the water until a small boat can go out and rescue them.  Each one of these drills is practiced periodically. Additionally there are two sets of rounds every hour, 24 hours a day – a deck round and engine rounds.  Deck rounds check all public spaces for anything abnormal.  Engine rounds check the engine room to see if everything is working properly.  Every week, refrigerators are checked for correct temperatures and water is checked for potential bacteria.

New Terms/Phrases

I’ve learned several acronyms and initials since I have been on board NOAA Ship Fairweather.  Sometimes I feel two consecutive sentences cannot be said without some type of abbreviation.  These are some that have become part of my vocabulary: 

  • HIC: Hydrographer in Charge
  • POD: Plan of the Day
  • SOP: Standard Operating Procedure
  • NM: Nautical Miles
  • CO: Commanding Officer

Linda Kurtz: Reflections from Fairweather, September 7, 2019

NOAA Teacher at Sea

Linda Kurtz

Aboard NOAA Ship Fairweather

August 12-23, 2019


Mission: Cascadia Mapping Project

Geographic Area of Cruise: Pacific Northwest (Off the coast of California)

Date: 9/7/2019

Weather Data from Marietta, GA:

Latitude: 33.963900
Longitude:  -84.492260
Sky Conditions:  Clear
Present Weather:  Hot
Visibility: 9 miles
Windspeed: Less than 1 knot
Temperature:  Record high 97 degrees Fahrenheit

It’s been weeks since I disembarked in Newport, Oregon and left Fairweather behind. I still feel like I’m a part of the crew since I was welcomed so seamlessly into any job I tried to learn while Teacher at Sea. However, the crew is still working away as I continue to share my experiences with my students in Marietta, Georgia.

As I have been working on lessons for my classroom, I keep finding fun facts and information about ship life that I didn’t share in my previous posts. So, here is my final post and some of my most frequent questions by students answered:

Question 1: Where did you sleep?

I slept in a berth, I had a comfortable bed, drawers, a locker, and a sink. There was a TV too, which I never watched since a) I like to read more than watch TV and b) the ship would rock me to sleep so fast I could never stay up too long at bedtime!


Question 2: What was the weather like when you were at sea?

Some days (and nights) so foggy that they had to use the fog horn for safety!


Question 3: What animals did you see?

I highlighted animals in all of my posts and linked sites to learn more, go check it out! There is one animal I didn’t include in my posts that I would like to share with you! The first is the California Sea Lion found in the Newport harbor. You could hear them from across the harbor so I had to go check them out!

See the video below:

California Sea Lions


Question 4: What happens next with the hydrographic survey work?

This is one of my favorite questions from students! It shows how much you have learned about this very important scientific work and are thinking about what is next. The hydrographic survey maps are now in post processing, where the survey technicians, Sam, Bekah, Joe, and Michelle are working hard to make sure the data is correct. I shared in a previous hydrographic survey blog an example of Fairweather’s hydrographic survey maps, I also checked in with the USGS scientists James Conrad and Peter Dartnell to see what they were doing with their research and they shared some information that will help answer this question.

From Peter Dartnell, USGS research scientist: “Here are a few maps of the bathymetry data we just collected including the area off Coos Bay, off Eureka, and a close-up view of the mud volcano. The map off Eureka includes data we collected last year. I thought it would be best to show the entire Trinidad Canyon.”

From James Conrad USGS research geologist: “Here is an image of a ridge that we mapped on the cruise. The yellow dots are locations of methane bubble plumes that mark seafloor seeps. In the next few weeks, another NOAA ship, the Lasker, is planning to lower a Remotely Operated Vehicle to the seafloor here to see what kinds of critters live around these seeps. Methane seeps are known to have unique and unusual biologic communities associated with them. For scale, the ridge is about 8 miles long.”

underwater ridge
Bathymetry map showing ridge

So, even though the research cruise is over, the research and follow up missions resulting from the research are ongoing and evolving every day.


Question 5: Would you go back if you could be a Teacher at Sea again?

YES! There is still so much to learn. I want to continue my own learning, but most importantly, lead my students to get excited about the important scientific research while keeping the mission of the NOAA close to their hearts: “To understand and predict changes in climate, weather, oceans, and coasts, to share that knowledge and information with others, and to conserve and manage coastal and marine ecosystems and resources. Dedicated to the understanding and stewardship of the environment.

Fair winds and following seas Fairweather, I will treasure this experience always.

Linda Kurtz: Hydrographic Surveys – Not your Mama’s Maps! August 17, 2019

NOAA Teacher at Sea

Linda Kurtz

Aboard NOAA Ship Fairweather

August 12-23, 2019


Mission: Cascadia Mapping Project

Geographic Area of Cruise: Northwest Pacific

Date: 8/17/2019

Weather Data from the Bridge

August 17th 2019

Latitude & Longitude: 43◦ 53.055’ N 124◦ 47.003’W
Windspeed: 13 knots
Geographic Area: @10-15 miles off of the Oregon/California coast
Cruise Speed:  12 knots
Sea Temperature 20◦Celsius
Air Temperature 68◦Fahrenheit

Future hydrographer button
Is this you?

Navigation is how Fairweather knows its position and how the crew plans and follows a safe route.  (Remember navigation from the last post?)  But what “drives” where the ship goes is Hydrographic survey mission.  There is a stunning amount of sea floor that remains unmapped, as well as seafloor that has not been mapped following a major geological event like an earthquake of underwater volcano.

Why is Hydrography important?  As we talked about in the previous post, the data is used for nautical safety, creating detailed maps of the ocean floor,  setting aside areas are likely abundant undersea wildlife as conservation areas, looking at the sea floor to determine if areas are good for wind turbine placement, and most importantly to the residents off the Pacific coast, locating fault lines — especially subduction zones which can generate the largest earthquakes and cause dangerous tsunamis.

In addition to generating the data needed to update nautical charts, hydrographic surveys support a variety of activities such as port and harbor maintenance (dredging), coastal engineering (beach erosion and replenishment studies), coastal zone management, and offshore resource development. Detailed depth information and seafloor characterization is also useful in determining fisheries habitat and understanding marine geologic processes.

The history of hydrographic surveys dates back to the days of Thomas Jefferson, who ordered a survey of our young nation’s coast.   This began the practice and accompanying sciences of the coastal surveys.  The practice of surveys birthed the science of Hydrography (which we are actively conducting now) and the accompanying science of Bathymetry (which we will go into on the next post.)  This practice continues of providing nautical charts to the maritime community to ensure safe passage into American ports and safe marine travels along the 95,000 miles of U.S. Coastline. 

Want to learn more about Hydrographic Survey history?  Click on THIS LINK for the full history by the NOAA.

Scientists have tools or equipment that they use to successfully carry out their research.  Let’s take a look at a few of the tools hydrographic survey techs use:

Want to learn more about the science of SONAR? Watch the video below.

ps://www.youtube.com/watch?v=8ijaPa-9MDs

On board Fairweather (actually underneath it) is the survey tool call a TRANSDUCER which sends out the sonar pulses.

Multibeam sonar illustration

The transducer on Fairweather is an EM 710- multibeam echo sounder which you can learn more about HERE

The Transducer is located on the bottom of the ship and sends out 256 sonar beams at a time to the bottom of the ocean.  The frequency of the 256 beams is determined by the depth from roughly 50 pings per second to 1 ping every 10 seconds.  The active elements of the EM 710 transducers are based upon composite ceramics, a design which has several advantages, which include increased bandwidth and more precise measurements. The transducers are fully watertight units which should give many years of trouble-free operation.  This comes in handy since the device in on the bottom of Fairweather’s hull!

Here is the transducer on one of the launches:

transducer
View of transducer on a survey launch

The 256 sonar beams are sent out by the transducer simultaneously to the ocean floor, and the rate of return is how the depth of the ocean floor is determined.  The rate of pulses and width of the “swath” or sonar beam array is affected by the depth of the water.  The deeper the water, the larger the “swath” or array of sonar beams because they travel a greater distance.  The shallower the water, the “swath” or array of sonar beams becomes narrower due to lesser distance traveled by the sonar beams.

The minimum depth that this transducer can map the sea floor is less than 3 meters and the maximum depth is approximately 2000 meters (which is somewhat dependent upon array size).  Across track coverage (swath width) is up to 5.5 times water depth, to a maximum of more than 2000 meters. This echo sounder is capable of reaching deeper depths because of the lower frequency array of beams. 

The transmission beams from the EM 710 multibeam echo sonar are electronically stabilized for roll, pitch and yaw, while they receive beams are stabilized for movements. (The movement of the ship) What is roll, pitch, and yaw? See below – these are ways the Fairweather is constantly moving!

Roll, Pitch, and Yaw

Since the sonar is sent through water, the variable of the water that the sonar beams are sent through must be taken into account in the data. 

Some of the variables of salt water include: conductivity (or salinity) temperature, depth, and density.

Hydrographic scientists must use tools to measure these factors in sea water, other tools are built into the hydrographic survey computer programs. 

One of the tools used by the hydrographic techs is the XBT or Expendable Bathy Thermograph that takes a measurement of temperature and depth.  The salinity of the area being tested is retrieved from the World Ocean Atlas which is data base of world oceanographic data. All of this data is transmitted back to a laptop for the hydrographers.  The XBT is an external device that is launched off of the ship to take immediate readings of the water. 

Launching the XBT:  There is a launcher which has electrodes on it, then you plug the XBT probe to the launcher and then XBT is launched into the ocean off of the back of the ship.  The electrodes transmit data through the probe via the 750-meter copper wire.  The information then passes through the copper wire, through the electrodes, along the black wire, straight to the computer where the data is collected.  This data is then loaded onto a USB then taken and loaded into the Hydrographic data processing software.  Then the data collected by the XBT is used to generate the sound speed profile, which is sent to the sonar to correct for the sound speed changes through the water column that the sonar pulses are sent through.  The water column is all of the water between the surface and seafloor. Hydrographers must understand how the sound moves through the water columns which may have different densities that will bend the sound waves.  By taking the casts, you are getting a cross section “view” of the water column on how sound waves will behave at different densities, the REFRACTION (or bending of the sound waves) effects the data.

See how the XBT is launched and data is collected below!

Videos coming soon!

The other tool is the MVP or moving vessel profiler which takes measurements of conductivity, temperature, and depth.  These are all calculated to determine the density of the water.  This is a constant fixture on the aft deck (the back of the ship) and is towed behind the Fairweather and constantly transmits data to determine the speed of sound through water.  (Since sonar waves are sound waves.)

MVP and launching wench
MVP (left) and the launching wench (right)

The sonar software uses this data to adjust the calculation of the depth, correcting for the speed of sound through water due to the changes in the density of the ocean.  The final product?  A detailed 3d model of the seafloor!

current survey area
Our current survey area! (Thanks Charles for the image!)

All of this data is run through the survey software.  See screen shots below of all the screens the hydrographers utilize in the course of their work with explanations.  (Thanks Sam!)  It’s a lot of information to take in, but hydrographic survey techs get it done 24 hours a day while we are at sea.  Amazing!  See below:

ACQ software screenshot
Hydrographic Survey “Mission Control”
HYPACK Acquisition Software
Real time coverage map

Did You Know?  An interesting fact about sonar:  When the depth is deeper, a lower frequency of sonar is utilized.  In shallower depths, a higher sonar frequency. (Up to 900 meters, then this rule changes.)

Question of the Day:  Interested in becoming a hydrographic survey tech?  See the job description HERE.

Challenge yourself — see if you can learn and apply the new terms and phrases below and add new terms from this blog or from your research to the list!

New Terms/Phrases:

Multibeam sonar

Sound speed

Conductivity

Salinity

Sonar

Sound waves

Refraction

Water column

Roll, Pitch, and Yaw

Animals seen today:

Humpback Whale

Bathymetry and USGS friends coming soon!

Plot room
Hydro-technician Sam Candio (right) collaborating with USGS Research Geologist James Conrad and Physical Scientist Peter Dartnell.

Linda Kurtz: Navigating Fair Winds and Following Seas – Fairweather Edition, August 13, 2019

NOAA Teacher at Sea

Linda Kurtz

Aboard NOAA Ship Fairweather

August 12-23, 2019


Mission: Cascadia Mapping Project

Geographic Area of Cruise: Northwest Pacific

Date: 8/13/2019

Weather Data from the Bridge

August 12th
Latitude & Longitude: 43 50.134N, 124◦49.472 W
Windspeed: 19mph
Geographic Area:  Northwest Pacific Ocean
Cruise Speed:  12 knots
Sea Temperature 20◦Celcius
Air Temperature 70◦Fahrenheit


Science and Technology Log

Yesterday, we embarked on this Hydrographic Survey Project, leaving Newport and heading out to the Pacific Ocean.  The 231-foot Fairweather is manned by 35 people and they are all essential to making this research run smoothly, keeping the ship on course, maintaining the ship, and feeding all of us!  Why is this Hydrographic survey mission important?  We’ll take a “deep dive” into hydrographic surveys in an upcoming blog, but there are several overlapping reasons why this research is important.  On previous hydrographic maps of the sea floor, there are “gaps” in data, not giving scientists and mariners a complete picture of this area.  The data is used for nautical safety, setting aside areas where there are likely abundant undersea wildlife as conservation areas, looking at the sea floor to determine if areas are good for wind turbine placement, and most importantly to the residents off the Pacific coast, locating fault lines –especially subduction zones, which can generate the largest earthquakes and cause dangerous tsunamis.  More about this and the science of Hydrography in a later post.  For now, we’ll focus on Navigation.


Science Word of the day:  NAVIGATION

The word NAVIGATION is a noun, defined: the process or activity of accurately ascertaining one’s position and planning and following a route.

synonyms: helmsmanship, steersmanship, seamanship, map-reading, chart-reading, wayfinding. “Cooper learned the skills of navigation.”


Time to leave port: 12:30 pm August 12th

As we were pulling away from the dock and headed out of Newport, someone was navigating this very large ship through narrow spaces, avoiding other boats, crab traps, and other hazards, and I began wondering… who is driving this ship and what tools do they have to help them navigate and keep us safe?  Navigation is the science of “finding your way to a specific destination.”  So, I made way to the bridge to find out. There was so much to learn, and the bridge crew was very patient taking me through who worked on the bridge as well as the various tools and technological resources they used to guide the Fairweather exactly where it needed to be.  First the humans who run the ship, then the tools!

On the bridge you have 3 key members in charge of navigation and steering the boat.  These are not to be confused with the CO or Commanding Officer who always oversees the ship but may always not always be present on the bridge (or deck). The CO is kind of like a principal in a school (if the school were floating and had to avoid other buildings and large mammals of course.) 

 1st in charge of the bridge watch is the OOD or Officer of the Deck.   The OOD is responsible for making all the safety decisions on the deck, giving commands on how to avoid other vessels and wildlife such as whales!  The OOD oversees the deck and reports regularly to the CO as needed. 

2nd in charge of the bridge watch is the JOOD or Junior Officer of the Deck.  The Junior Officer is responsible to the CO and OOD and uses both technology driven location data and plot mapping with paper to locate the position of the ship and use that location to plan the course for the ship.

The 3rd member of the bridge team is the helmsman.  The helmsman is the person who is actually driving the ship while following the commands of the OOD and JOOD.  Tools the helmsman uses include magnetic compasses on deck and electronic heading readouts to adjust course to stay on a particular heading (or direction of travel.)  The helmsman has another duty as lookout.  The lookout watches the ocean in front of the ship for land objects (we saw a lighthouse today), ocean mammals such as whales (we’ve seen 3 so far) or debris in the ocean so Fairweather can navigate around them.

Kevin Tennyson
Officer of the Deck (OOD): Kevin Tennyson
Calderon and Ostermyer
Junior Officer of the Deck (JOOD) Jeff Calderon and Helmsman Terry Ostermyer


There are so many devices on the bridge, I’ll share a few of them and their functions.  This blog post would take DAYS to read if we went over them all!

Let’s explore: what tools does the crew aboard Fairweather use for NAVIGATION?

Radar is a system that uses waves of energy to sense objects. These waves are in the form of high frequency radio waves which can find a faraway object and tell how fast it is moving. 

Radar is very useful because it can sense objects even at night and through thick clouds.   Radar helps the Fairweather navigate by detecting objects and vessels in the immediate area.  On Fairweather, you can see the objects that are near or could be in the determined path of travel.

RADAR
RADAR showing other watercraft and objects that could come into contact with Fairweather, for safe NAVIGATION.
Close up of RADAR
Close up of RADAR screen showing blue lines (indicative of speed) trailing other detected objects

While the picture above shows where the objects and vessels are, the “blue trail” shows how far they have traveled in 6 minutes.  A longer blue trail means a faster moving vessel and a shorter or no tail means little or no movement.  This tool also helps the Fairweather crew determine the path of travel of the other vessels so they can either navigate around or warn the other vessel of the Fairweather’s heading. 

Fairweather bridge crew also must follow what STEM students call the 4C’s: Communication, Collaboration, Critical Thinking, & Creativity.

To communicate while at sea, the crew must communicate via radio.

radio
Communication is essential for safe navigation.

Notice the abbreviations for the MF/HF or Medium Frequency/High Frequency, which has the longest range and you can communicate via voice or text. VHF or Very High Frequency are voice radios only.  Marine VHF radios work on a line-of-sight basis. That is, they can transmit and receive to and from another antenna as long as that antenna is above the horizon. How far is that? Standing on the bridge of a ship, the distance to the horizon is usually about 10-12 miles.  So, if there is a vessel within that 10-12 mile or so range, the Fairweather crew can communicate with them via the VHF radio.


Weather Tools:

It is crucial to gather weather data and analyze the information from various weather instruments onboard to keep the Fairweather safe. Sopecreek Elementary has a Weather Station too!  As you look through the photos below, see if you can find what weather instruments (and readings) Fairweather uses and compare and contrast with Sopecreek’s WEATHER STEM station!  What type of instruments do you think are the same, and which are different?

Weather Data
Data from the bridge on Day 2
Weather Data Time Series
weather data updates
Weather data updates – the ship can NAVIGATE to avoid dangerous weather


With all of tools discussed above, the Fairweather is approaching the Cascadia Margin that needs to be surveyed using science of Hydrography and Bathymetry (more about those concepts coming soon!)

The area to be survey has already been identified, now the ship must approach the area (the red polygon in the middle of the screenshot below).  Now the crew must plot a course to cover the area in horizontal “swaths” to aid in accurate mapping.  The bridge and the hydrographic survey team collaborate and communicate about speed, distance between horizontal lines, and timing of turns. 

See the initial area to mapped and the progress made in the first two days in the pictures below!

Cascadia Margin chart
Cascadia Margin: 1st Region the Fairweather is mapping
mapping progress
Progress mapping – navigation the survey area – colored lines indicate where the ship has been


Personal Log

It’s been a great start to this Teacher at Sea adventure!  There is so much to take in and share with my students (I miss you so much!) and my fellow teachers from across the country!  Today, we went from sunny skies and calm 2-4 foot seas, to foggy conditions and 6-8 foot seas!  The ship is definitely moving today!  I keep thinking about STEM activities to secure items and then testing against the varying degree of pitch on the ship!  For safety, the entire crew is tying up any loose items and securing all things on board, we’ll have to think of STEM challenges to simulate this for sure! 


Did You Know?

When steering a ship, an unwritten rule is you don’t want the speed of the ship (in KNOTS) and the degree of the turn of the rudder (in DEGREES) to exceed the number 30! 


Question of the Day: 

How many possible combinations of KNOTS and DEGREES are there? Can you draw or plot out what that would look like?


New Terms/Phrases:

Thermosalinigraph:  Measures the temperature and salinity of the water.

Challenge yourself: see if you can learn and apply the terms below and add new terms from this blog or from your research to the list!

ECDIS:  Electronic chart display information system

Longitude and Latitude

True North

Magnetic North


Animals Seen Today:

Dall’s Porpoise

Humpback Whale

Curious about STEM Careers with NOAA?  All the officers on deck had a background in some type of science but none were the same.  Everyone on board comes from different backgrounds but are united by the OJT (On the Job Training) and the common purpose of the hydrographic survey mission.   Learn more here:  https://www.noaa.gov/education