Nick Lee: First Days at Sea, July 2, 2024

NOAA Teacher at Sea

Nick Lee

Aboard NOAA Ship Oscar Dyson

June 29 – July 20, 2024

Mission: Pollock Acoustic-Trawl Survey

Geographic Area of Cruise: Eastern Bering Sea

Date: July 2, 2024

Weather Data from the Bridge:

Latitude: 59° 54.8 N
Longitude: 171° 54.9 W
Wind Speed: 14 knots
Air Temperature: 5.0° Celsius (41° F)

Science and Technology Log:

We’ve been sailing for just under two days, and I’ve already had an opportunity to witness lots of science aboard NOAA Ship Oscar Dyson

We spent the first day transiting to the start of the survey – I am part of Leg 2 for this cruise, and so we are picking up where Leg 1 left off. Since we won’t be able to find every pollock in the Bering Sea, we will need to rely on a representative sample, and then our data will be used to estimate the total stock.

The map below shows the intended path of our cruise, and the vertical lines represent transects, or lines along which we will collect data, spaced 40 nautical miles (or 74 km) apart so that we can cover the entire region with the time we have. Since we just recently arrived at the start of our survey, I’m still learning about the different data the science team will be collecting – more on that in a future blog post!

nautical chart of the Bering Sea, showing the land of Alaska to the east and a portion of Russia in the northwest. The cruise trajectory is overlaid in bold blue or red lines, with north-south transects connected by shorter westward connections. The blue transects start in Dutch Harbor and head west; the red transects are farther west
Map of the survey with the portion that I’ll be participating in shown in red, and the portion that has already been completed in blue.

On our way to our survey site, I was able to launch a drifter buoy through NOAA’s Adopt-a-Drifter Program. Unlike some other buoys, a drifter buoy is not fixed to the ocean floor. Instead, they float and “drift” with the ocean currents. Importantly, drifters are equipped with some sort of drogue – an underwater anchor. This way, the surface float (and the drogue) will move with ocean currents, but won’t be influenced as much by wind.

illustrated diagram of a drifter buoy. a white ball floats at the water line; this is labeled "Surface float - designed for moving on the surface with currents." The float has an Antenna, labeled: "the drifters transmit the data they collect as well as their position via satellite." Data is depicted as a gray triangle extending up from the antenna to a satellite in the sky, which is communicating with a satellite dish on land. Beneath the float, down into the water, extends a black cable, thicker toward the float. It's labeled: "Sensors: Sea Surface Temperature sensor and various measuring systems." The cable connects to what appears to be gray cylindrical tube, waving in the water labeled "Drogue: The buoys have some form of subsurface drogue or sea anchor."
Drifter Buoy diagram (Image Credit: NOAA Adopt a Drifter Program)

Deploying a drifter is as simple as dropping it into the ocean! I was able to deploy our first drifter last night off the stern (back of the ship). Our drifter was wrapped in biodegradable packaging for a safe deployment, but once in the water it should have opened up and extended to its full length.

a repeating video clip of Nick starting to toss the drifter buoy over the rail of NOAA Ship Oscar Dyson. he is wearing a helmet and a life vest, and looking away from the camera.
Deploying an ocean drifter.

Once deployed, the drifter transmits its location via satellite, and scientists are able to use this data to better understand ocean currents. You can track my drifter’s trajectory here!

In addition to a GPS that tracks location, drifters are often equipped with sensors for temperature, pressure, salinity, and more. Below is the path my drifter took in its first day after deployment, and the sea temperatures it encountered.

a map of a small section of the ocean between 191.2 to 192.0 degrees W and 55.4 to 56.2 degrees N. A series of colored squares form a small spiral in the middle; the squares range in color from orange to purple. Beneath the map there's a key explaining that the colors indicate temperature, ranging from purple (6 degrees Celsius) to red (7 degrees Celsius.)
Drifter trajectory and sea surface temperature.

I also was able to observe the deployment of a CTD (conductivity, temperature, and depth) sensor. CTD measure some of the same properties as drifters, but CTDs are lowered down into the water and then raised back into the boat. This means that CTDs only collect data at one geographic location at a time, however, they collect data throughout the entire water column, from the surface down to the ocean floor (~80 meters at our last deployment). CTDs can also collect water samples at different depths, allowing scientists to study them further. NOAA has a great resource on CTDs here!

view of the conductivity, temperature, and depth probe (in the center of a cylindrical metal apparatus) suspended from a cable just beyond the railing of the ship; it is about 10 feet above the ocean's surface at this point. in the distance, the sky is gray and cloudy, and the ocean is gray and calm.
CTD being lowered to collect data.

Personal Log:

When I applied to NOAA’s Teacher at Sea Program, I was told that one thing that was required of all its participants was flexibility. This is especially true for cruises leaving from Dutch Harbor, where bad weather and flight cancellations are common. On this leg, a series of travel delays meant that we left port a day later than expected. However, this meant that I was able to spend some time exploring Dutch Harbor!

Dutch Harbor is one of the most remote and beautiful places I’ve ever visited. During my wanderings around the town, I spotted whales, a fox, and plenty of bald eagles. Alaska’s military history is also apparent in the hills surrounding Dutch Harbor, which are full of World War II bunkers.

Since we left port, there’s been a lot to adjust to about living on a ship. The ship is a bit of a maze – lots of narrow hallways and hidden staircases. After making a lot of wrong turns, I’m starting to get a sense of the layout.

Work happens on the ship at all hours of the day – I’ve been assigned the night shift (4 pm – 4 am), so as a natural morning person, I’ve completely changed my sleep schedule! Because someone is always working, that also means that someone is always trying to sleep, so I’ve learned to be careful about not letting doors slam behind me.

view of a stateroom: two berths (bunk beds), a chair, a window with curtains, a hiking backpack and a bag.
My stateroom for the next three weeks.

This morning, we practiced our first set of safety drills. To simulate what would happen if we needed to abandon ship, everyone was required to don a survival suit (also called a “Gumby suit”). It was quite a process to put on the suit – luckily one of the other scientists, Mike, gave me some pointers ahead of time!

Nick poses, thumbs up, for a photo in the survival suit; it covers his mouth and nose
Gumby suit

I’m looking forward to learning more about life at sea over the next few weeks!

Did You Know?

NOAA Ship Oscar Dyson was named after an Alaskan fisherman and activist who worked to improve the industry for other Alaskans (https://www.omao.noaa.gov/marine-operations/ships/oscar-dyson )

Germaine Thomas: Meet the Teacher at Sea on NOAA Ship Oscar Dyson, August 9, 2023

NOAA Teacher at Sea

Germaine Thomas (she/her)

Aboard NOAA Ship Oscar Dyson

August 7 – August 21, 2023

Mission: Acoustic Trawl Survey (Leg 3 of 3)
Geographic Area of Cruise: Pacific Ocean/ Gulf of Alaska
Date: Wednesday, August 9, 2023

Weather Data
Lat 58.16 N, Lon 148.97 W
Sky condition: Cloudy
Wind Speed: 2.88 knots
Wind Direction: 301.28°
Air Temp: 12.44 °C

Personal Log

School will soon be starting in Anchorage at Bettye Davis East High School. I will not be in school for the first three days because I am having fun on a teacher’s field trip. Good things come to those who apply for it. I applied and got accepted on this cruise before the pandemic, but life and safety concerns made my journey about three years longer. Finally, I am living the dream and out in the Gulf of Alaska surrounded by pure ocean, whales, seabirds and catching lots of fish.

selfie of Germaine on a kayak (too close to see the kayak, but we can see she's surrounded by water, with some forested shoreline beyond.) she wears a life jacket, sunglasses, baseball cap. A small white dog peers over her left shoulder.
Kayaking in Prince William Sound with Loki the dog. My family commercial fishes for Sockeye Salmon in Main Bay.

My name is Germaine Myerchin Thomas. I was born and raised in Ketchikan Alaska. I am the daughter of a fishermen and a teacher. I, myself, am a teacher, and I commercial fish in Prince William Sound. So far I have spent most of my summer fishing in the Eshamy district about 45 miles outside of Whittier. It has been a cold dark wet summer( the word “summer” is debatable). Recently, I jumped from Set Net fishing for Sockeye (Red) Salmon, in small open skiffs, to the fabulous NOAAS Oscar Dyson.

Just visualize the ice sculptures, swimming pool and yoga studio on the Lido Deck… nope! The NOAAS Oscar Dyson is a research vessel that you can find more about by clicking the link above. Currently there are 24 crew members and 8 scientists. The ship is outfitted to conduct an acoustic trawl survey, but there are other scientific projects going on during this leg of the cruise. It, also has great food and two gyms. The waves rolling under the hull of the boat make the feel of gravity extra strong while trying to do push ups.

Already I have discovered that working out in the ocean requires being very flexible and adaptable. Sometimes the weather or wildlife can delay setting out the trawl net. Last night the boat was surrounded by whales (Fin and Sei), marine birds (Fulmars, Shearwaters and Black footed Albatross) all enjoying the abundant fish that we wanted to catch in our trawl net. Naturally we just let the animals enjoy the abundance while the scientist patiently waited for their turn in another area.

When the cruise ends I will head back to Anchorage and teach high school, chemistry, oceanography, and marine biology. I am really looking forward to meeting my students for the first time. I hope that I might be able to Zoom into my classroom and share what I am doing while I am out here.

Germaine Thomas: The Adventure Begins Aboard NOAA Ship Oscar Dyson, August 7, 2023

NOAA Teacher at Sea

Germaine Thomas (she/her)

Aboard NOAA Ship Oscar Dyson

August 7 – August 21, 2023

Mission: Acoustic Trawl Survey (Leg 3 of 3)
Geographic Area of Cruise: Pacific Ocean/ Gulf of Alaska
Date: Monday August 7, 2023

Weather Data
Lat 58.31 N, Lon 151.58 W
Sky condition: cloudy
Wind Speed: 12.43 knots
Wind Direction: 357.55°
Sea Wave height: 1 ft | Swell: 340°, 1-2 ft
Air Temp: 12.35 °C

Science log

The purpose of this trip is acoustic trawl sampling for pollock (Gadus chalchogrammus). There are other projects that people are working on during this leg that I will report on in other upcoming blogs.

Today, at about 5:30 pm we deployed a CTD (Conductivity, Temperature and Depth – Probe). This probe measures the salinity using conductivity, the temperature with a digital thermometer, and records the data all at different depths in the water column. This CTD also records fluorescence which is an easy way to determine the amount of plankton present. The plankton at the surface are producers and have chlorophyll, which reacts to fluorescence and can be recorded. This information will be important when we start taking trawl samples, so the ships crew will routinely send out the CTD while we cover our transects.

Watch the videos below of the crew members deploying and recovering the CTD.

Crew members deploying the CTD
Recapturing the CTD

The data from the CTD collection are shown on the picture of the computer screen below:

a photo of a computer monitor showing a screen with three graphs in a row. The first depicts fluorescence (indicating chlorophyll levels) and turbidity v. depth. Chlorophyll levels start out high toward the surface but asymptote toward zero as the probe travels deeper. The central graph is blank. The third depicts salinity and temperature v depth. Salinity stays largely constant, but it does gradually increase with depth. Temperature is higher toward the surface, declines quickly and then slowly with depth.
CTD Data: Fluorescence, or Chlorophyll (green) and Turbidity (orange) v. Depth on the first graph, and Salinity (yellow) and Temperature (blue) v. Depth on the third graph.

The data from the CTD are presented in graphical form. The first frame shows chlorophyll, which is the green line. The second frame is percent oxygen (which they were not measuring so it remains zero). The third frame shows salinity (yellow line) and water temperature (blue line).

Personal log

Currently we are cruising out to our transect destinations over the continental shelf. The seas are a little rough (6-8 foot waves) and I am enjoying some saltine crackers that help with mild sea sickness.  It has been a while since I have been in a large boat in rolling seas.

Three days ago, I flew from Anchorage to Kodiak Island on an a sunny afternoon and met the science team for the cruise. The whole team was extremely welcoming, sharing stories of past cruises, colorful characters and the science behind acoustic trawl sampling. Later, they invited me to go surfing the next day at a beach on the far side of the island.

Through the camaraderie of playing in the waves I was introduced to these amazing people and their knowledge and love of the ocean. They are very professional and willing to share what they are studying.  They also have a deep concern for the changes occurring in the ocean and honestly hope that their information can be shared and understood in order to mitigate the impact of change.  Sitting on my surfboard I quickly learned I was the beginner, and they were the experts. With the experience of time, they would effortlessly snap up and slice through the waves.  Smiles and whoops encouraged each other as the sea crashed into the beach.

Four surfers sit on surfboards, facing away from the camera, awaiting the next wave. Beyond the surfers we see a line of mountains. The image is a color palette of grays: gray cloudy sky, gray ocean, dark gray-blue mountains.
Surfing off of Kodiak Island. Photo credit: Mathew Phillips
A surfer rides a wave back toward shore. We can see a mountain, part of Kodiak Island, behind the surfer. Both the sky and the ocean are gray.
Surfing off of Kodiak Island. Photo credit: Mathew Phillips

Surf photos courtesy of Mathew Phillips

The next day was spent with the science crew getting ready to bring aboard equipment they will be using, accessing and streamlining the information they need for the data collection, and also a little bit more shore time with fishing and hiking. I hiked up a local mountain called Pyramid.

Overall this has been a great start for a wonderful trip. I love to get my students outside experiencing the real world. After a year of taking both Oceanography and Marine Biology my students get to touch, see and smell the ocean through a field trip. They get to see marine birds and mammals, touch and taste icebergs and smell the brine scent of the ocean. They also get a chance to apply the knowledge and skills that they have learned in my class. The NOAA as Teacher at Sea Program is my field trip. I get to see the science and technology in action and share it with my students, friends and family. Thanks so much for letting me play!

Elli Simonen: Geology, Engineering and Mapping, July 19, 2023

NOAA Teacher at Sea

Elli Simonen (she/her)

Aboard NOAA Ship Fairweather

July 10, 2023 – July 28, 2023

Mission:  Hydrographic Survey of the Pribilof Islands 

Geographic Area of Cruise: Pribilof Islands, Alaska

Date: July 19, 2023
Weather DataLocation: 57°11.82’N, 170°27.52’W

Outside temperature: 13°C

Water temperature: 11°C

True Winds: Direction 242.4°, 13.7 kn

Skies: Overcast and Foggy

Visibility: 2 nm

Sea Wave: 2 ft

Swell Wave:  Direction 240°, 4 feet height

Science and Technology Log

We have arrived at the Pribilof Islands after being en route from Kodiak for 3 days.  We are currently surveying.

Geology of the Aleutian Islands

The Aleutian islands stretch from North America into the Pacific and contain 40 active volcanoes.  This string of islands is where the Pacific Plate sinks under the North American Plate causing some of the largest earthquakes of the last 100 years.  NOAA Ship Fairweather often receives alerts about Volcanic Eruptions including information about ash in the water when sailing around the Aleutian Islands.


On July 15th at 10:48 pm, at a depth of 13 miles, a 7.2 magnitude earthquake struck just south of the Aleutian Peninsula, triggering a tsunami watch and then warning.  NOAA Ship Fairweather was in the direct vicinity, but did not feel a noticeable shake. Luckily the tsunami watch and warning were canceled shortly after, and the earthquake did not cause significant wave heights.  Investigation of observed water levels at the Sand Point, AK tide station showed some variability when compared to the tide predictions.

a photo of a graph displayed on a computer screen. The graph is titled NOAA/NOS/CO-OPS Observed Water Levels at 9459450, Sand Point AK from 2023/07/15 12:00 LST_LDT to 2023/07/16 23:59 LST_LDT. We can see that the x-axis displays time - starting at 18:00 hours on July 15, with grid marks every 3 hours until 09:00 hours on July 16. the y-axis is out of view. A dotted blue line labeled "predictions" rises smoothly to a high point around 01:30 on July 16, and then dips again. A solid red line, labeled "water levels," mostly tracks the "predictions" line but is visibly wobbly around midnight on on July 16.

Observed water levels the night of the earthquake and tsunami warning.

Video showing the Bow of NOAA Ship Fairweather sailing just south of the Aleutian Peninsula

Engineering On Board

The engineering team on NOAA Ship Fairweather consists of 8 engineers.  They are in charge of maintaining the engine, all power and water on board.  They typically work in 4-8 hour shifts, 24-hours per day, to ensure everything is running smoothly.  The ship’s two main engines power shafts that are connected to controllable pitch propellers.  To move a boat forward, both the pitch of the propellers and Revolutions Per Minute (RPM) are adjusted.  Pitch is the angle of the propeller blades and RPM is how many times the propellers rotate per minute. 

The engine room also supplies clean potable water for the entire ship.  Through the process of reverse osmosis, sea water is compressed in cylinders and salt is filtered out.  The water then goes through multi-stage and UV filters to ensure safe sanitation. 

Power is supplied by three generators and one emergency generator.  These generators power all electric, navigational and satellite receiver systems.

an engine in the engine room

One of the Engines

a tank, pipes of different sizes, a control panel

Reverse Osmosis Unit, used to make potable water from seawater

Elli, wearing her Teacher at Sea hat, stands in front of a large floor-to-ceiling control panel. Behind her there is a closed door with a yellow sign cautioning people to wear ear protection beyond that point.

TAS Elli Simonen in the Engine Room

Surveying with NOAA Ship Fairweather

We have been surveying at the Pribilof Islands for the last 1-2 days.  We are surveying using the ship and the team is on a 24 hour rotation.  The survey area is divided up into polygons, or smaller areas, of which we completely cover one at a time.  The ship drives back and forth in overlapping lines over the designated polygon.  In addition to the MBES data, we gather both backscatter and water column data as well.

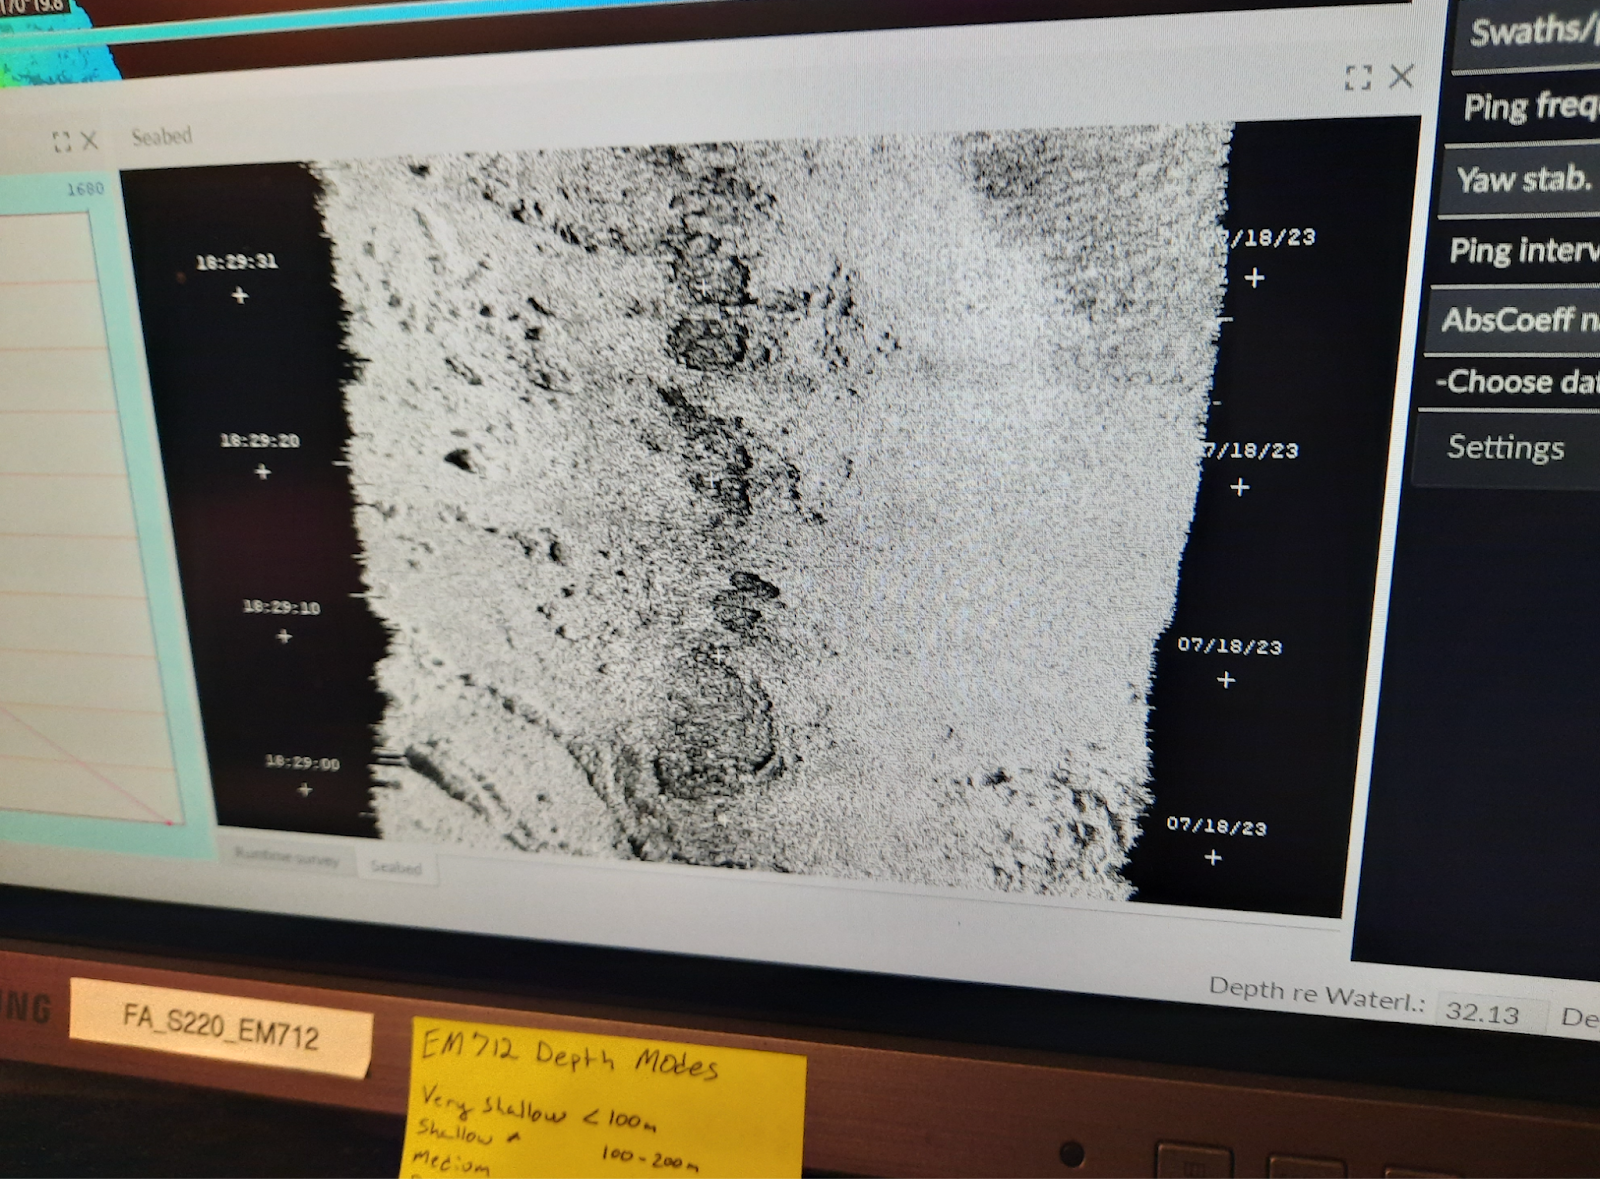
Backscatter is a visual representation of the surface of the seafloor.  Backscatter provides information about the intensity of the returned echos, from which the “hardness” of the bottom as well as other characteristics can be used to differentiate between different types of seafloor composition.  Darker colors represent harder surfaces such as rocks and hard coral and lighter colors represent softer surfaces such as sand and mud.  This information is important for ships to know for anchoring purposes, as well as benthic habitat characteristics.

The water column data shows us what is under the ship throughout the water column– from the surface of the water to the seafloor.  It detects bubbles, objects protruding from the seafloor, fish, or even a whale or a seal.

a triangular swath of echosounder data in different colors (red, green, blue) indicating the intensity of the returned echoes

Water column Data

photo of a computer screen displaying seafloor bathymetry (in black and white) from backscatter

Backscatter showing a representation of the seafloor

Finnegan and Elli sit in desk chairs in front of an array of computer monitors. There's a bookshelf filled with binders, an electrical box mounted to the wall, papers clipped to another wall. Finnegan and Elli are both wearing navy-colored NOAA logo-ed apparel.

TAS Elli Simonen with Survey Technician Finnegan Sougioultzoglou

Personal Log

Safety and Routine Checks

Before coming on board, I did not realize all the preemptive safety measures that need to be taken to ensure the health and safety of everyone on board.  The staff and crew need to be self-sustaining on all accounts; another person, equipment or supplies cannot be added mid-sail.  There are cooks onboard as well as medical staff.  There are 3 drills and situations that the entire crew participates in, including myself – Fire, Mariner Overboard and Abandon Ship.  You need to know the pattern of alarms for each, as well as where to go and what to do.  For example, for Mariner Overboard I go to the fantail of the ship, with others, and point at the person in the water until a small boat can go out and rescue them.  Each one of these drills is practiced periodically. Additionally there are two sets of rounds every hour, 24 hours a day – a deck round and engine rounds.  Deck rounds check all public spaces for anything abnormal.  Engine rounds check the engine room to see if everything is working properly.  Every week, refrigerators are checked for correct temperatures and water is checked for potential bacteria.

New Terms/Phrases

I’ve learned several acronyms and initials since I have been on board NOAA Ship Fairweather.  Sometimes I feel two consecutive sentences cannot be said without some type of abbreviation.  These are some that have become part of my vocabulary: 

  • HIC: Hydrographer in Charge
  • POD: Plan of the Day
  • SOP: Standard Operating Procedure
  • NM: Nautical Miles
  • CO: Commanding Officer

Elli Simonen: Welcome to Alaska, July 12, 2023

NOAA Teacher at Sea

Elli Simonen (she/her)

Aboard NOAA Ship Fairweather

July 10, 2023 – July 28, 2023

Mission:  Hydrographic Survey of the Pribilof Islands 

Geographic Area of Cruise: Pribilof Islands, Alaska

Location (In Port): 57⁰43.8384’N, 152⁰30.8319’W

Date: July 12, 2023

Hi Everyone, my name is Elli and this week, I arrived in Kodiak, Alaska and right now I am aboard NOAA Ship Fairweather.  This is my first time in Alaska as well as my first time being on a scientific research ship.  I teach high school Mathematics, specifically Algebra 1, Algebra 2 and AP Calculus at Special Music School, a public school located in New York City.  I also instruct two classes at the College and Graduate level as an adjunct lecturer at City College and Hunter College. My high school students are musically gifted and many go onto Music Conservatory Education.  I am constantly in awe of their talent, grit and perseverance in pursuit of becoming better musicians.  My students at the college and graduate levels are all learning how to be educators in the New York City school system.  Their sense of purpose, commitment and openness to new ideas is inspiring.

a view of Elli, from the shoulders up, on the deck of NOAA Ship Fairweather. In the background, we see another ship, water, and steep green hills rising beyond the far side of the port. Elli is wearing her NOAA Teacher at Sea hat, which gives away that this image has been reversed - the logo and the writing are backward.

Elli aboard NOAA Ship Fairweather

I am a Math for America (MfA) Master Teacher and first heard of the NOAA Teacher at Sea Program (TAS) in 2019 through MfA – I researched the TAS program, and thought this is something I definitely want to do, and applied.  I was accepted in the 2020 cohort, but because of COVID was rolled over to 2023 so here I am, three and a half years later embarking on a hydrographic survey of the Pribilof Islands.  


I have been teaching math for 20 years and at various points have had experiences learning about the oceans and marine life.  I started my career as a Peace Corps Volunteer and lived in Zanzibar, Tanzania for 2 years.  In addition to teaching math, I was able to take students to study the coral reefs that surround the island through the Chumbe Environmental Education Program.  They snorkeled, learned about coral and how to preserve and protect this environment.  I also like to scuba dive and have completed over 90 dives at various places around the world– learning not only about shoreline habitat at each diving spot I visited, but how different facets of the ocean interact.  In 2019, I was awarded a Fund for Teachers Grant where I traveled to Australia, scuba dived and learned first hand about the Great Barrier Reef.  And now, I’m still on a journey to learn more about the world’s oceans and marine environments, this time with NOAA in the waters around Alaska.

view of a diver (Elli) underwater in front of a coral head. sand and coral all appear with a blue-green tint. In the foreground, swimming closer to the photographer than Elli is, is a fish, perhaps a kind of grouper. It is the focus of the photo.

​Elli scuba diving on the Great Barrier Reef, Australia​

So, what is a hydrographic survey you might ask?  And where are the Pribilof Islands?  The Pribilof Islands are four volcanic islands about 300 miles west of mainland Alaska in the south Bering Sea and about 250 miles north of the Aleutian Islands; the two largest islands are Saint Paul and Saint George.  A Hydrographic survey uses sonar data to interpret the ocean floor and coastlines which then is used to produce Nautical charts. The Pribilof Islands Hydrographic Survey will map the ocean floor and surrounding coastline to provide updated accurate charts of this area. The Pribilof Islands have not been mapped since the 1950’s.  


I will be onboard NOAA Ship Fairweather.  The ship embarks in Kodiak, Alaska and disembarks in Dutch Harbor, Unalaska, Alaska.  I am very much looking forward to spending time with the Science team on NOAA Ship Fairweather and learning about what everyone does on a NOAA ship.  I plan on taking this information back with me to New York City and bringing this real-world research experience into my classroom.

NOAA Ship Fairweather at a dock; the dock, a building, and a line of trees are visible beyond. This photo was taken at some distance across the water, capturing the full length of the ship. We can see one survey launch vessel in the water adjacent to the ship. Another remains mounted on board.

NOAA Ship Fairweather

Did you know?

  • NOAA has three different types of Scientific research ships: Hydrographic surveys, Fisheries survey and Oceanographic research
  • Since 1990, the TAS program has sailed more than 850 teachers aboard their ships.  Teachers have come from every state and 4 territories.  (For any fellow teachers reading this, TAS has cohorts every year and applications are due in the Fall.)
  • Each summer more than a million northern fur seals arrive at the Pribilof Islands to breed and raise their young, representing the largest gathering of sea mammals in the world. (https://www.travelalaska.com/Destinations/Cities-Towns/Pribilof-Islands)
  • About 230 fishing vessels take shelter on the southwest shore of St. George during Crabbing Season.