Martha Loizeaux: Sea You Soon, August 30, 2018


Martha Loizeaux: Sensational Satellites, August 29, 2018

NOAA Teacher at Sea
Martha Loizeaux
Aboard NOAA Ship Gordon Gunter
August 22-31, 2018
 
Mission: Summer Ecosystem Monitoring Survey
Geographic Area of Cruise: Northeast Atlantic Ocean
Date: August 29, 2018
 
Weather Data from the Bridge


  • Latitude:  39.115 N
  • Longitude:  74.442 W
  • Water Temperature: 26.4C
  • Wind Speed:  11.7 knots
  • Wind Direction: SW
  • Air Temperature: 28.2C
  • Atmospheric Pressure:  1017.03 millibars
  • Depth:  22 meters


Science and Technology Log
 
Today I was excited to learn more about the work of Charles Kovach, Support Scientist with Global Science and Technology, a contractor to NOAA Center for Satellite Applications and Research (STAR).
 
Charles’s work may sound familiar.  It is a bit similar to the work I wrote about yesterday that Audrey and Kyle are doing with the University of Rhode Island.  He wants to match what satellite pictures are seeing to what is really here in the ocean. 
 

Charles has another cool tool called a “hyperspectral profiler” or hyperpro for short.  He can put this tool into the water to measure light at the surface, light coming down through the water, and light bouncing back up from the deep.  He wants to know how the sunlight changes as it goes down into the deep and back up through the water.  The hyperpro measures thousands of different colors as they travel through the water. Seeing what colors bounce back from the water can help you understand what is IN the water.  For example, you can see some of this with your own eyes.  Blue water is usually clean and clear, green water has a lot of algae, and brown water has a lot of particles like sand or dirt.  But the hyperpro gets A LOT more detail than just our eyes. 

Martha hyperpro computer
Me assisting with the hyperpro deployment. I had to read the computer program and alert Charles regarding the depth of the instrument.
Charles hyperpro
Charles deploying the hyperpro
 
The main purpose of this is to understand what satellites are seeing.  We can get images from satellites out in space, like a picture of the ocean.  But the satellite is outside of our atmosphere so it is seeing light that has gone through a lot of air and gases as well as the ocean.  So when scientists can measure the light in the ocean at the same time that the satellite is taking a picture, they can use MATH to find a relationship between what the satellite sees and what is really happening on Earth.  In this way, Charles can calibrate (make more accurate) and validate (make sure it is right) the satellite images. 
 
This is helpful information for A LOT of people all over the world.  Scientists are pretty good at collaborating because they know how important it is to share information with everyone so we can all be more aware of what is happening in our natural world.  Charles collaborates with other countries and their satellites, as well as NOAA’s satellites. 
 
Charles also collaborates with other scientists on the ship and in NOAA’s laboratories.  This way he can compare his light data to other measurements such as chlorophyll (remember?  It’s from phytoplankton!), turbidity, and even specific species of plankton.  Then he can find relationships between things like the light and the plankton or turbidity.  He can use MATH to write an equation for this relationship (we call that an algorithm).  And you know what that means?  We can use a satellite picture to tell what kind of plankton is in the water!  We can see tiny plankton from space!  WOW.
 
Collecting and Analyzing Data
 

When Charles uses his hyperpro, the machine automatically records the light data and we can see it on a computer screen.  Then he uses special computer software to analyze the data to better understand what it means and how it relates to the satellite.  He creates line graphs to understand the colors of light that are coming down into and up out of the water.  

data processed
Charles’s data after it’s been processed or analyzed. He ends up with line graphs, satellite images, and photos as scientific evidence.
 
One thing I have noticed with all of the scientist on the ship is the importance of data collection!  I have entered some of the data and have noticed data sheets around the wet lab.  If we do not write or type every bit of data, then it can’t teach us anything.  Scientists write data into a data table of columns and rows.  This keeps it organized and easy to understand.  When they analyze the data, they will often create a graph from the data table.  This helps them to see a picture of relationships between the measurements.
data sheet
Audrey and Kyle’s data sheet
 
A Few Questions for Charles
 
Me – How did you become interested in your field of study?
Charles – I worked in Florida as a water quality manager.  It became obvious that we needed to see the bigger picture to truly understand what was happening in the water.  Satellites are the best way to try to get a picture of what is happening over a large space at the same time.
 
Me – What would you recommend to a young person exploring ocean and science career options?
Charles – Work hard in MATH!  I use math every day and would not be able to do this work without it.  It is very important!  Computer coding is also important in the work I do.
Charles computer
Charles surrounded by his work.
 
 
Personal Log
 
Wow, I cannot believe how much I am learning during this experience.  It is truly fascinating.
 
In my past blogs, I mentioned spending some down time on the fly bridge.  I wanted to share more about that part of the ship because it is a truly peaceful place and really allows you to feel that you are in the middle of the ocean!
fly bridge
The fly bridge is the uppermost deck
 
The fly bridge is the highest of the decks on the ship.  It is above the “bridge deck” (where NOAA Corps operates the ship) and just under the radar sensors.  At any given time during the day, you can find some of the science team and sometimes the NOAA Corps team up on the fly bridge.  We might be checking with the seabird observers to see what animals have been spotted, taking a nap in the sun at the picnic table, staring out at the water with binoculars, or getting cozy with a good book.  It’s a great place to soak it all in and my favorite place on the ship. 
fly bridge view
The view from the fly bridge
 
One level below the fly bridge is the bridge deck where the ship is operated.  NOAA Corps Officers are happy to answer questions and it’s also a fun and interesting place to visit.  It’s a great place to see the charts that officers use to navigate, radar screens, and other cool ship operating tools.  They even let me take control of the ship!  JUST KIDDING!  That would never happen, unless I trained to become an officer myself and was authorized to control the ship.  Maybe one day!
pretending to drive
Me driving the ship. Just kidding. But I could pose for a photo just for fun.
 
Did You Know?
 

The largest species of plankton is called a Mola mola.  It is a large fish that looks like it had its tail cut off!  It’s flat, rounded shape allows it to flow with the currents along with its food source, other plankton!  Because the Mola mola is a living thing that drifts with currents, it is plankton!  The seabird observers have seen several Mola mola on this trip.  Maybe I’ll see one tomorrow…

mola mola
A mola mola at the surface. Photo courtesy of NOAA.
 
Mystery Photo
 
Can you guess what this photo is?  Add your guess to the comments below!
Mystery photo
Do you know what this is?


Martha Loizeaux: Spectrophotometers and Eggplant Curry, August 28, 2018

NOAA Teacher at Sea

Martha Loizeaux

Aboard NOAA Ship Gordon Gunter

August 22-31, 2018

Mission: Summer Ecosystem Monitoring Survey
Geographic Area of Cruise: Northeast Atlantic Ocean
Date: August 28, 2018

Weather Data from the Bridge

  • Latitude:  39.487 N
  • Longitude:  73.885 W
  • Water Temperature: 25.2◦C
  • Wind Speed:  13.1 knots
  • Wind Direction: WSW
  • Air Temperature: 26.1◦C
  • Atmospheric Pressure:  1017.28 millibars
  • Depth:  30 meters

Science and Technology Log

spectrophotometer
This is the underwater spectrophotometer!

“Underwater spectrophotometer”… say that 10 times fast!  I was lucky enough to steal a few minutes of Audrey Ciochetto’s time while we admired the views from the fly bridge today.  Audrey works with the Colleen Mouw Lab at the University of Rhode Island.  Her lab studies phytoplankton (you may remember that phytoplankton is plankton that is like a plant) and how light from the sun interacts with plankton.  I bet you never thought about that!  It’s amazing stuff!

Audrey and a graduate student from the lab, Kyle Turner, have brought another cool science tool on board, an underwater spectrophotometer.  The ship has pipes hooked up that take water in from 4 meters under the surface of the ocean at a constant flow.  This water goes into the spectrophotometer and the machine gets to work.  It shines light through the water and measures how the light is absorbed (taken in).  Did you know that light travels in waves?  Different colors of light that you see are different wavelengths.  The spectrophotometer can measure 83 different color wavelengths and what happens to them when they shine on the water.

What does happen to light when it shines into the water?  First of all, the water itself absorbs some of the light.  There are also a lot of tiny things in the water that absorb light.  Can you think of some tiny things that might be in the water? You guessed it again!  Phytoplankton is absorbing some of the light, but also other things like tiny particles and dissolved matter will absorb light.  These items will also scatter the light, making it bounce in different directions.  The underwater spectrophotometer measures that too!

filtering Audrey
Audrey filtering water samples to separate particles and plankton

Audrey and Kyle spend some of their day taking samples of the water and filtering out the plankton and particles, leaving only the dissolved matter.  They will also bring some sea water samples back to their lab to separate the phytoplankton from the rest of the particles. By separating all of these factors, scientists can get an idea of how each of these components in the water are responding to light.

The goal of this work is to understand what satellites are seeing.  Scientists rely on satellites out in space to take pictures of what’s happening on Earth.  These satellites can detect the light from the sun shining on Earth.  They can see some color wavelengths as they are absorbed or scattered by different things on our planet.  With the work that Audrey and Kyle are doing, we can better understand the satellite pictures of the ocean and what they mean.  We can understand what’s in the ocean by looking at what the sunlight is doing when it touches the water.  Pretty incredible, right?

The Design of Experiments

Hearing all of these brilliant ideas from Audrey got me thinking about how creative scientists must be to design experiments and investigations to answer questions.
Remember the hypothesis example that Chief Scientist Harvey mentioned in his interview?  It was an idea that scientists came up with after they used monitoring data to discover a pattern of lower populations of herring (fish).

Hypothesis:  “Increasing haddock populations lead to a lower stable state of herring because haddock feed on herring eggs.”

fish stomach contents
Scientists can study the stomach contents of fish to learn what they are eating. Photo courtesy of The Fisherman Magazine.

How would you design an experiment to test this?
Well, the real scientists who did this work examined the stomach contents of haddock to see how much of their diet consisted of herring eggs!  Would you have thought of that?
It was interesting to read about this study in a scientific journal called PNAS (it stands for Proceedings of the National Academy of Sciences), “Role of egg predation by haddock in the decline of an Atlantic herring population.” By Richardson et. al.

Get creative and start thinking of your own ideas to answer questions you have about the world!


Scientist Spotlight – Tamara Holzwarth-Davis, Physical Science Technician

Tamara is the physical science technician for NOAA National Marine Fisheries Service (NMFS) at Woods Hole.  A technician is someone who is an expert on the equipment and technology used by the scientists.  Today I had a chance to ask Tamara some more questions about her work.

Me – Tell me more about your job.
Tamara – I provide quality control for all of the data brought back by all of the ships involved in our study.  A lot of it is statistical analysis of data [this means looking at data and making sure that it makes sense and is accurate].  I calibrate sensors [make sure they are accurate], process data, and write reports based on the data we find.  We create a yearly atlas of information based on our data that anyone can use to look for trends (such as changes in plankton populations).  I also maintain and coordinate equipment that is needed for the studies.

Me – What part of your job with NOAA did you least expect to be doing?Tamara – I least expected to be so involved with plankton!  I used to do only the hydrography (water chemistry and physical properties) but now I am also involved with plankton data collection.

Tamara on watch
Tamara keeps track of a lot of different things during her watch.

Me – How do you help other people understand and appreciate NOAA’s work?
Tamara – I write the reports and make data available to the public.  People can be reassured that quality control is in place in our monitoring and the data is as accurate as possible.  It is my job to make sure of it!

Me – What do you love about going out to sea?
Tamara – I love the experience of being out at sea and meeting new people!

Personal Log

Our days on the ship are spent collecting data at stations, storytelling and watching the water on the fly bridge, catching up on work, watching sunrises and sunsets.  I’ve been pleasantly surprised by the comfort and commodities (like comfy mattresses and hot showers) and especially, THE FOOD!

food
The food options are outstanding. One night we had king crab legs and tuna steaks.
Margaret chef
Margaret is the best chef EVER.

Here on NOAA Ship Gordon Gunter, we have a wonderful steward staff (cooks and kitchen managers), Margaret and Paul. They always have smiles on their faces when you walk in for meal time and are happy to spread their cheerfulness.  There is always an amazing menu with many items to choose from.  As a vegetarian, I have been blown away by all of the delicious veggie options.  But there is plenty of meat for the carnivores too!  There are always a variety of snacks available as well as healthy options.

Margaret makes homemade cookies and pies, guacamole, crab salad, and eggplant curry, just to name a few.  We all sit down for meals together and share stories.  And there is always dessert!

Did You Know?

Water absorbs red light first.  So, if a fish has red scales when it’s out of the water, under water he will look brown and blend in to his surroundings.  All of the red light will have already been absorbed by the water and there won’t be enough left to reflect off the fish’s scales!

squirrelfish
A squirrelfish can blend in to its surroundings under water. Since it is a red fish, it is hard to see its color since the water has already absorbed the red light from the sun. Photo courtesy of NOAA.

Animals Seen Today

Common dolphins, green sea turtle, brown booby bird, larval hake, larval flounder, larval sea bass, jellyfish

brown booby
Bobby the brown booby stayed with our ship for several hours.
jellyfish jar
A jellyfish we caught in the plankton net!

Martha Loizeaux: Cool Science Tools and Drifter Buoy! August 26, 2018


Martha Loizeaux: Salp Confidence, August 24, 2018

NOAA Teacher at Sea

Martha Loizeaux

Aboard NOAA Ship Gordon Gunter

August 22-31, 2018


Mission: Summer Ecosystem Monitoring Survey

Geographic Area of Cruise: Northeast Atlantic Ocean

Date: August 24, 2018


Weather Data from the Bridge

Latitude: 40.15 N

Longitude: 68.71 W

Wind direction: NE

Wind speed: 14 knots

Water temperature: 23.8 degrees C

Air pressure: 1023 millibars

Air temperature: 24.2 degrees C

Water depth: 165 meters


Science and Technology Log

What an exciting first full day out at sea!  I have been so grateful that our science team has allowed me to be completely hands-on and take responsibility for some of the science happening on the ship.  In addition to checking the Imaging Flow Cytobot (IFCB) periodically, I am very much involved in the data collection at each of our stations.

There are specific stations along our course where scientists need to collect data.  The crew announces when we are close to the station.  At that time, along with another volunteer on watch, I don my foul weather gear to head out to the deck.  We get pretty splashed as we are working with the equipment so the gear is a good idea.  We help the crew as they lower “bongo nets” into the water using a cable and pulley system.  Can you guess why they are called bongo nets?  These nets have a very fine mesh that helps collect, you guessed it, PLANKTON!

bongos on deck
bongo nets waiting on the deck to be deployed
bongos in water
The bongo net and the “baby” bongo net being deployed.

We also help raise the bongo nets after several minutes dragging them through the water.  We rinse all of the plankton down to the bottom of the net and then open up the end of the net to allow all of the plankton into a sieve where we will collect it.  I have been surprised by the amount of jelly-like animals that have shown up in the nets!

Then it’s time to use special liquids (ethanol or formalin) and water to wash the plankton into collection jars. These chemicals will preserve the plankton so scientists can study it back in the lab!

It has been so much fun working with this equipment, asking the scientists questions about the plankton, and being a part of it all.

Harvey, our chief scientist, explained to me that many scientists can use the plankton samples for all different studies.  Some of the samples can be used to study larval fish (baby fish) otoliths, the tiny ear bones that can verify the identification of larval hake using genetics.  Knowing this, scientists can do research to determine where the larval fish were born!  What a great example of the beginning of a scientific

Hake larvae
Some examples of larval hake. Photo courtesy of Harvey Walsh

experiment!:

Question – Where are most larval red hake fish born in the Northeast Atlantic Ocean?

Research – Scientists might research currents in the area, wind patterns, and other things that would push plankton from place to place.  They also would research what other scientists have already learned about larval red hake.

Hypothesis – Most larval red hake fish are born in the Southern New England and Georges Bank regions in the northeast US shelf.

Didn’t I tell you plankton were amazing?

At some of the stations, we also lower Niskin bottles and CTD instruments into the water to collect a lot more data!  More on that to come!

Martha and bongos
Here I am getting ready to deploy the bongo nets.
rinsing nets
Jessica and I rinsing the bongo nets.
plankton on sieve
Plankton looks tiny when we filter it into a sieve.
plankton samples
Our plankton samples after being rinsed into the jars.


NOAA Corps Corner

Today I spoke with Lola Ajilore, Officer with NOAA Corps, and asked her a few questions about her important work.  A pod of humpback whales off the bow stole the show! Here’s what we got in before the exciting interruption…

Me – Tell me more about your roles on the ship.

Lola – I am the Navigation Officer, Medical Officer, Environmental Officer, Ship Store Officer, and Morale Officer.  As you can see, we all have multiple roles on the ship.  As Navigation Officer, for example, I plot charts, track directions, and coordinate with the Operations Officer and Commanding Officer on track lines and routes that are requested by the scientists.

Me – Where do you do most of your work?

Lola – I am always with NOAA Ship Gordon Gunter.  The ship’s home port is in Pascagoula, Mississippi.  Our missions often take place in the Gulf of Mexico but we also run these Northeast Shelf cruises for Ecosystem Monitoring every year.

Me – What kind of training is needed for your line of work?

Lola – We undergo an application process that includes several interview steps.  We then train at the Coast Guard Academy.  Much of our training parallels that of the Coast Guard, but we also do our own NOAA Corps training as well.

Me – What tool do you use in your work that you could not live without?

Lola – Radar!  [Radar aids navigation by detecting things that are far away such as an island or another ship]

Nav officer
Lola as Navigation Officer.
humpback from afar
Can you see the little black dot in the middle of the picture? It’s a humpback whale! It looked a lot closer in real life.


Personal Log


sunset view
Sunset on NOAA ship Gordon Gunter

I cannot believe the amazing views that we have on this ship 24 hrs. a day!  The water has been super calm and the sunrise, sunset, breaching whales, and pods of dolphins have taken my breath away.

Yesterday was emergency drill day!  Libby, our Operations Officer, had given us directions on how to respond to emergencies prior to leaving the

Mustering on the deck
Mustering on the deck during the emergency fire drill.

dock.  There are emergency drills for a fire (just like at school!), abandon ship (in the case that we had to immediately leave the ship in an emergency), and man overboard.

We practiced a fire drill and an abandon ship drill.  The Officers on the ship sounded the alarm, using a different number and duration of blast based on the type of emergency.  For a fire, we all “mustered” (got together in one place) in assigned areas.  All of the science team members mustered together.  For abandon ship, we all mustered near the life boats along with our life jackets and immersion suits (suits that can help you survive if you end up in the water).

Martha in immersion suit
Here I am in my immersion suit!


The fun part of the abandon ship drill was donning our immersion suits in one minute or less!  This was a great thing to practice so if there ever was a real emergency, we would know how to put on the suit.  I thought I looked pretty cool in my immersion suit.


Did You Know?

Salps are barrel-shaped planktonic tunicates.  Our plankton bongo nets always contain some jelly-like salps. Where I live in the Florida Keys, we see mangrove tunicates growing on mangrove roots.  Here in the open ocean, salps stick together in long colonies and drift!  Sometimes there are so many salps in our nets, we have to filter them out with sieves and put them back in the water.

salps from web
An example of a colony of salps. Photo courtesy of NOAA


Something to Think About

We have been finding up to 4,000 phytoplankton in 5 mL of water.  A gallon of water is equal to about 3785 mL.  There is about 352,670,000,000,000,000,000 gallons of water in the Atlantic Ocean.  How much plankton is in the Atlantic?  You do the math.

plankton from web
This is what some plankton look like under the microscope. Photo courtesy of NOAA

Martha Loizeaux: Plankton Palooza, August 22, 2018

NOAA Teacher at Sea

Martha Loizeaux

Aboard NOAA Ship Gordon Gunter

August 22-31, 2018


Mission: Summer Ecosystem Monitoring Survey

Geographic Area of Cruise: Northeast Atlantic Ocean

Date: August 22, 2018


Weather Data from the Bridge

  • Latitude: 991 N
  • Longitude: 590 W
  • Water Temperature: 22.3◦C
  • Wind Speed: 1 knots
  • Wind Direction: WSW
  • Air Temperature: 23.3◦C
  • Atmospheric Pressure: 66 millibars
  • Sky: Mostly Cloudy


Science and Technology Log

Haven’t you always dreamed of having your own Imaging Flow Cyto Bot (IFCB)?  What an interesting scientific instrument that I am lucky enough to be taking care of while on this cruise!  Before we even left the dock, Jessica Lindsey (volunteer from the Maine Maritime Academy) and I were trained by Emily Peacock, research associate at Woods Hole Oceanographic Institution, on how to run this amazing piece of equipment!

The IFCB is a computer, microscope, camera, and water flow controller all in one.  Emily describes it as “plumbing combined with electronics”.  It uses a water intake system from the ship to run a constant flow of water into extremely tiny hoses. As the water flows through these hoses, a laser beam of light shoots at every tiny particle that is in the water.  The tiny particles in the water, mainly phytoplankton (microscopic drifting plants), react to the sudden burst of light.  The phytoplankton scatters the light and also can react by fluorescing (reacting to one wavelength of light by giving off a different wavelength).  The computer detects this scattering and fluorescing to determine where the phytoplankton is in the water flow.  The microscope focuses in on each phytoplankton cell and the camera takes a picture!  Scientists simply get the IFCB going and at the end of the day they have hundreds of pictures of plankton!  Isn’t that incredible?!

Martha IFCB
Here I am learning how to use the IFCB! It is SO COOL!

One thing I’ve learned about this particular cruise is that it’s all about plankton!  We are collecting samples and data for scientists at the University of Rhode Island, Woods Hole Oceanographic Institution, and NOAA’s own Narragansett Lab, just to name a few.  What are all of these scientists studying?  Plankton!  Why?  Plankton is the microscopic lifeblood of the ocean.  The word plankton comes from a Greek word, oikos, meaning “drifter.”  Plankton refers to all the living things of the ocean that are drifting with the currents.  They are present throughout the water column and consist of two types:  phytoplankton and zooplankton.  Can you guess the difference?  Phytoplankton is like a plant.  It has chlorophyll and does photosynthesis.  Zooplankton is an animal.  There are many zooplankton species that hunt, hide, and do other things that larger animals do.  Most plankton is microscopic or close to it.  Phytoplankton does at least half of all the photosynthesis in the WORLD.  So you can think that every other breath you take contains oxygen created by phytoplankton.

Both types of plankton are the base of the marine food chain. If major changes happen in the community of plankton in the sea, these changes will impact the entire food chain all the way up to the apex predators (top predators).  So, as you can see, plankton is SUPER important.  If plankton populations are healthy, it indicates that much of the rest of the ecosystem is healthy too.

Some scientists use equipment, like the IFCB, to study samples of phytoplankton.

plankton on screen
Associate Researcher Emily showing us the program that allows you to see pictures of the phytoplankton sampled.

We also are collecting zooplankton in nets (called “bongo” nets) and preserving samples for scientists to analyze in the lab.  More on that to come soon!

My students have been learning that scientists always start an experiment with a question.

Scientists on this mission are not exactly leading an experiment, but they are responsible for monitoring.  The monitoring of an ecosystem tells us WHAT is happening there.  Scientists from all over the world can then use the monitoring data that we find to research and experiment WHY things are happening the way they are.  This is where the scientific method will come in and an experiment will start with a question.

For example, through the plankton samples that we take on this monitoring mission, scientists may notice a change in the amount of larval hake (tiny baby hake fish).  They can then ask the question, “Why are larval hake populations decreasing?” which may lead them to a hypothesis such as, “larval hake populations are decreasing due to climate change”.  They can test this hypothesis by comparing the plankton data to other types of data (such as pH and water temperature) in the same areas over time.  Thus, an experiment!

So our job now is to collect the important data that can help scientists understand what’s happening and think of ways to investigate “why” and “how”.

Bottom line, I really love plankton.  And you should too.  That breath you just took?  Thank plankton.

screen shot of plankton
Pictures of glorious plankton!


Scientist Spotlight – John Loch – Seabird Observer

Enough about plankton!  During all of this plankton excitement, I have also spent some time on the fly bridge (the top level of the deck of the ship), asking questions to our two seabird observers, John and Chris.  Their job is to stand watch all day, looking for and identifying seabirds, marine mammals, sea turtles, and any notable (large) animals.  Here’s a little interview with John Loch, Seabird Observer:


Seabird observer
John observing seabirds from the fly bridge

Me – Why is your job so important?

John – My job is to monitor seabird populations to help detect changes in numbers or distribution of species.  We estimate a 300 square meter area around the ship and record all birds seen within that area.  We enter our data into a computer, noting species, life stage, number seen, and direction of flight.  Over time, we may notice trends in numbers and distribution which is important to understand this ecosystem.


Me – What do you enjoy most about your job?

John – I enjoy seeing anything new or rare.


Me – How could scientists use your monitoring data to lead an investigation (using the scientific method)?

John – Our data has shown, for example, that some populations of birds, such as the gannet, have steadily declined over the last 20 years.  Researchers can ask “Why are gannet populations declining?” and can use oceanographic data in combination with bird observation data to come up with a hypothesis to test.


Personal Log

I was excited to get underway this afternoon!  Although many of us slept on the ship last night, we have been on the dock until 2:30 this afternoon, when we finally watched the crew release the lines and the ship cruise through the harbor and out to sea!

bow in harbor
A view of the bow as we head out to sea!!

We began our day with a scientist meeting where Harvey Walsh, our Chief Scientist, explained our route and the “stations” where we would be slowing down or stopping the ship to take our data.  He explained our 3am-3pm/3pm-3am shifts that we alternate so that whenever a station is reached, day or night, data can be collected.  I’m lucky to intersect these shifts and work “on watch” from 8am-8pm!  This means that I will support and assist scientist in their data collection during this time, and generally be present and available.

Scientist showing route
Chief Scientist Harvey explaining our route on the Northeast Shelf.

We also heard from Libby, our Operations Officer, who explained our state rooms, bathrooms, shared spaces, and general “do’s and don’ts” of the ship.

Safety briefing
Libby, our Field Operations Officer, explaining the safety procedures of Gordon Gunter

I have to say I am pleasantly surprised by our living quarters aboard NOAA Ship Gordon Gunter.  I have my own state room with a shared bathroom, small closet, sink, and even a desk.  It is quite spacious!  I’m also excited about the food options on board, but more about that later!

view from room window
The view from my state room…not bad!

Tonight is our first night out at sea!  Luckily, I’m not feeling seasick, but rocking and rolling as I type this does feel pretty strange!  Everyone says we’ll get used to it and it will feel normal in no time.

I am so excited for our first morning and sunrise out at sea!  Stay tuned!


Did You Know?

Phytoplankton come in all different colors, just like the flowers in your garden.  Since they are so tiny, we don’t see the colors unless there is a lot of plankton all together.  They also contain more than one color in their cells, similar to leaves that change from green to brown, red, or orange.

noaa phytoplankton
Colorful phytoplankton, photo courtesy of NOAA

Question of the Day

Do you think the amount and type of plankton in an area can affect how many sharks live there?  Why?

NOAA shark
Do sharks rely on plankton? Photo courtesy of NOAA


Martha Loizeaux: Sea You Later!, August 18, 2018

NOAA Teacher at Sea

Martha Loizeaux

Aboard NOAA Ship Gordon Gunter

August 22 – August 31, 2018


Mission: Summer Ecosystem Monitoring Survey

Geographic Area of Cruise: Northeast Atlantic Ocean

Date: August 18, 2018


Welcome

Hello from the Florida Keys!   I am so excited to be embarking on my Teacher at Sea excursion in just 4 days.  I will be joining the crew aboard NOAA Ship Gordon Gunter to participate in a Summer Ecosystem Monitoring Survey in the Northeast Atlantic, departing from Rhode Island and returning to port in Virginia.  I am looking forward to working side by side with NOAA scientists, sharing knowledge with my students, and having the experience of a lifetime!

My students at Ocean Studies Charter School are prepared to follow me along on my journey via this blog and our online classroom.  They have even practiced their own Summer Ecosystem Monitoring Survey of the Hardwood Hammock forest surrounding our school!

I hope you’ll join us in this adventure and check back here for more blog posts in a few days!

20517
The view from my kayak as I lead Ocean Studies Charter School students on a seagrass investigation.


Weather Data from the NOAA weather station at Molasses Reef in the Florida Keys

Molasses buoy
The NOAA weather station at Molasses Reef off of Key Largo. Photo courtesy of NOAA.
  • Latitude: 25.130 N
  • Longitude: 80.406 W
  • Water Temperature: 85.6◦F
  • Wind Speed: 11 knots
  • Wind Direction: ESE
  • Air Temperature: 84.4◦F
  • Atmospheric Pressure: 30.13 in
  • Sky: Partly Cloudy


Science and Technology Log

 I am very much looking forward to participating in the Summer Ecosystem Monitoring Survey aboard NOAA Ship Gordon Gunter.  At Ocean Studies Charter School, we do projects to monitor the seagrass, mangrove, and coral reef ecosystems each year while out in the field.  It will be interesting to see how NOAA scientists conduct these surveys; what tools and equipment they use, what animals and plants they will find, and what aspects of water quality they will measure.

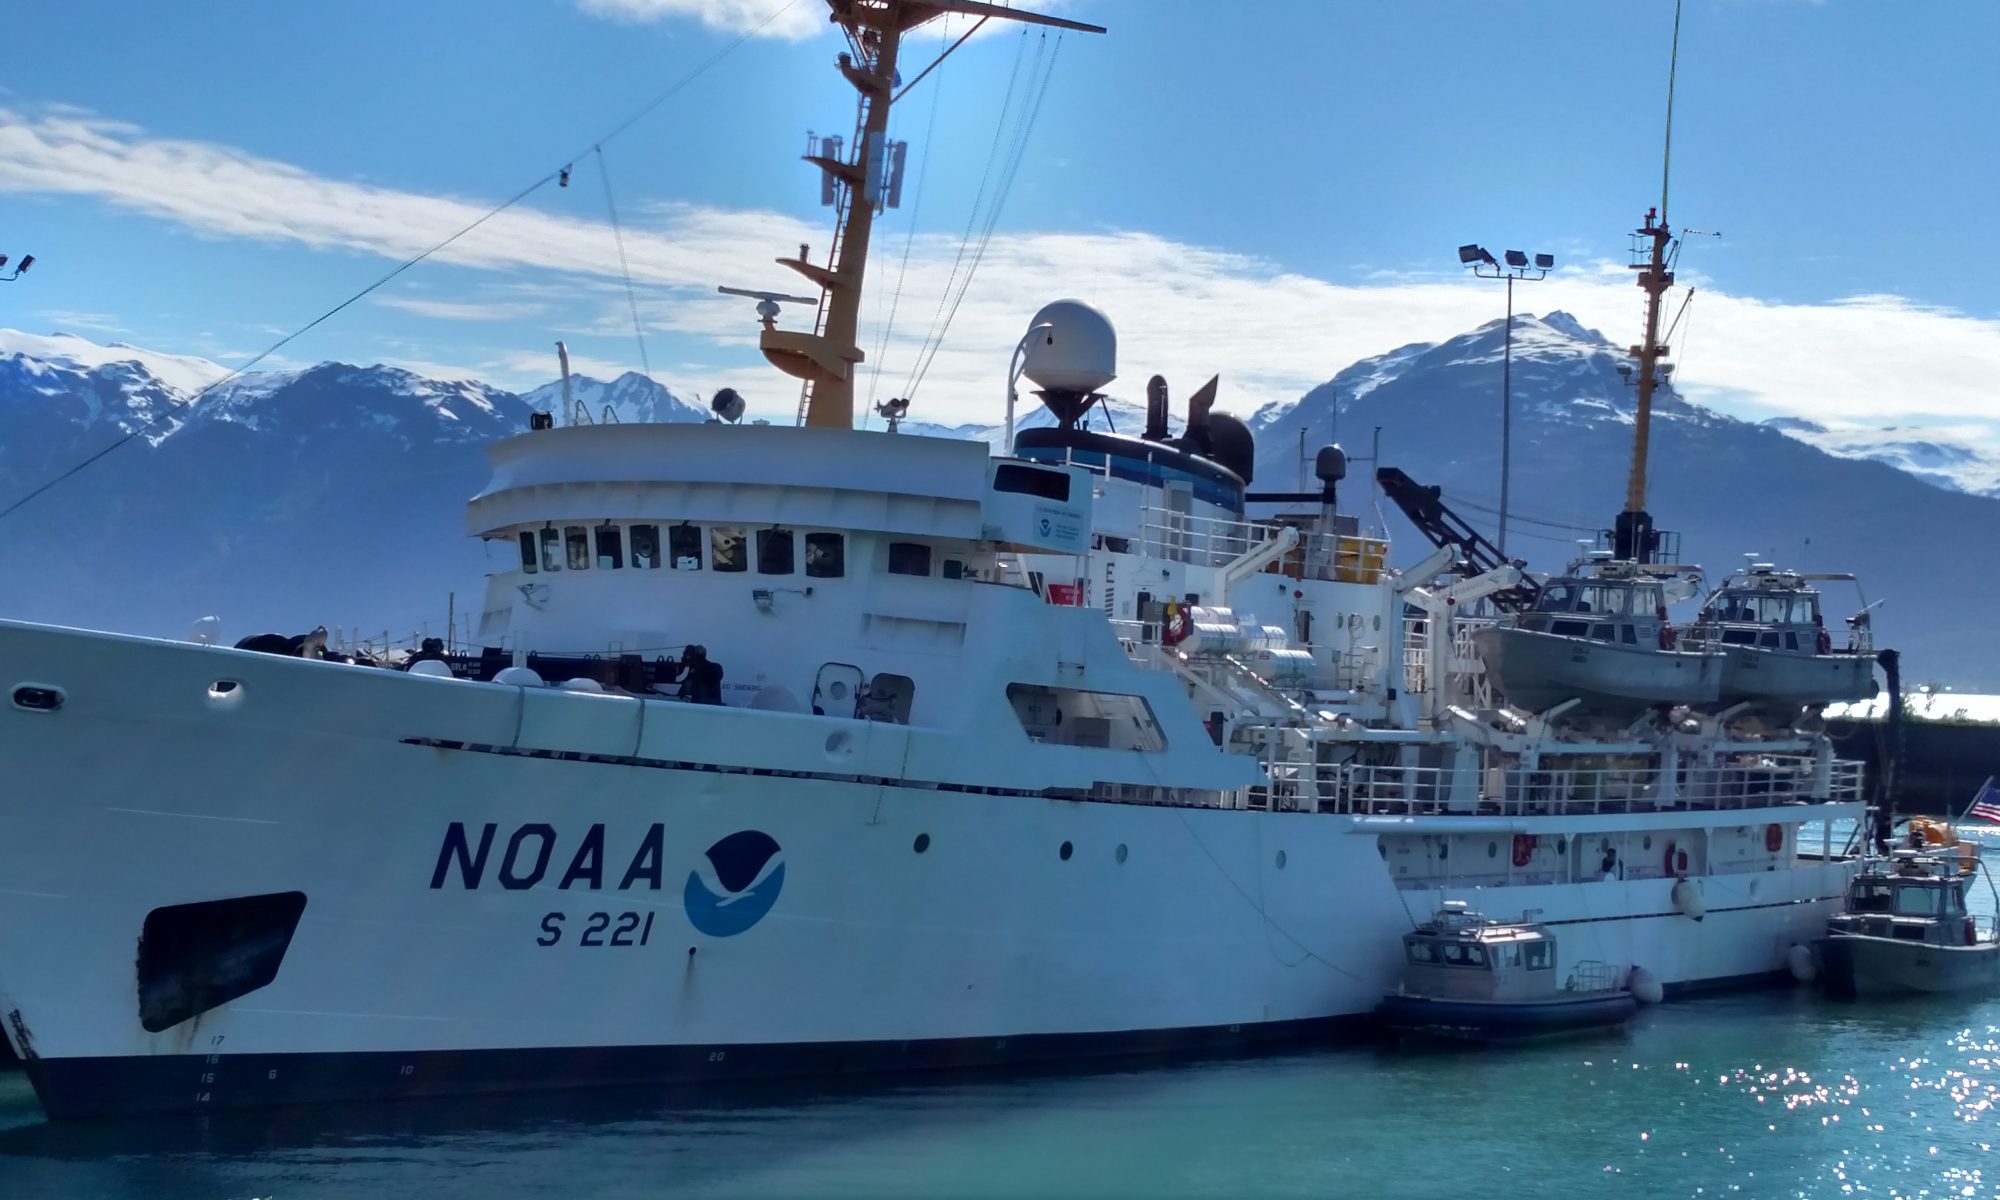
NOAA Ship Gordon Gunter
NOAA Ship Gordon Gunter. Photo courtesy of NOAA.

The ecosystem we will be monitoring on the mission is called the Northeast U.S. Continental Shelf Large Marine Ecosystem (NES LME).  You can just call it the “Northeast Shelf.”  This ecosystem spans the coast and out to sea from North Carolina up to Maine.  Scientists want to know a lot about this part of the ocean because it is very important for something we love to do here in the Keys:  FISHING.  Fishing is fun, but it’s also the way that many people in our country get their food and make money to live.  Fishing is a major industry along the east coast, so the Northeast Shelf Ecosystem is considered a very important natural resource that we need to protect.

Northeast Shelf Ecosystem
A map of the Northeast Shelf Ecosystem. Image courtesy of NOAA.

How can scientists understand and protect this resource?  It starts with Ecosystem Monitoring.

An ecosystem is a place where living things and non-living things work together like a big machine.  Each part of the machine, both living and non-living, is important for the whole system to work.  For example, in an ocean ecosystem, every type fish is needed for the food web to function.  Clean water and plenty of sunlight is needed for the ocean plants and phytoplankton to be healthy.  The ocean plants are needed for the invertebrates that the fish eat… and the cycle continues!  In order for scientists to understand the fish that are important to us, they need to understand EVERY piece of the ecosystem since it is all connected.  That’s why we will be measuring lots of different things on our mission!

ocean ecosystem
An ocean ecosystem has many important parts and pieces. Image courtesy of NOAA.

Monitoring means “observing and checking something over a period of time”.  NOAA scientists observe, measure, and check on this ecosystem 6-7 times per year.  Monitoring an ecosystem lets people know WHAT is going on within the ecosystem.  Scientists can use this information to research WHY things are happening the way they are.  Then, they can use modeling to find out WHAT might happen in the future.  This helps the government make decisions about our precious resources and make plans for the future to keep our oceans healthy and our fish populations strong.

Rosette deployment
There are many types of tools scientists use to monitor ecosystems. Photo courtesy of NOAA.

On our mission, scientists will collect plankton, invertebrates, and fish with special nets to count and measure them.  They will look and listen for marine mammals and sea birds.  They will take measurements of the water such as temperature, salinity (amount of salt), nutrient levels, and ocean acidification.  These measurements will help them understand the quality of water and changes of the climate in this area.  What other aspects of the ecosystem do you think are important to measure?

Bongo net deployment
Special nets are used to collect and study plankton. Photo courtesy of NOAA

I can’t wait to see how we will take all of these measurements and what we will see out there!


Personal Log

I am proud to call myself the Marine Science Teacher at Ocean Studies Charter School in Tavernier, Florida Keys.  We are a small public charter elementary school, focused on the surrounding marine environment and place-based learning.  I teach science to all grades (K-5) and lead our weekly field labs.  I even drive the school bus!  We use the term “field labs” instead of “field trips” to highlight that we are not simply visiting a place.  We are using the outdoors as our learning laboratory, working on projects, collecting data, and partnering with local organizations on our excursions.  We study the local habitats of the shallow seagrass beds, mangrove forests, and coral reefs that we are so lucky to have in our backyard.

students at beach
Taking students to the beach to study shallow water ecosystems.

Upon my return from my Teacher at Sea mission, we will be hosting the grand opening of our new Marine Discovery Laboratory in the center of our school!  After teaching marine science in an outdoor classroom for the past 7 years, I am excited for the opportunities that our state-of-the-art indoor lab will bring (no more visits from the local iguanas)!

Lionfish
Learning about lionfish in the lab.

My students impress and amaze me every day with their ideas and discoveries.  I have watched them create and present model ecosystems, examine hurricane protection ideas by studying animal survival, and help scientists tag sharks to learn more about their populations.  At the start of this new school year, I cannot wait to see what ideas they will come up with next!

Everglades
Leading students on a tour of Everglades National Park.
Students fishing
Sustainable fishing with students in the field.

It will be hard to be away from my family, especially my two awesome sons, ages 6 and 9.  I hope they enjoy following along with Mom’s blog and that they are inspired by my experience!

I originally hail from New Hampshire but have lived in Florida for all my adult life.  Prior to teaching, I worked on boats as an environmental educator and earned my captain’s license along the way.  I have been a SCUBA instructor, marine aquarist, and guide for summer travel adventure camps.  As a teacher, I have been lucky enough to also participate in “Teacher Under the Sea” through Florida International University.  In this program, I assisted scientists under the ocean at the Aquarius Undersea Laboratory right here in the Florida Keys.  Throughout my life, I have loved the ocean.  One day, I hope to sail out to sea and travel the world on my own boat.

diving
Diving outside the Aquarius Undersea Lab during “Teacher Under the Sea”.

But for now, I’m not sure exactly what to expect in terms of living aboard NOAA Ship Gordon Gunter.  I look forward to sharing adventures and stories of life at sea!  Stay tuned to this blog and check for my updates in a few days.  Sea you soon!


Did You Know?

NOAA Ship Gordon Gunter was named after an American marine biologist and fisheries scientist who was considered a pioneer in the field of fisheries ecology.

The ship was originally built in 1989 as the U.S. Naval Ship Relentless and was transferred to NOAA in 1993.

NOAA Ship Gordon Gunter.
NOAA Ship Gordon Gunter. Photo courtesy of NOAA.


Word of the Day

 Ichthyoplankton – The planktonic (drifting) eggs and larvae of fish.

When scientists tow for plankton, studying the icthyoplankton helps them understand fish populations.

Fish Egg
An example of icthyoplankton. Photo courtesy of NOAA.