Mission: Hydrographic Survey- Approaches to Houston
Geographic Area of Cruise: Gulf of Mexico
Date: July 12, 2018
Personal Conclusion
It was wonderfully impressive listening to ENS Jacquelyn Putnam’s orders to the Bridge while docking the ship. She and Lt. Klemm stood just outside the doors to the Bridge with a clear view of the dock at Pier 21. As she called out orders, the Bridge team would respond by making adjustments to the rudder, speed, or direction. I hadn’t realized how much of a team effort docking the ship would be. It was like parallel parking a car in busy downtown Portland on a much larger scale.
We arrived at Pier 21 in Galveston, Texas early Friday morning on July 6th. There were several fishing vessels flocked with birds. Sometimes you could see dolphin fins peeking up through the water around the boat.
After we were safely docked, all shipmates met in the mess where CDR Chris van Westendorp gave a speech of recognition and appreciation for his crew. These last couple legs at sea are especially meaningful for CO as they symbolize a transition of many years at sea to an upcoming land assignment. There were also several people taking much-deserved leave, or moving onto other job assignments.
Sunset from the bow during my two weeks aboard NOAA ship Thomas Jefferson.
I am so grateful to have been able to participate as a teacher at sea on the Thomas Jefferson. I knew it would be a learning experience, but I didn’t realize how impactful my relationships and interactions with the crew would be. There is something truly inspirational about being around a well-functioning team of people serving a meaningful purpose. People are excited to work for NOAA and to be a part of a higher scientific mission.
I also hadn’t realized the direct relationship between hydrographic surveys and hurricane relief. After a hurricane, the sea floor can shift and change/block major pathways for delivering supplies like oil and water. Last year, NOAA ship Thomas Jefferson responded to Hurricane Maria in Puerto Rico, “NOAA Ship Thomas Jefferson spent the last three weeks in Puerto Rico and the U.S. Virgin Islands surveying ports and bays in response to Hurricane Maria. Over the three week period, the crew surveyed 13 areas and no fewer than 18 individual port facilities, as well as conducted emergency repairs to three tide and weather stations.” (NOAA Office of Coast Survey, October 2017)
Looking towards next school year, I am excited to bring my experience into the classroom and provide students with meaningful learning opportunities. I am looking into using Citizen Science, ways of incorporating the Ocean Literacy Principles, and reaching out to have more diverse professionals interact with my classroom. One of my goals as a science and math teacher is to provide students with many opportunities to ask questions, explore, think critically, and be inspired to continue a lifelong journey of learning and growth.
My experience with NOAA and NOAA ship Thomas Jefferson will forever have an impact on my classroom and for that, I am extremely grateful.
4th of July goodies made by ENS Sydney Catoire, Julia Wallace, and Kevin Brown.I practiced my Bowline knots on the long trek home.
Mission: Hydrographic Survey- Approaches to Houston
Geographic Area of Cruise: Gulf of Mexico
Date: July 5, 2018
Weather Data from the Bridge
Latitude: 28° 53.4’ N
Longitude: 093° 44.6’ W
Visibility: 10+ NM
Sky Condition: 3/8 (Reminder: 3 out of 8 parts of the sky are covered with clouds.)
Wind: 6 kts
Temperature:
Sea Water: 29.1° C
Air: 27° C
Science and Technology Log
It is fitting to add a section on weather because tonight we are seeing a lightning storm! I can even hear the fog horn. During Bridge Watch, weather data is logged every hour around the clock. Every four hours, it is entered into a computer system. On most days, we are fortunate to get a weather report in various character voices over the intercom from ENS Krabiel.
This is the hourly weather log from June 26, 2018.
My favorite tools are the wind wheel, alidade, and relative humidity thermometers.
A somewhat complicated process allows one to find the true direction (opposed to relative) of the wind. Since the ship is not always traveling North, it is important to be able to calculate true wind direction. Officers typically use a reading on the computer to find true wind direction, but I thought it was a neat tool to try.The alidade is located outside of the Bridge. It is a sighting device used for measuring angles. It has been helpful with measuring the swell direction. ENS Krabiel mentioned that it is also useful for checking bearings when a ship is anchored. For example, a bearing (like to an oil platform in the Gulf of Mexico) will change if the ship is drifting and/or dragging anchor.On the Weather Log, there is a place for “dry bulb” and “wet bulb.” This information is collected using two thermometers outside of the Bridge. The dry bulb is a typical thermometer, while the wet bulb has a small sock-like covering wicking up water from a tray. The closer the two temperature values, the higher relative humidity.
I have also sat in on a number of data processing evenings with the Survey Team. In one evening, roughly 50 GB of data from multibeam sonar only was processed. It is estimated that a total of 11 TB has been processed since April. Data processing begins around 7:30 pm and the survey team analyzes all information collected during the hours of 7am- 7pm. Staying on top of processing is important because of the massive amounts that accumulate, especially from side scan sonar.
Julia Wallace, physical scientist, showed me one aspect of processing multibeam sonar. She takes a file of data and runs a “flier finder” with a parameter of 0.5 meters (appropriate for the depth of sonar.) Essentially, the flier finder is marking any outliers that fall outside of this range. Julia then manually goes through and “hides” these points so that they do not contribute to the data set. This is important because when this data is used to mark bathymetry (sea floor depth) on nautical charts, it will somewhat randomly “grab” these false sounding set numbers and could land on one of the outliers, resulting in a false depth.
Every dot in this picture of raw data is a sonar ping returning to the multibeam echosounder. The number of pings depends on the sonar sounding frequency. For example, one could expect 300 pings per second when operating at a sounding frequency of 300 hz.
From what I have witnessed and gathered through multiple conversations with the team, the data collected by the Thomas Jefferson for NOAA charts is extremely accurate. For example, every pixel (or node) on the multibeam sonar grid represents no coarser than 1 square meter of the sea floor. This has changed from about 30 years ago where the ratio was 1 nodel: 5 square meters. In addition, many processes are doubled-up as a check for validity. This includes crosslines for checking main scheme data and operating two multibeam frequencies at the same time.
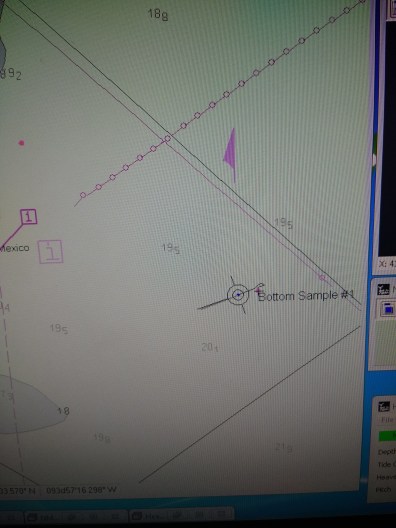
One of the benefits to running two frequencies of multibeam is the ability to create an overlapped average of the two backscatter signals (with a false color scheme.) This information helped inform Lt. Anthony Klemm and survey technician Kevin Brown determine eight unique sites varying in backscatter intensity for bottom sampling. (Remember: intensity is a measure of how strong the sonar ping returns, depicting varying sea floor substrate.
The use of this technology paid off! All eight sites sampled varied in texture and sediment size. Using this process of selectively choosing sites of interest based on “multispectral” backscatter intensity has replaced taking numerous random bottom samples using a grid. Again, this is a highly accurate and time-saving process. It was also interesting seeing the actual sea floor that we are mapping.
In the bottom right corner, Bottom Sample #1 site is selected.
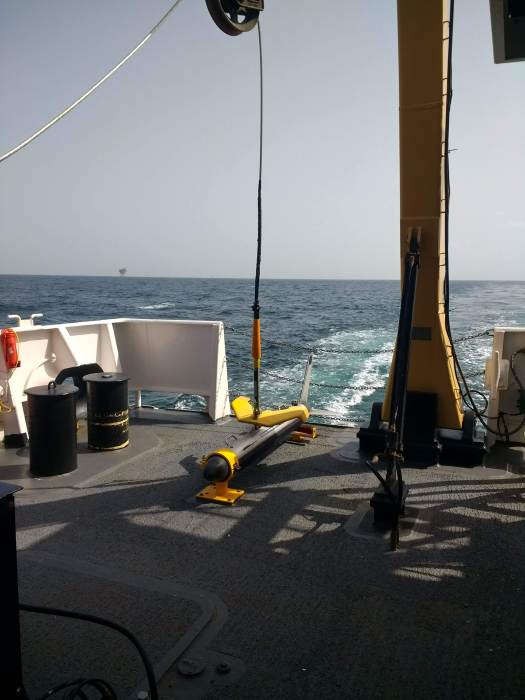
CHST Allison Stone manages the crane while Lt. Charles Wisotzsky directs the bottom sample claw and ENS Taylor Krabiel performs various substrate tests.
ENS Krabiel gives me a tutorial on bottom sampling. Krabiel enjoys creating short “Rock Hunting” clips for entertainment. His enthusiasm has made this trip a lot of fun.All of the eight bottom sample sites had a different composition. One in particular had a lot of rocks and shells. The rock in the upper right appears to have remnant tunicate casings.Notes from survey sheet H13044, BS# 001 (Bottom Sample #1) state the grain size: silt, muddy, coarse, and some shell fragments.
A GoPro is located in a cage on the bottom sample claw. Video footage of the sea floor enables hydrographers to view the substrate and current ripples in the sand. ENS Krabiel wears the control on his wrist to activate the camera.
Personal Log
I have enjoyed hearing the back-stories of the crew. For example, Allison Stone, Chief Survey Technician knew she wanted to be a part of NOAA when she was in 6th grade- the same age as my students. She remembers going to a parent career night at school and speaking with a presenter from NOAA. The presenter was enthusiastic about their job which inspired Allison to pursue a placement with NOAA. Although she envisioned counting marine animals and snorkeling daily, she is still passionate about her work in hydrography geoscience and speaks highly of NOAA outreach.
Field Operations Officer, Lt. Anthony Klemm started out wanting to do a public service and became a teacher. Later, he joined the NOAA Corps and after completing basic training got a job at the Marine Chart Division in Washington DC. It was during this time that he was given a lot of flexibility and time to create and test his own ideas and experiments. In his words, some of them flopped. However, one idea that has recently captured attention is the idea of “crowdsourcing” bathymetry. Collecting, processing, and submitting data for the official approval and update of NOAA nautical charts is a long process. It can take months for charts to be updated and available to the public. Crowdsourcing bathymetry is a way for the general public to gather and submit sonar data using simple devices like a “fish finder” that one might find on a recreational boat. These could serve as interim bathymetry data until the areas can officially be surveyed and charted. It’s also simple (users select a setting), and free.
This photo and thee above are snapshots of data collected using “crowdsourced” bathymetry.
Peaks
+ Participated in a simultaneous medical/fire drill.
“This is a drill, this is a drill. There has been a medical emergency on the starboard stairway of the bridge…” The person in this picture is only acting and not actually injured. The bridge had also simulated a fire which interfered with steering and communications.A debrief was held in the Mess after the drills.This was a day for drills. The FRB (Fast Rescue Boat) was manually unloaded using a hand brake to simulate loss of power. Earlier in the day, the launch boat was manually loaded back onto the ship. Passengers (including myself) boarded the ship using a rope ladder.
Mission: Hydrographic Survey- Approaches to Houston
Geographic Area of Cruise: Gulf of Mexico
Date: July 3, 2018
Weather Data from the Bridge
Latitude: 29° 17.5’ N
Longitude: 094° 27.7’ W
Visibility: 10+ NM
Sky Condition: 3/8
Wind: 10 kts
Temperature:
Sea Water: 29.5° C
Air: 31.1° C
Science and Technology Log
The ship is equipped with AIS or automatic identification system. AIS is the primary method of collision avoidance for water transport. It provides unique identification, position, course, and speed of ships equipped with AIS. All vessels with 300 or more gross tonnage and all passenger ships must be equipped with AIS.
In the beginning, it took me a little while to realize that we were passing by some of the same oil platforms and seeing the same ships on the radar screen (above). For example, today the Thomas Jefferson covered many nautical miles within the same 2.5 NM area. This is characteristic of a hydrographic survey. A sheet (area to be surveyed) is split into sections and a plan is devised for the ship to cover (using sonar) the area in a “mow the lawn” approach. In the photo below, you can see the blue lines clustered together. These are the main scheme lines and provide the majority of data. The lines going perpendicular in a loose “zig-zag” to the main scheme lines are called crosslines. While main scheme provides the majority of sonar data, crosslines provide validation. For every 100 nautical miles of main scheme, 4 NM of cross lines (4%) must be completed.
You can see the main scheme and cross lines in this image using the Coastal Explorer program.
You can also see the main scheme and crossline(s) in the Hypack viewer below. Hypack is a software program controlled from the Plot (Survey) Room and is duplicated on a screen on the Bridge (steering deck). This allows Bridge watch standers to see track lines and the desired line azimuth (direction). In this case the line azimuth is around 314°. Additionally, the bottom portion showing -0.0 means that the ship is precisely on track (no cross-track errors). Typically, during a survey from the main ship, there is room for up to 10 meters of error in either direction and the sonar data coverage will still be complete. Once the course is set, the ship can be driven in autopilot and manually steered when making a turn. The high-tech equipment allows the rudder to correct and maintain the desired course and minimize cross-track error. Still, at least two people are always on the bridge: an officer who makes the steering orders and maintains watch and a helmsman who steers the ship. I was fortunate to be able to make two cross line turns after a ship steering lesson from AB (able seaman) Tom Bascom who has been on ships his whole life.
Hypack software is one point of communication between Survey and the Bridge Watch.Communication between Survey and the Bridge Watch is critical. Every time the ship makes a turn, the side scan towfish and MVP must be taken in. The Bridge also notifies Survey if there are any hazards or reasons to pull in survey equipment.
At night, the ship is put into “night mode” and all lights are switched to red. The windows are covered with a protective tinted sheet and all computer screens switch over. The CO leaves a journal with posted Night Orders. These include important summary points from the day and things to look out for at night It also includes a reminder to complete hourly security rounds since most shipmates are asleep. A “Rules of the Road” section is included which serves as a daily quiz for officers. My favorite part of CO’s Night Orders are the riddles, but they are quite difficult and easy to over think. So far, I have guessed one out of five correctly.
ENS Sydney Catoire explains how important it is to preserve your night vision while maintaining watch, thus the dimming and/or use of red lighting. Her favorite watch time is from 0800-1200.CO Night Orders from June 28, 2018
With a lot of my time spent looking at computer screens in survey, I was happy to spend an afternoon outside with the Deck Crew. Their job is highly diverse. Rob Bayliss, boatswain group leader, explained that the crew is responsible for maintaining the deck and ship. This includes an ongoing battle with rust, priming, painting, and refinishing surfaces. Rob wiped his hand along the rail and showed the massive amount of salt crystals collected throughout the day. The crew has a PR event and will give public tours the day we arrive in port, so the ship is in full preparation!
I was introduced to the needle gun- a high powered tool used for pounding paint and rust off surfaces to prepare them for the wire wheel and paint primer. CO thanked me for my contribution at maintaining the preservation of the TJ.One of the Thomas Jefferson wooden plaques sanded and receiving a fresh coat of varnish.
I also spoke with Chief Boatswain, Bernard Pooser. He (along with many crew members) have extensive experience in the navy. Pooser enjoys life on the ship but says, “It’s not for everyone; you have to make it work for you.” He claims that the trick is to find a work and recreation balance while on the ship. He gave me some examples like being sure to take breaks and have fun. Pooser even pulled out a corn hole set that we may use one of these evenings.
Chief Boatswain Bernard Pooser
Peaks
+ It’s been fun being on the bridge at night because all of the ships and platforms light up.
+ I was given my own stateroom which was nicely furnished by its usual occupant. She has even installed a hammock chair!
+I hadn’t realized how responsive the ship would be when steering. At 208 feet, I thought it would be a bit more delayed. The maximum turn angle is 35 degrees and we have usually been making turns around between 5-15 degrees.
+We saw two sea turtles and dolphins while taking bottom samples! (See future post.)
Mission: Hydrographic Survey- Approaches to Houston
Geographic Area of Cruise: Gulf of Mexico
Date: July 1, 2018
Weather Data from the Bridge
Latitude: 29° 10.1’ N
Longitude: 093° 54.5’ W
Visibility: 10+ NM
Sky Condition: 3/8
Wind: 16 kts
Temperature:
Sea Water: 29.4° C
Air: 27° C
Science and Technology Log
At this point I have been able to understand more of the sonar technology taking place during the survey aboard the Thomas Jefferson. The ship uses two types of sonar: multibeam and side scan. Both work together transmitting and receiving sound pulses to and from the ocean floor. This provides a multispectral analysis.
Julia Wallace, a physical scientist, works at the sonar acquisition station. This requires a large amount of multitasking as she communicates with the bridge (ship steering deck), watches the safety cameras, and makes sure both sonar devices are working correctly.
Multibeam sonar is located underneath the hull of the ship. Multibeam is used to detect bathymetry (the depth of the ocean floor). Multibeam backscatter (reflected wave energy) gives a reading of the surface intensity. For example, a strong signal would mean a harder surface like rock or pipeline. With multibeam sonar, you can also adjust the sound wave frequency. For example, high frequency (primarily used during this survey in the Gulf of Mexico) is used for shallower waters allowing for higher resolution images. Images from multibeam have a color gradient to allow for clear vision of contours and depth differences. One way surveyors aboard the TJ may use backscatter images is to determine areas where bottom sampling might be applicable.
A NOAA ship using mulitbeam sonar. (Courtesy of NOAA)Bathymetry acquired using multibeam echosounder layered over a nautical chart. Blue and green wave lengths penetrate further in water, so the coloring corresponds to this observation. This poster is from a previous Thomas Jefferson hydrographic survey near Savannah, Georgia. (Prepared by CHST Allison Stone)3D bathymetry imagery from the Okeanos Explorer. (NOAA)A close-up view of multibeam data. The third window down shows multibeam backscatter.
The side scan sonar is used alongside multibeam to provide black and white scans of images. Like multibeam backscatter, side scan measures the intensity of the sound returning from the sea floor. For example, a side scan return with high intensity could indicate a difference in material like pipeline or a wreck. A low intensity value could mean that the side scan sonar waves have reached a muddy substrate. Julia used the analogy of a tennis ball being bounced against a wall of different materials. For example, the tennis ball hitting a concrete wall would bounce back with higher intensity than one being bounced against a soft wall. Side scan sonar is very effective at detecting features that protrude off the sea floor, and for shallow water surveys, typically can see farther and cover a greater area the sea floor than multibeam echosounders alone.
The side scan sonar sensor is located on a torpedo-shaped “towfish” and pulled behind the boat. When viewing side scan images, surveyors typically look for the acoustic shadow cast by a feature protruding off the sea floor. By measuring the length of the acoustic shadow, hydrographers can determine whether the feature requires additional investigation. For example, the outline of a shipwreck, bicycle, or pipeline. However, it can also detect mammals like dolphins or schools of fish.
Diagram of side scan sonar. (Courtesy of thunder bay 2001, Institute for Exploration, NOAA-OER)The Thomas Jefferson sidescan sonar on deck.In the early morning, the sidescan sonar picked up the image of an incorrectly charted shipwreck. Height is estimated using the “shadow” of the wreck.Sidescan sonar imagery layered on a nautical chart. It is important to remember that sidescan data does not account for depth, it is a measure of differences in sea floor substrate.Look closely and you can see arc lines in the sidescan imagery. Lt. Anthony Klemm explains that these arcs are from ships dragging anchor and stirring up the sea floor.
While this is happening, surveyors are also towing a MVP or Moving Vessel Profiler to capture information about the water column. This is important because multiple factors in the water column need to be corrected in order for accurate sonar calculations. For example, the speed of sound in salt water is roughly 1500 m/s but may change while the ship is traveling over different parts of the sea floor or passing through a thermocline (steep temperature gradient) or halocline (steep salinity gradient). The MVP is similar to the CTD used on the launch boat (see previous post), but the MVP allows the ship to continue moving at about 10 knots (average survey speed), while the CTD must be cast when the ship is stationary.
Information from the Moving Vessel Profiler. From left to right, the MVP tracks sound speed, temperature, and salinity in relation to depth.
For more information on multispectral analysis and sonar, see these resources:
One of my goals in the classroom is to teach students to be comfortable making and learning from mistakes. Making mistakes in math and science is common and welcome because they lead to great discussion and future change. Often, my sixth graders get discouraged or so caught up in failure that they become paralyzed in making further attempts. While aboard the Thomas Jefferson, I have witnessed several aspects not go according to plan. I think these experiences are important to share because they provide real-life examples of professionals coming together, learning from mistakes, and moving forward.
Around 4:00 am, the towfish side scan sonar became entangled with the MVP. This was a horrendous disaster. The crew spent about 16 hours contemplating the issue and collecting data using the multibeam only, which is less than ideal. One of XO LCDR McGovern’s many roles aboard the ship is to serve as the investigator. She reviewed tapes of the early morning, talked with the crew, and later held a debrief with all involved. When something like this happens, the ship must write a clear incident report to send to shore. There were many questions about why and how this happened as well how to best proceed. In the end, the towfish and MVP were untangled with no damage present to the sensor. Within the same day, both were cast out and back in use.
I find this to be an astounding example of perseverance and teamwork. Despite being disappointed and upset that a critical tool for collecting accurate data was in dire shape, the crew came up with a plan of action and executed. Part of the engineering and scientific processes include evaluation and redesign. Elements of the sea and a center drift of the side scan lead to a documented new plan and refiguring the process so that this is unlikely to happen again.
Lt. Charles Wisotzsky’s sketch of the complications with launching both the sidescan sonar (which tends to centerline) and MVP towfish with a current coming from port side.This camera image captures the entanglement of the sidescan sonar and MVP.
Peaks
+Saw a tuna eat a flying fish
Flying Fish. (www.ocean.si.edu)
+There is a large sense of purpose on the ship. Despite complex sleep schedules to enable 24 hour operations with a smaller crew, people are generally happy and working hard.
+ There seems to be an unlimited supply of ice cream in the ice cream freezer. Junior Officer, ENS Garrison Grant introduced me to a new desert- vanilla ice cream, a scoop of crunchy peanut butter, and chocolate syrup. I also found the rainbow sprinkles.
Mission: Hydrographic Survey- Approaches to Houston
Geographic Area of Cruise: Gulf of Mexico
Date: June 28, 2018
Weather Data from the Bridge
Latitude: 28° 50.7’ N
Longitude: 093° 34.4’ W
Visibility: 10+ nm
Sky Condition: 4/8
Wind: 12 kts
Temperature:
Sea Water: 29.6° C
Air: 29.3° C
Science and Technology Log
This afternoon I spent an hour with Chief Marine Engineer, Thom Cleary. As promised, he gave me a tour of the Engine Room. Thom arrived on the Thomas Jefferson in 2011 and has worked not only on maintaining operations, but greatly improving them. When asked about his favorite ship mechanism, he responded with one that is not his favorite but of which he is most proud. The Thomas Jefferson, along with most other ships, typically used to rid greywater and sewage by offloading into the ocean. The EPA states that ships must be at least one nautical mile from land or people in the water and three nautical miles from aquaculture (2018). With hydrographic survey operations taking place in “no discharge” areas (close to shore), this could complicate and/or slow down the Thomas Jefferson’s progress.
Realizing the inefficiency and in an effort to improve, Thom investigated other options. It was decided that a fuel storage tank would be converted to hold more wastewater. After a long wait period, the new method was installed. Within the first season 38,000 gallons of sewage was stored and discharged to a shore treatment facility. Today, the tanks have gone almost two months without release into the Gulf of Mexico. This improvement has allowed hydrographic operations to continue without interruption, conserves fuel, and increases efficiency.
Renovations to the Thomas Jefferson did not stop there. Originally constructed in 1991, the ship has room for many other improvements. Thom and team advocated for all natural lubricants (rather than petroleum), switched all light fixtures to LEDs, and adjusted the ballast system. In 2016 the roughly 122,000 gallon ballast system changed from using sea to municipal water. This now allows the ship to move from multiple coastal waters without concern for carrying invasive species in the ballast tanks. In addition, the new waste water tank was strategically placed in the center of the ship to help with stability.
Ballast diagram showing invasive species risk. (CC)
Thom is an innovator and self-described incorrigible tinkerer. Many of these changes would not have been made without his (and team’s) desire and advocacy to make things better. When I asked if these upgrades were standard on ships, he mentioned that the Thomas Jefferson is a trailblazer.
Chief Engineer Thom Cleary and the desalination/ reverse osmosis system. The RO typically operates at 650 psi (with 900psi maximum potential) and pushes sea water through a membrane creating potable water for the ship.
Personal Log
CO (Commanding Officer) authorized a launch on one of the boats. After some mishaps with a fuse, the crew performed multiple safety checks and we were cleared to go. Mission: collect survey data near a stationary platform. CO’s comfort level to obstructions with the main ship is a half-mile, so having the smaller launch boats is helpful when surveying areas like this.
The launch boat crew from left to right: Lt. Klemm, Kevin Brown, Pat Osborn, and Brandy Hill (below deck).
Survey area near the stationary platform. The ship to the left is a supply vessel.
While cruising out to the survey area, I spoke with Pat Osborn, part of the Thomas Jefferson’s deck crew and our survey line driver for the day. Pat has two years of training and was explaining that he is still learning parts of his job. (Everyone on the ship wears multiple hats.) He spoke highly of his job and appreciated the multi-dimensional relationship between CO and the crew. Pat explained that CO is not expected to be an expert in all areas of the ship- there are safety checks (such as preparing for the launch) where the CO asks lead crew members to evaluate and sign-off prior to action. Every mission I’ve observed and attended has proceeded in this manner. It is a highly respectful and safe environment.
Chief Survey Technician, Allison Stone, awaiting launch boat arrival.Patrick Osborn approaching ship Thomas Jefferson with the launch boat.Kevin Brown lowers the CTD while the boat is stationary. A CTD captures the salinity, temperature, depth, and concentration of particles in the water column. This information is used for analyzing the survey data. On the ship, this information is collected using an MVP which allows the ship to stay in motion.
As soon as we had the survey equipment set up and running, survey technician Kevin Brown brought out a fishing pole. I hadn’t realized that we could fish while out on the boat! We proceeded to catch and release about 10 tuna (likely False Albacore and Bonito). Kevin reeled in two, then passed the pole to me. I couldn’t believe how hard it was to real in a fish. I was reading that they can stay on the line and swim up to 40 mph!
Brandy Hill’s active line power stance.Brandy Hill and her first fishing boat catch, False Albacore.
Peaks
+ Witnessed hard work and precision paying off- the launch boat survey data had an error of 0.0006 meters. The data is highly accurate!
+ Drove “the survey line” on the launch boat. (More of an explanation coming soon.)
+ Reeled in a beautiful, tough fish.
Note: After the seasickness subsided, I’ve decided to leave out the “Valleys” category. I’m having a great time.