Mission: Northern Gulf of Alaska Long-Term Ecological Research project
Geographic Area of Cruise: Northern Gulf of Alaska – currently
sheltering in Kodiak harbor again
Date: September 23, 2019
Weather Data from the Bridge:
Time: 13:30 Latitude: 57º47.214’ N Longitude: 152º24.150’ E Wind: Northwest 8 knots Air Temperature: 11ºC (51ºF) Air Pressure: 993 millibars Overcast, light rain
Science and Technology Log
As we near the end of our trip, I want to focus on a topic that it is the heart of the LTER study: zooplankton. Zooplankton are probably the most underappreciated part of the ocean, always taking second stage to the conspicuous vertebrates that capture people’s attention. I would argue however, that these animals deserve our highest recognition. These small ocean drifters many of which take part in the world’s largest animal migration each day. This migration is a vertical migration from the ocean depths, where they spend their days in the darkness avoiding predators, to the surface at night, where they feed on phytoplankton (plant plankton). Among the zooplankton, the humble copepod, the “oar-footed,” “insect of the sea,” makes up 80% of the animal mass in the water column. These copepods act as a conduit of energy in the food chain, from primary producers all the way up to the seabirds and marine mammals.
A copepod. Photo credit: Russ Hopcroft.
Aboard the R/V Tiglax, zooplankton and copepods are collected in a variety of manners. During the day, a CalVet plankton net is used to collect plankton in the top 100 meters of the water column.
Russ prepares the CalVet for deployment.
On the night shift, we alternated between a Bongo net and a Multinet depending on our sampling location. The Bongo net is lowered to 200 meters of depth (or 5 meters above the bottom depending on depth) and is towed back to the surface at a constant rate. This allows us to capture the vertical migrators during the night. How do we know where it is in the water column and its flow rate you may ask? Each net is attached to the winch via a smart cable. This cable communicates with the onboard computer and allows the scientists to monitor the tow in real time from the lab.
The Bongo net coming back aboard. Note the smart cable attached to the winch that communicates with the computer. Grabbing the Bongo can be tricky in high seas as we learned on this trip!
The Multinet is a much higher tech piece of equipment. It contains five different nets each with a cod end. It too is dropped to the same depth as the Bongo, however each net is fired open and closed from the computer at specific depths to allow for a snapshot of the community at different vertical depths.
The Multinet about to be deployed during our night shift.
Copepod research is the focus of the two chief scientists, Russ Hopcroft and Jennifer Questel aboard R/V Tiglax. Much of the research must occur back in the laboratories of the University of Alaska Fairbanks. For example, Jenn’s research focuses on analyzing the biodiversity of copepods in the NGA at the molecular level, using DNA barcoding to identify species and assess population genetics. A DNA barcode is analogous to a barcode you would find on merchandise like a box of cereal. The DNA barcode can be read and this gives a species level identification of the zooplankton. This methodology provides a better resolution of the diversity of planktonic communities because there are many cryptic species (morphologically identical) and early life stages that lack characteristics for positive identification. Her samples collected onboard are carefully stored in ethanol and frozen for transport back to her lab. Her winter will involve countless hours of DNA extraction, sequencing and analysis of the data.
One aspect of the LTER study that Russ is
exploring is how successful certain copepod species are at finding and storing
food. Neocalanus copepods, a dominate species in our collections, are
arthropods that have a life cycle similar to insects. They have two major life forms, they start as
a nauplius, or larval stage, and then metamorphisize into the copepodite form,
in which they take on the more familiar arthropod appearance as they transition
to adulthood. Neocalanus then spends the spring and summer in the NGA feasting on
the rich phytoplankton blooms. They accumulate fat stores, similar to our
Alaska grizzlies. In June, these lipid-rich
animals will settle down into the deep dark depths of the ocean, presumably
where there is less turbulence and predation.
The males die shortly after mating, but the females will overwinter in a
state called diapause, similar to hibernation.
The females do not feed during this period of diapause and thus must
have stock-piled enough lipids to not only survive the next six months, but
also for the critical next step of egg production. Egg production begins in December to January
and after egg release, these females – like salmon – will die as the cycle
begins again.
Part of Russ’s assessment of the Neocalanus is to photograph them in the lab aboard the ship as they are collected. The size of the lipid sac is measured relative to their body size and recorded. If females do not store enough lipids, then the population could be dramatically altered the following season. These organisms that are live sorted on the ship will then be further studied back in the laboratory using another type of molecular analysis to look at their gene expression to understand if they are food-stressed as they come out of diapause.
I watch in awe as Russ is able to manipulate and photograph copepods under a microscope amid the rocking ship.
Two Neocalanus with their lipid sacs visible down the center of the body. Note the difference in the size of the lipid storage between the two.
Back in the UAF laboratory, countless hours must be spent on a microscope by technicians and students analyzing the samples collected onboard. To give an idea of the scope of this work, it takes approximately 4 hours to process one sample. A typical cruise generates 250 samples for morphological analysis to community description, which includes abundance, biomass, life stage, gender, size and body weight information. There are three cruises in a season, and thus the work extends well into the spring. To save time, computers are also used to analyze a subset of the samples which are then checked by a technician. However, at this stage, the computer output does not yet meet the accuracy of a human technician. All of these approaches serve to better understand the health of the zooplankton community in the NGA. Knowing how much zooplankton there is, who is there and how fatty they are, will tell us both the quantity and quality of food available to the fish, seabirds and marine mammals that prey upon them. Significant changes both inter-annually and long-term of zooplankton community composition and abundance could have transformative effects through the food chain. This research provides critical baseline data as stressors, such as a changing climate, continue to impact the NGA ecosystem.
Personal Log
After sheltering in Kodiak harbor overnight Friday, we once again were able to head back out during a break in the weather. We departed Kodiak in blue skies and brisk winds on Saturday.
Sunset over Marmot Island at the start of the Kodiak line on what would end up being our last night of sampling.
We made it to the start of the Kodiak line by
sundown and began our night of sampling with the goal of getting through six
stations. The swells left over from the
last gale were quite challenging, with safety a top priority this evening. Waves were crashing over the top rale as we
worked and the boat pitched side to side.
Walking the corridor from the stern to the bow required precise timing,
lest you get soaked by a breaking wave, as poor Heidi did at least three times.
Despite having to pull the Methot early on one station and skip it all together on another due to the rough seas, we had an amazingly efficient and successful evening. Our team was amazing to work with and Dan captured one last photo of us as we wrapped up our shift at 6am.
The night shift “A Team”: Emily, Jenn, Jen, Cara and Heidi.
The day crew worked fast and furious on the
return to station one as once again, another gale was forecast. This gale was the worst yet, dipping down to
956 millibars in pressure with the word STORM written across the forecast
screen for the entire Gulf of Alaska.
Luckily we were able to make it back into Kodiak harbor by Sunday
evening just as winds and waves began to build.
After riding out the storm overnight we are still waiting for the 4pm
forecast to reassess our final days two days.
The crew grows weary of sitting idle as the precious window for sampling
closes. Stay tuned for a follow up blog
as I return to solid ground on Wednesday!
Did You Know?
Copepods are the most biologically diverse zooplankton and even outnumber the biodiversity of terrestrial insects!
Mission: Northern Gulf of Alaska (NGA) Long-Term Ecological Research (LTER)
Geographic Area of Cruise: Northern Gulf of Alaska
Date: July 3, 2019
Weather Data from the Bridge
Latitude: 58° 54.647’ N Longitude: 146° 00.022’ W Wave Height: 4-5 ft. Wind Speed: 1.9 knots Wind Direction: roughly 90 degrees, but variable Visibility: 1 nm Air Temperature: 13.2 °C Barometric Pressure: 1014.4 mb Sky: Clear, then foggy
Weather overview
We have been fortunate so far to have very calm conditions. Winds have been variable or light and are expected to continue to be so through the weekend at least. Wave heights have generally been about 3 feet, although they’re up to 4-5 feet today, and are expected to drop tomorrow. The calm weather is critical for some of the testing being done, and thus is allowing more to happen.
Science and Technology Log
The focus of all of testing on board is
plankton. As the base of the food web,
all species depend on their health and abundance for survival. There are multiple
teams who are focused on various aspects of plankton and their reaction to
environmental conditions. Kira Monell is
a graduate student at the University of Hawaii at Manoa who is working under
the direction of Dr. Russ Hopcroft while on board. She is studying zooplankton, or the animal
version of plankton. She is specifically
focusing on Neocalanus flemingeri, a
type of sub-arctic copepod. It is
important to study zooplankton because they provide a link between
phytoplankton (the plant version of plankton) and larger fish on the food
web. Copepods are extremely abundant and
varietal, found just about everywhere in the world. They are an important food source for most aquatic
species (they exist in both salt and fresh water). They are a trophic link – a connection in the
food web. Her target species is special
because they mostly eat phytoplankton during the seasonal plankton blooms. They convert their food into a lot of lipids
(fats) and thus are great sources of food and energy for larger fish. After fattening up, they go deep into the
ocean to hibernate around mid-summer.
Kira is specifically focused on the termination
of their hibernation (technically called diapause). She is doing genetic testing to see which
genes are activated or deactivated during this phase of their lives. Messenger ribonucleic acid (or mRNA) coded by
these genes is required to construct the enzymes that cause changes in body
functions, so she is looking at levels of different mRNA in the copepods. She
is expecting to see an increase in genes relating to oogenesis (egg formation). Her female copepods go into diapause ready to
start making eggs, so she expects to see changes in genes relating to egg
growth as they come wake up from diapause.
Kira is examining copepods through three
different experiments. With some
samples, she adds a stain called EDU (a dye that labels cells that are just
about to divide) into her samples and then checks them at 24 hours to see which
cells have divided. Because the copepods
are still alive, she can check back to see what further cell division have
happened over longer periods of time. A
fluorescent microscope is required to see the EDU. Scientists still struggle to understand what
actually triggers emergence from diapause since deep water copepods don’t
experience seasonal light changes, or other potential triggers that might exist
on the surface.
Another thing she is looking at is in-situ
hybridization. She makes a tag that is very
specific for the gene she wants to examine.
When the probe gene is introduced, it attaches to the gene she wants to
look at only if it is being actively copied.
Kira then attaches a colored or fluorescent dye to the probe and in that
way she can track which genes are being expressed in specific areas of the
body.
The third project that she is working on is
trancriptum analysis, which requires building a complete “catalog” that shows all
the RNA used by a species. She can then look at which gene transcripts are
present, and in how abundant they are, so as to compare them to the “average”
version of a transcriptum to see which genes are being turned off and on under
certain conditions.
To obtain samples of copepods, the zooplankton
team, including Kira, uses Calvet nets.
These are four long nets that terminate in collection tubes. Weight is
added to the bottom of the nets and they are submerged off the stern to 100
meters of depth and then pulled back up (a process that takes roughly five
minutes). The nets are then rinsed to
collect the samples in the tubes, which are transferred into jars and brought
to the lab for more detailed sorting and examination.
The Calvet is returning to the surface after being submerged
Kira and Kate rinse the length of the nets to collect their samples in the tubes in the end.
As the Calvet rises you can see the full net. (This video has no dialogue.)
Personal Log
This is the main working deck at the stern of the ship.
Getting prepared to go out on deck safely!
Boots
Hard hat
Life vest
Cat on Deck
All of the sample collection happens on the working deck at the stern of the R/V Sikuliaq or in the adjacent Baltic Room. The back deck is equipped with a variety of cranes and winches that are designed to handle heavy weights and lines under tension. As such, it is critical to wear the proper protective gear when you’re out there: boots (preferably steel-toed), a hard hat and a flotation vest of coat. If there’s a potential to get wet or dirty, rain gear or waterproof bibs are essential to stay dry and relatively clean. Being properly dressed is a process that took getting used to, but now it’s habit. Again, we’re lucky to have had good weather, so the deck is usually warm enough to wear a t-shirt and jeans. I find it calming to be outside, so I am enjoying learning about the sampling methods of other teams by watching and sometimes assisting them. There are also observation decks at the bow that do not require safety gear. A few of us have discovered that the forward decks are much quieter and are good spaces to decompress and look for sea life.
Animals Seen in the Last 24 Hours:
We’ve seen a few species of birds including
black turnstones, glaucous-winged gulls, Black-winged kittiwakes, as well as
deeper water birds such as storm petrels and shearwaters. In addition, there have been small pods of
dolphins in the distance and one humpback whale (all we saw was the tail).
Mission: Northern Gulf of Alaska Long-Term Ecological Research project
Geographic Area of Cruise: Northern Gulf of Alaska – currently in transit from ‘Seward Line’ to ‘Kodiak Line’
Date: May 5, 2019
Weather Data from the Bridge
Time: 2305
Latitude: 57o 34.6915’
Longitude: 150o 06.9789’
Wind: 18 knots, South
Seas: 4-6 feet
Air Temperature: 46oF (8oC)
Air pressure: 1004 millibars
Cloudy, light rain
Science and Technology Log
I was going to just fold the information about mixotrophs into the phytoplankton blog, but this is so interesting it deserves its own separate blog!
On land, there are plants that photosynthesize to make their own food. These are called autotrophs – self-feeding. And there are animals that feed on other organisms for food – these are called heterotrophs – other-feeding. In the ocean, the same is generally assumed. Phytoplankton, algae, and sea grasses are considered autotrophs because they photosynthesize. Zooplankton, fish, birds, marine mammals, and benthic invertebrates are considered heterotrophs because they feed on photosynthetic organisms or other heterotrophs. They cannot make their own food. But it turns out that the line between phytoplankton and zooplankton is blurry and porous. It is in this nebulous area that mixotrophs take the stage!
Mixotrophs are organisms that can both photosynthesize and feed on other organisms. There are two main strategies that lead to mixotrophy. Some organisms, such as species of dinoflagellate called Ceratium, are inherently photosynthetic. They have their own chloroplasts and use them to make sugars. But, when conditions make photosynthesis less favorable or feeding more advantageous, these Ceratium will prey on ciliates and/or bacteria. Bacteria are phosphorous, nitrogen, and iron rich so it is beneficial for Ceratium to feed on them at least occasionally. Microscopy work makes it possible to see the vacuole filled with food inside the photosynthetic Ceratium.
I created this drawing after viewing a number of microscopy photos of the mixotrophic dinoflagellate Ceratium under different lights and stains. This artistic rendition combines those different views to show the outside structure of the dinoflagellate as well as the nucleus, food vacuole and chloroplasts. (Drawing by Katie Gavenus)
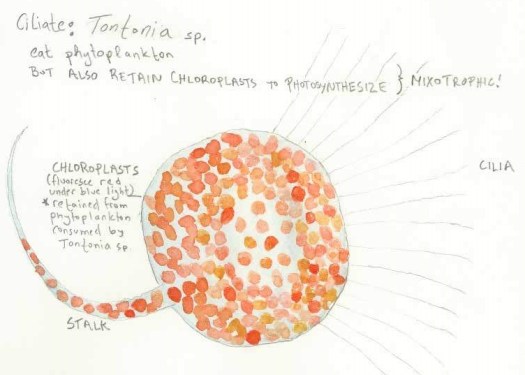
Other organisms, including many ciliates, were long known to be heterotrophic. They feed on other organisms, and it is particularly common for them to eat phytoplankton and especially cryptophyte algae. Recent research has revealed, however, that many ciliates will retain rather than digest the chloroplasts from the phytoplankton they’ve eaten and use them to photosynthesize for their own benefit. Viewing these mixotrophs under blue light with a microscope causes the retained chloroplasts to fluoresce. I saw photos of them and they are just packed with chloroplasts!
The mixotrophic ciliate Tontonia sp. eats phytoplankton but retains the chloroplasts from their food in order to photosynthesize on their own! I made this drawing based off of photos, showing both the outside structure of the Tontonia and how the chloroplasts fluoresce as red when viewed with blue light. (Drawing by Katie Gavenus)
Mixotrophs are an important part of the Gulf of Alaska ecosystem. They may even help to explain how a modestly productive ecosystem (in terms of phytoplankton) can support highly productive upper trophic levels. Mixotrophy can increase the efficiency of energy transfer through the trophic levels, so more of the energy from primary productivity supports the growth and reproduction of upper trophic levels. They also may increase the resiliency of the ecosystem, since these organisms can adjust to variability in light, nutrients, and phytoplankton availability by focusing more on photosynthesis or more on finding prey. Yet little is known about mixotrophs. Only about one quarter of the important mixotroph species in the Gulf of Alaska have been studied in any way, shape or form!
Researchers are trying to determine what kinds of phytoplankton the mixotrophic ciliates and dinoflagellates are retaining chloroplasts from. They are also curious whether this varies by location, season or year. Understanding the conditions in which mixotrophic organisms derive energy from photosynthesis and the conditions in which they choose to feed is another area of research focus, especially because it has important ramifications for carbon and nutrient cycling and productivity across trophic levels. And it is all very fascinating!
A drawing illustrating a fascinating, tightly linked portion of the Gulf of Alaska food web. Mesodinium rubrum must eat cryptophyte algae (this is called obligate feeding). The Mesodinium rubrum retain the chloroplasts from the cryptophyte algae, using them to supplement their own diet through photosynthesis. In turn, Dinophysis sp. must feed on Mesodinium rubrum. And the Dinophysis retain the chloroplasts from the Mesodinium that originally were from cryptophyte algae! (Drawing by Katie Gavenus)
Did you know?
Well over half of the oxygen on earth comes from photosynthetic organisms in the ocean. So next time you take a breath, remember to thank phytoplankton, algae, and marine plants!
Personal Log:
Tonight was likely our last full night of work, as we expect rough seas and high winds will roll in around midnight tomorrow and persist until the afternoon before we head back to Seward. We were able to get bongo net sampling completed at 6 stations along the Kodiak Line, and hope that in the next two nights we can get 2-4 stations done before the weather closes in on us and 2-4 nets on the last evening as we head back to Seward.
Despite our push to get 6 stations finished tonight, we took time to look more closely at one of the samples we pulled up. It contained a squid as well as a really cool parasitic amphipod called Phronima that lives inside of a gelatinous type of zooplankton called doliolids. Check out the photos and videos below for a glimpse of these awesome creatures (I couldn’t figure out how to mute the audio, but I would recommend doing that for a less distracting video experience).
A parasitic Phronima amphipod. This animal typically lives inside doliolids, a type of gelatinous zooplankton. Apparently its body structure and fierce claw-like appendages inspired the design of “Predator.”
Mission: Northern Gulf of Alaska Long-Term Ecological Research project
Geographic Area of Cruise: Northern Gulf of Alaska – currently on the ‘Middleton [Island] Line’
Date: April 28, 2019
Weather Data from the Bridge
Time: 1715
Latitude: 59o 39.0964’ N
Longitude: 146o05.9254’ W
Wind: Southeast, 15 knots
Air Temperature: 10oC (49oF)
Air pressure: 1034 millibars
Cloudy, no precipitation
Science and Technology Log
Yesterday was my first full day at sea, and it was a special one! Because each station needs to be sampled both at night and during the day, coordinating the schedule in the most efficient way requires a lot of adjustments. We arrived on the Middleton Line early yesterday afternoon, but in order to best synchronize the sampling, the decision was made that we would wait until that night to begin sampling on the line. We anchored near Middleton Island and the crew of R/V Tiglax ferried some of us to shore on the zodiac (rubber skiff).
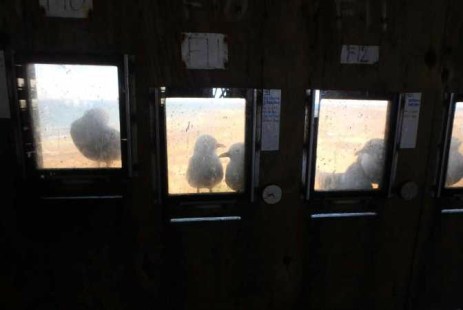
This R&R trip turned out to be incredibly interesting and relevant to the research taking place in the LTER. An old radio tower on the island has been slowly taken over by seabirds… and seabird scientists. The bird biologists from the Institute for Seabird Research and Conservation have made modifications to the tower so that they can easily observe, study, and band the black-legged kittiwakes and cormorants that choose to nest on the shelfboards they’ve augmented the tower with. We were allowed to climb up into the tower, where removable plexi-glass windows look out onto each individual pair’s nesting area. This early in the season, the black-legged kittiwakes are making claims on nesting areas but have not yet built nests. Notes written above each window identified the birds that nested there last season, and we were keen to discern that many of the pairs had returned to their spot.
Black-legged kittiwakes are visible through the observation windows in the nesting tower on Middleton Island.
Nesting tower on Middleton Island.
The lead researcher on the Institute for Seabird Research and Conservation (ISRC) project was curious about what the LTER researchers were finding along the Middleton Line stations. He explained that the birds “aren’t happy” this spring and are traveling unusually long distances and staying away for multiple days, which might indicate that these black-legged kittiwakes are having trouble finding high-quality, accessible food. In particular, he noted that he hasn’t seen any evidence they’ve been consuming the small lantern fish (myctophids) that generally are an important and consistent food source from them in the spring. These myctophids tend to live offshore from Middleton Island and migrate to the surface at night. We’ll be sampling some of that area tonight, and I am eager to see if we might catch any in the 0.5 mm mesh ‘bongo’ nets that we use to sample zooplankton at each station.
The kittiwakes feed on myctophids. The myctophids feed on various species of zooplankton. The zooplankton feed on phytoplankton, or sometimes microzooplankton that in turn feeds on phytoplankton. The phytoplankton productivity is driven by complex interactions of environmental conditions, impacted by factors such as light availability, water temperature and salinity as well as the presence of nutrients and trace metals. And these water conditions are driven by abiotic factors – such as currents, tides, weather, wind, and freshwater input from terrestrial ecosystems – as well as the biotic processes that drive the movement of carbon, nutrients, and metals through the ecosystem.
This CTD instrument and water sampling rosette is deployed at each station during the day to collect information about temperature and salinity. It also collects water that is analyzed for dissolved oxygen, nitrates, chlorophyll, dissolved inorganic carbon, dissolved organic carbon, and particulates.
When the sun sets, the CTD gets a break, and the night crew focuses on zooplankton.
Part of the work of the LTER is to understand the way that these complex factors and processes influence primary productivity, phytoplankton, and the zooplankton community structure. In turn, inter-annual or long-term changes in phytoplankton and zooplankton community structure likely have consequences for vertebrates in and around the Gulf of Alaska, like seabirds, fish, marine mammals, and people. In other words, zooplankton community structure is one piece of understanding why the kittiwakes are or are not happy this spring. It seems that research on zooplankton communities requires, at least sometimes, to consider the perspective of a hungry bird.
Peering at a jar of copepods and euphausiids (two important types of zooplankton) we pulled up in the bongo nets last night, I was fascinated by the way they look and impressed by the amount of swimming, squirming life in the jar. My most common question about the plankton is usually some variation of “Is this …” or “What is this?” But the questions the LTER seeks to ask are a little more complex.
Considering the copepods and euphausiids, these researchers might ask, “How much zooplankton is present for food?” or “How high of quality is this food compared to what’s normal, and what does that mean for a list of potential predators?” or “How accessible and easy to find is this food compared to what’s normal, and what does that mean for a list of potential predators?” They might also ask “What oceanographic conditions are driving the presence and abundance of these particular zooplankton in this particular place at this particular time?” or “What factors are influencing the life stage and condition of these zooplankton?”
Euphausiids (also known as krill) are among the types of zooplankton we collected with the bongo nets last night.
Small copepods are among the types of zooplankton we collected with the bongo nets last night.
As we get ready for another night of sampling with the bongo nets, I am excited to look more closely at the fascinating morphology (body-shape) and movements of the unique and amazing zooplankton species. But I will also keep in mind some of the bigger picture questions of how these zooplankton communities simultaneously shape, and are shaped by, the dynamic Gulf of Alaska ecosystem. Over the course of the next 3 blogs, I plan to focus first on zooplankton, then zoom in to primary production and phytoplankton, and finally dive more into nutrients and oceanographic characteristics that drive much of the dynamics in the Gulf of Alaska.
Personal Log
Life on the night shift requires a pretty abrupt change in sleep patterns. Last night, we started sampling around 10 pm and finished close to 4 am. To get our bodies more aligned with the night schedule, the four of us working night shift tried to stay up for another hour or so. It was just starting to get light outside when I headed to my bunk. Happily, I had no problem sleeping until 2:30 this afternoon! I’m hoping that means I’m ready for a longer night tonight, since we’ll be deploying the bongo nets in deeper water as we head offshore along the Middleton Line.
While on Middleton Island, we marveled at a WWII shipwreck that has been completely overtaken by seabirds for nesting.
Inputs of seabird guano, over time, have fertilized the growth of interesting lichens, mosses, grasses, and even shrubs on the sides and top of the rusty vessel.
Did You Know?
Imagine you have a copepod that is 0.5 mm long and a copepod that is 1.0 mm long. Because the smaller copepod is half as big in length, height, and width, overall that smaller copepod at best offers only about 1/8th as much food for a hungry animal. And that assumes that it is as calorie-dense as the larger copepod.
Question of the Day:
Are PCBs biomagnifying in top marine predators in the Gulf of Alaska? Are there resident orca populations in Alaska that are impacted in similar ways to the Southern Resident Orca Whale population [in Puget Sound] (by things like toxins, noise pollution, and decreasing salmon populations? Is it possible for Southern Resident Orca Whales to migrate and successfully live in the more remote areas of Alaska?Questions from Lake Washington Girl’s Middle School 6th grade science class.
These are great questions! No one on board has specific knowledge of this, but they have offered to put me in contact with researchers that focus on marine mammals, and orcas specifically, in the Gulf of Alaska. I’ll keep you posted when I know more!
Mostly cloudy, winds southerly 20 knots, waves to eight feet
57.56 N, 147.56 W (in transit from Gulf of Alaska Line to Kodiak Line)
Science Log
What Makes Up an Ecosystem? Part III Zooplankton
The North Gulf of Alaska Long-term Ecological Research Project collects zooplankton in several different ways. The CalVET Net is dropped vertically over the side of the boat to a depth of 100 meters and then retrieved. This net gives researchers a vertical profile of what is going on in the water column. The net has very fine mesh in order to collect very small plankton. Some of these samples are kept alive for later experiments. Others are preserved in ethanol for later genetic analysis. One of the scientists aboard is interested in the physiological details of what makes copepods thrive or not. Copepods are so important to the food webs of the Gulf of Alaska, that their success or failure can ultimately determines the success or failure of many other species in the ecosystem. When “the blob” hit the Gulf of Alaska in 2014-2016, thousands and thousands of sea birds died. During those same years, copepods were shown to be less successful in their growth and egg production.
Chief Scientist Russ Hopcroft prepping the Multi-net
The second net used to collect zooplankton is the Multi-net. We actually use two different Multi-nets. The first is set up to do a vertical profile. In the morning, it’s dropped vertically behind the boat. Four or five times a night, we tow the second Multi-net horizontally while the boat moves slowly forward at two knots. This allows us to collect a horizontal profile of plankton at specific depths. If the water depth is beyond 200 meters, we will lower the net to that depth and open the first net. The first net samples between 200 and 100 meters, above 100 meters we open the second net. As we go up each net is opened in decreasing depth increments, the last one being very close to the surface. Once the net is retrieved, we wash organisms down into the cod end, remove the cod end, and preserve the samples in glass jars with formalin. In a busy night, we may put away twenty-five pint-sized samples of preserved zooplankton. When those samples go back to Fairbanks they have to be hand-sorted by a technician to determine the numbers and relative mass of each species. We are talking hours and hours of time spend looking through a microscope. One night of work on the Tiglax may produce one month of work for technicians in the lab.
Underwater footage of a Multi-net triggering.
The last type of net we use is a Bongo net. Its steel frame looks like the frame of large bongo drums. Hanging down behind the frame is two fine mesh nets, approximately seven feet long terminating in a hard plastic sieve or cod end. Different lines use different nets based on the specific questions researchers have for that transect line or the technique used on previous years transects. To maintain a proper time series comparison from year to year, techniques and tools have to stay consistent.
A cod end
I’ve spent a little bit of time under the microscope looking at some of the zooplankton samples we have brought in. They are amazingly diverse. The North Gulf of Alaska has two groups of zooplankton that can be found in the greatest abundance: copepods and euphausiids (krill.) These are food for most other animals in the North Gulf of Alaska. Fish, seabirds, and baleen whales all eat them. Beyond these two, I was able to observe the beating cilia of ctenophores and the graceful flight of pteropods or sea angels, the ghost-like arrow worms, giant-eyed amphipods, and dozens of others.
Deep sea squid, an example of a vertical migrator caught in our plankton trawls
By far my favorite zooplankton to watch under the microscope was the larvae of the goose neck barnacle. Most sessile marine organisms spend the early, larval stage of their lives swimming amongst the throngs of migrating zooplankton. Barnacles are arthropods, which are defined by their exoskeletons and segmented appendages. Most people would recognize barnacles encrusting the rocks of their favorite coastline, but when I show my students videos of barnacles feeding most are surprised to see the delicate feeding structures and graceful movements of this most durable intertidal creature. When submerged, barnacles open their shells and scratch at particles in the water with elongated combs that are really analogous to legs. The larva of the goose neck barnacle has profusely long feeding appendages and a particularly beautiful motion as it feeds.
We have to “fish” for zooplankton at night for two reasons. The first is logistical. Some work needs to get done at night when the winch is not being used by the CTD team. The second is biological. Most of the zooplankton in this system are vertical migrators. They rise each night to feed on phytoplankton near the surface and then descend back down to depth to avoid being seen in the daylight by their predators. This vertical migration was first discovered by sonar operators in World War II. While looking for German U-boats, it was observed that the ocean floor itself seemed to “rise up” each night. After the war, better techniques were developed to sample zooplankton, and scientists realized that the largest animal migration on Earth takes place each night and each morning over the entirety of the ocean basins.
One of my favorite videos on plankton.
Personal Log
The color of water
This far offshore, the water we are traveling through is almost perfectly clear, yet the color of the ocean seems continuously in flux. Today the sky turned gray and so did the ocean. As the waves come up, the texture of the ocean thickens and the diversity of reflection and refraction increases. Look three times in three directions, and you will see three hundred different shades of grey or blue. If the sun or clouds change slightly, so does the ocean.
The sea is anything but consistent. Rips or streaks of current can periodically be seen separating the ocean into distinct bodies. So far in our trip, calm afternoons have turned into windy and choppy evenings. Still, the crew tells me that by Gulf of Alaska standards, we are having amazing weather.
Variations in water texture created by currents in the Gulf of Alaska.
Did You Know?
The bodies of puffins are much better adapted to diving than flying. A puffin with a full belly doesn’t fly to get out of the way of the boat so much as butterfly across the surface of the water. Michael Phelps has nothing on a puffin flapping its way across the surface of the water.
Animals Seen Today
Fin and sperm whales in the distance
Storm Petrels, tufted puffins, Laysan and black-footed and short-tailed albatross, flesh footed shearwaters
This map on the bridge helps everyone keep track of where we are and where we are headed next.
Science and Technology Log
At each sampling site, we take two types of samples. First, we dip what are called bongo nets into the water off of the side of the boat. These nets are designed to collect plankton. Plankton are tiny organisms that float in the water. Then, we release long nets off of the back of the boat to take a fish sample. There is a variety of fish that get collected. However, the study targets five species, one of which is juvenile walleye pollock, Gadus chalcogrammus. These fish are one of the most commercially fished species in this area. I will go into more detail about how the fish samples are collected in a future post. For now, I am going to focus on how plankton samples are collected and why they are important to this survey.
Juvenile walleye pollock are fish that are only a few inches long. These fish can grow to much larger sizes as they mature.
As you can see in the photos below, the bongo nets get their name because the rings that hold the nets in place resemble a set of bongo drums. The width of the nets tapers from the ring opening to the other end. This shape helps funnel plankton down the nets and into the collection pieces found at the end of the nets. These collection devices are called cod ends.
Bongo nets being lowered into the water off of the side of the ship.
This is the collection end, or cod end, of the bongo nets.
This study uses two different size bongo nets. The larger ones are attached to rings that are 60 centimeters in diameter. These nets have a larger mesh size at 500 micrometers. The smaller ones are attached to rings that are 20 centimeters in diameter and have a smaller mesh size at 150 micrometers. The different size nets help us take samples of plankton of different sizes. While the bongo nets will capture some phytoplankton (plant-like plankton) they are designed to mainly capture zooplankton (animal-like plankton). Juvenile pollock eat zooplankton. In order to get a better understanding of juvenile pollock populations, it is important to also study their food sources.
Here I am, helping to bring the bongo nets back on to the ship.
Once the bongo nets have been brought back on board, there are two different techniques used to assess which species of zooplankton are present. The plankton in nets #1 of both the small and large bongo are placed in labeled jars with preservatives. These samples will be shipped to a lab in Poland once the boat is docked. Here, a team will work to identify all the zooplankton in each jar. We will probably make it to at least sixty sampling sites on the first leg of this survey. That’s a lot of zooplankton!
A jar of preserved zooplankton is ready to be identified.
The other method takes place right on the ship and is called rapid zooplankton assessment (RZA). In this method, a scientist will take a small sample of what was collected in nets #2 of both the small and large bongos. The samples are viewed under a microscope and the scientist keeps a tally of which species are present. This number gives the scientific team some immediate feedback and helps them get a general idea about which species of zooplankton are present. Many of the zooplankton collected are krill, or euphausiids, and copepods. One of the most interesting zooplankton we have sampled are naked pteropods, or sea angels. This creature has structures that look very much like a bird’s wings! We also saw bioluminescent zooplankton flash a bright blue as we process the samples. Even though phytoplankton is not a part of this study, we also noticed the many different geometric shapes of phytoplankton called diatoms.
A naked pteropod, or sea angel, as seen through the microscope.
Personal Log
Both the scientific crew and the ship crew work one of two shifts. Everyone works either midnight to noon or noon to midnight. I have been lucky enough to work from 6am – 6pm. This means I get the chance to work with everyone on board at different times of the day. It has been really interesting to learn more about the different ship crew roles necessary for a survey like this to run smoothly. One of the more fascinating roles is that of the survey crew. Survey crew members act as the main point of communication between the science team and the ship crew. They keep everyone informed about important information throughout the day as well as helping out the science team when we are working on a sample. They are responsible for radioing my favorite catchphrase to the bridge and crew, “bongos in the water.”
A sign of another great day on the Gulf of Alaska.
Did You know?
You brush your teeth with diatoms! The next time you brush your teeth, take a look at the ingredients on your tube of toothpaste. You will see “diatomaceous earth” listed. Diatomaceous earth is a substance that contains the silica from ancient diatoms. Silica gives diatoms their rigid outer casings, allowing them to have such interesting geometric shapes. This same silica also helps you scrub plaque off of your teeth!
Geographic Area of Cruise: Pacific Ocean from Newport, OR to Port Angeles, WA
Date: 8/19/2017
Latitude: 48.59 N
Longitude: 126.59 W
Wind Speed: 15 knots
Barometric Pressure: 1024.05 mBars
Air Temperature: 59 F
Weather Observations: Sunny
Science and Technology Log:
You wouldn’t expect us to find tropical sea creatures up here in Canadian waters, but we are! We have a couple scientists on board who are super interested in a strange phenomenon that’s been observed lately. Pyrosomes (usually found in tropical waters) are showing up in mass quantities in the areas we are studying. No one is positive why pyrosomes are up here or how their presence might eventually affect the marine ecosystems, so scientists are researching them to figure it out. One of the scientists, Olivia Blondheim, explains a bit about this: “Pyrosomes eat phytoplankton, and we’re not sure yet how such a large bloom may impact the ecosystem overall. We’ve already seen that it’s affecting fishing communities because their catches have consisted more of pyrosomes than their target species, such as in the shrimp industry.”
Sorting through a bin of pyrosomes
Pyrosomes are a type of tunicate, which means they’re made up of a bunch of individual organisms. The individual organisms are called zooids. These animals feed on phytoplankton, and it’s very difficult to keep them alive once they’re out of the water. We have one alive in the wet lab right now, though, so these scientists are great at their jobs.
We’ve found lots of pyrosomes in our hake trawls, and two of our scientists have been collecting a lot of data on them. The pyrosomes are pinkish in color and feel bumpy. Honestly, they feel like the consistency of my favorite candy (Sour Patch Kids). Now I won’t be able to eat Sour Patch Kids without thinking about them. Under the right conditions, a pyrosome will bioluminesce. That would be really cool to see, but the conditions have to be perfect. Hilarie (one of the scientists studying them) is trying to get that to work somehow before the trip is over, but so far we haven’t been able to see it. I’ll be sure to include it in the blog if she gets it to work!
One of the things that’s been interesting is that in some trawls we don’t find a single pyrosome, and in other trawls we see hundreds. It really all depends on where we are and what we’re picking up. A lot of research still needs to be done on these organisms and their migration patterns, and it’s exciting to be a small part of that.
Personal Log:
The science crew continues to work well together and have a lot of fun! Last night we had an ice cream sundae party after dinner, and I was very excited about the peanut butter cookie dough ice cream. My friends said I acted more excited about that than I did about seeing whales (which is probably not true. But peanut butter cookie dough ice cream?! That’s genius!). After our ice cream sundaes, we went and watched the sunset up on the flying bridge. It was gorgeous, and we even saw some porpoises jumping in the distance.
It was the end to another exciting day. My favorite part of the day was probably the marine mammal watch where we saw all sorts of things, but I felt bad because I know that our chief scientist was hoping to fish on that spot. Still, it was so exciting to see whales all around our ship, and some sea lions even came and swam right up next to us. It was even more exciting than peanut butter cookie dough ice cream, I promise. Sometimes I use this wheel to help me identify the whales:
Whale identification wheel
Now we’re gearing up for zooplankton day. We’re working in conjunction with the Nordic Pearl, a Canadian vessel, and they’ll be fishing on the transects for the next couple days. That means we’ll be dropping vertical nets and doing some zooplankton studies. I’m not exactly sure what that will entail, but I’m excited to learn about it! So far the only zooplankton I’ve seen is when I was observing my friend Tracie. She was looking at phytoplankton on some slides and warned me that sometimes zooplankton dart across the phytoplankton. Even though she warned me, it totally startled me to see this giant blob suddenly “run” by all the phytoplankton! Eeeeep! Hopefully I’ll get to learn a lot more about these creatures in the days coming up.
The CTD (conductivity, temperature, depth) array is another important tool. It goes down at each station, which means data is captured ten-twelve times a day. It drops 50 m/min so it only takes minutes to reach the bottom where other winch/device systems can take an hour to do the same. This array scans eight times per second for the following environmental factors:
Depth (m)
Conductivity (converts to salinity in ppt)
Temperature (C)
Dissolved oxygen (mg/mL)
Transmissivity (%)
Fluorescence (mg/m^3)
Descent rate (m/sec)
Sound velocity (m/sec)
Density (kg/m^3)
There are two sensors for most readings and the difference between them is shown in real time and recorded. For example, the dissolved oxygen sensor is most apt to have calibration issues. If the two sensors are off each other by 0.1 mg/L then something needs to be done.
Software programs filter the data to cut out superfluous numbers such as when the CTD is acclimating in the water for three minutes prior to diving. Another program aligns the readings when the water is working through the sensors. Since a portion of water will reach one sensor first, then another, then another, and so on, the data from each exact portion of water is aligned with each environmental factor. There are many other sophisticated software programs that clean up the data for use besides these two.
These readings are uploaded to the Navy every twelve hours, which provides almost real-time data of the Gulf. The military uses this environmental data to determine how sound will travel through sound channels by locating thermoclines as well as identifying submarines. NOAA describes a thermocline as, “the transition layer between warmer mixed water at the ocean’s surface and cooler deep water below.” Sound channels are how whales are able to communicate over long distances.
This “channeling” of sound occurs because of the properties of sound and the temperature and pressure differences at different depths in the ocean. (NOAA)
The transmissometer measures the optical properties of the water, which allows scientists to track particulates in the water. Many of these are clay particles suspended in the water column. Atmospheric scientists are interested in particulates in the air and measure 400 m. In the water, 0.5 m is recorded since too many particulate affects visibility very quickly. This affects the cameras since light reflecting off the clay can further reduce visibility.
Fluorescence allows scientists to measure chlorophyll A in the water. The chlorophyll molecule is what absorbs energy in photosynthetic plants, algae, and bacteria. Therefore, it is an indicator of the concentration of organisms that make up the base of food chains. In an ecosystem, it’s all about the little things! Oxygen, salinity, clay particles, photosynthetic organisms, and more (most we can not actually see), create a foundation that affects the fish we catch more than those fish affect the little things.
The relationship between abiotic (nonliving) and biotic (living) factors is fascinating. Oxygen is a great example. When nitrates and phosphates wash down the Mississippi River from the breadbasket of America, it flows into the Gulf of Mexico. These nutrients can make algae go crazy and lead to algae blooms. The algae then use up the oxygen, creating dead zones. Fish can move higher up the water column or away from the area, but organisms fixed to the substrate (of which there are many in a reef system) can not. Over time, too many algae blooms can affect the productivity of an area.
Salt domes were created millions of years ago when an ancient sea dried up prior to reflooding into what we have today. Some salt domes melted and pressurized into super saline water, which sinks and pools. These areas create unique microclimates suitable to species like some mussels. A microclimate is a small or restricted area with a climate unique to what surrounds it.
The ship’s sonar revealing a granite spire a camera array was deployed on.
Another great example is how geology affects biology. Some of these salt domes collapsed leaving granite spires 30-35 meters tall and 10 meters across. These solid substrates create a magical biological trickle down effect. The algae and coral attach to the hard rock, and soon bigger and bigger organisms populate this microclimate. Similar microclimates are created in the Gulf of Mexico from oil rigs and other hard surfaces humans add to the water.
Jillian’s net also takes a ride with the CTD. She is a PhD student at Texas A&M University studying the abundance and distribution of zooplankton in the northern Gulf of Mexico because it is the primary food source of some commercially important larval fish species. Her net is sized to capture the hundreds of different zooplankton species that may be populating the area. The term zooplankton comes from the Greek zoo (animal) and planktos (wanderer/drifter). Many are microscopic, but Jillian’s samples reveal some translucent critters you can see with the naked eye. Her work and the work of others like her ensures we will have a deeper understanding of the ocean.
This slideshow requires JavaScript.
Personal Log
Prior to this I had never been to the Gulf of Mexico other than on a cruise ship (not exactly the place to learn a lot of science). It has been unexpected to see differences and parallels between the Gulf of Mexico and Gulf of Maine, which I am more familiar. NOAA scientist, John, described the Gulf to me as, “a big bathtub.” In both, the geology of the area, which was formed millions of years ago, affects that way these ecosystems run.
Quote of the Day: Jillian: “Joey, are we fishing at this station?” Joey: “I dunno. I haven’t had my coffee yet.” Jillian: “It’s 3:30 in the afternoon!”
Did You Know?
Zooplankton in the Gulf of Mexico are smaller than zooplankton in the Gulf of Maine. Larger species are found in colder water.
NOAA Teacher at Sea
Michael Wing
Aboard R/V Fulmar
July 17 – 25, 2015
Mission: 2015 July ACCESS Cruise Geographical Area of Cruise: Pacific Ocean west of Bodega Bay, California Date: July 22, 2015
Weather Data from the Bridge: Northwest wind 15-25 knots, wind waves 3’-5’, northwest swell 4’ – 6’ at eight seconds, overcast.
Science and Technology Log
UC Davis graduate student and Point Blue Conservation Science intern Kate Davis took some plankton we collected to the Bodega Marine lab in Bodega Bay. She said she is seeing “tropical” species of plankton. A fellow graduate student who is from Brazil peeked into the microscope and said the plankton looked like what she sees at home in Brazil. The flying fish we saw is also anomalous, as is the number of molas (ocean sunfish) we are seeing. Plankton can’t swim, so some of our water must have come from a warm place south or west of us.
The Farallon Islands are warmer this year
The surface water is several degrees warmer than it normally is this time of year. NOAA maintains a weather buoy near Bodega Bay, California that shows this really dramatically. Click on this link – it shows the average temperature in blue, one standard deviation in gray (that represents a “normal” variation in temperatures) and the actual daily temperature in red.
Surface seawater temperatures from a NOAA buoy near Bodega Bay, California
As you can see, the daily temperatures were warm last winter and basically normal in the spring. Then in late June they shot up several degrees, in a few days and have stayed there throughout this month. El Niño? Climate change? The scientists I am with say it’s complicated, but at least part of what is going on is due to El Niño.
San Francisco State University student and Point Blue intern Ryan Hartnett watches El Nino
So what exactly is El Niño?
My students from last year know that the trade winds normally push the surface waters of the world’s tropical oceans downwind. In the Pacific, that means towards Asia. Water wells up from the depths to take its place on the west coasts of the continents, which means that places like Peru have cold water, lots of fog, and good fishing. The fishing is good because that deep water has lots of nutrients for phytoplankton growth like nitrate and phosphate (fertilizer, basically) and when it hits the sunlight lots of plankton grow. Zooplankton eat the phytoplankton; fish eat the zooplankton, big fish eat little fish and so on.
During an El Niño event, the trade winds off the coast of Peru start to weaken and that surface water bounces back towards South America. This is called a Kelvin wave. Instead of flowing towards Asia, the surface water in the ocean sits there in the sunlight and it gets warmer. There must be some sort of feedback mechanism that keeps the trade winds weak, but the truth is that nobody really understands how El Niño gets started. We just know the signs, which are (1) trade winds in the South Pacific get weak (2) surface water temperatures in the eastern tropical pacific rise, (3) the eastern Pacific Ocean and its associated lands get wet and rainy, (4) the western Pacific and places like Australia, Indonesia, and the Indian Ocean get sunny and dry.
This happens every two to seven years, but most of the time the effect is weak. The last time we had a really strong El Niño was 1997-1998, which is when our current cohort of high school seniors was born. That year it rained 100 inches in my yard, and averaged over an inch a day in February! So, even though California is not in the tropics we feel its effects too.
Sunset from the waterfront in Sausalito, California
We are in an El Niño event now and NOAA is currently forecasting an excellent chance of a very strong El Niño this winter.
Sea surface temperature anomalies Summer 2015. Expect more red this winter.
What about climate change and global warming? How is that related to El Niño? There is no consensus on that; we’ve always had El Niño events and we’ll continue to have them in a warmer world but it is possible they might be stronger or more frequent.
Personal Log
So, is El Niño a good thing? That’s not a useful question. It’s a part of our climate. It does make life hard for the seabirds and whales because that layer of warm water at the surface separates the nutrients like nitrate and phosphate, which are down deep, from the sunlight. Fewer phytoplankton grow, fewer zooplankton eat them, there’s less krill and fish for the birds and whales to eat. However, it might help us out on land. California’s drought, which has lasted for several years now, may end this winter if the 2015 El Niño is as strong as expected.
Rain will come again to California
Did You Know? El Niño means “the boy” in Spanish. It refers to the Christ child; the first signs of El Niño usually become evident in Peru around Christmas, which is summer in the southern hemisphere. The Spanish in colonial times were very fond of naming things after religious holidays. You can see that in our local place names. For instance, Marin County’s Point Reyes is named after the Feast of the Three Kings, an ecclesiastical holy day that coincided with its discovery by the Spanish. There are many other examples, from Año Nuevo on the San Mateo County coast to Easter Island in Chile.
Michael Wing takes a selfie in his reflection in the boat’s window
NOAA Teacher at Sea
Michael Wing
Aboard R/V Fulmar
July 17 – 25, 2015
Mission: 2015 July ACCESS Cruise Geographical Area of Cruise: Pacific Ocean west of Marin County, California Date: July 20, 2015
Weather Data from the Bridge: 15 knot winds gusting to 20 knots, wind waves 3-5’ and a northwest swell 3-4’ four seconds apart.
Science and Technology Log
On the even-numbered “lines” we don’t just survey birds and mammals. We do a lot of sampling of the water and plankton.
Wing at rail of the R/V Fulmar
We use a CTD (Conductivity – Temperature – Depth profiler) at every place we stop. We hook it to a cable, turn it on, and lower to down until it comes within 5-10 meters of the bottom. When we pull it back up, it has a continuous and digital record of water conductivity (a proxy for salinity, since salty water conducts electricity better), temperature, dissolved oxygen, fluorescence (a proxy for chlorophyll, basically phytoplankton), all as a function of depth.
Kate and Danielle deploy the CTD
We also have a Niskin bottle attached to the CTD cable. This is a sturdy plastic tube with stoppers at both ends. The tube is lowered into the water with both ends cocked open. When it is at the depth you want, you clip a “messenger” to the cable. The messenger is basically a heavy metal bead. You let go, it slides down the cable, and when it strikes a trigger on the Niskin bottle the stoppers on both ends snap shut. You can feel a slight twitch on the ship’s cable when this happens. You pull it back up and decant the seawater that was trapped at that depth into sample bottles to measure nitrate, phosphate, alkalinity, and other chemical parameters back in the lab.
Niskin bottle
When we want surface water, we just use a bucket on a rope of course.
We use a hoop net to collect krill and other zooplankton. We tow it behind the boat at a depth of about 50 meters, haul it back in, and wash the contents into a sieve, then put them in sample bottles with a little preservative for later study. We also have a couple of smaller plankton nets for special projects, like the University of California at Davis graduate student Kate Davis’s project on ocean acidification, and the plankton samples we send to the California Department of Health. They are checking for red tides.
Hoop net
We use a Tucker Trawl once a day on even numbered lines. This is a heavy and complicated rig that has three plankton nets, each towed at a different depth. It takes about an hour to deploy and retrieve this one; that’s why we don’t use it each time we stop. The Tucker trawl is to catch krill; which are like very small shrimp. During the day they are down deep; they come up at night.
Part of the Tucker trawl
A mass of krill we collected. The black dots are their eyes.
What happens to these samples? The plankton from the hoop net gets sent to a lab where a subsample is taken and each species in the subsample is counted very precisely. The CTD casts are shared by all the groups here – NOAA, Point Blue Conservation Science, the University of California at Davis, San Francisco State University. The state health department gets its sample. San Francisco State student Ryan Hartnett has some water samples he will analyze for nitrate, phosphate and silicate. All the data, including the bird and mammal sightings, goes into a big database that’s been kept since 2004. That’s how we know what’s going on in the California Current. When things change, we’ll recognize the changes.
Personal Log
They told me “wear waterproof pants and rubber boots on the back deck, you’ll get wet.” I thought, how wet could it be? Now I understand. It’s not that some water drips on you when you lift a net up over the stern of the boat – although it does. It’s not that waves splash you, although that happens too. It’s that you use a salt water hose to help wash all of the plankton from the net into a sieve, and then into a container, and to fill wash bottles and to wash off the net, sieve, basins, funnel, etc. before you arrive at the next station and do it all again. It takes time, because you have to wash ALL of the plankton from the end of the net into the bottle, not just some of it. You spend a lot of time hosing things down. It’s like working at a car wash except with salty water and the deck is pitching like a continuous earthquake.
The weather has gone back to “normal”, which today means 15 knot winds gusting to 20 knots, wind waves 3-5’ and a northwest swell 3-4’ only four seconds apart. Do the math, and you’ll see that occasionally a wind wave adds to a swell and you get slapped by something eight feet high. We were going to go to Bodega Bay today; we had to return to Sausalito instead because it’s downwind.
The sea state today. Some waves were pretty big.
We saw a lot of humpback whales breaching again and again, and slapping the water with their tails. No, we don’t know why they do it although it just looks like fun. No, I didn’t get pictures. They do it too fast.
Did You Know? No biologist or birder uses the word “seagull.” They are “gulls”, and there are a lot of different species such as Western gulls, California gulls, Sabine’s gulls and others. Yes, it is possible to tell them apart.
NOAA Teacher at Sea Dieuwertje “DJ” Kast Aboard NOAA Ship Henry B. Bigelow May 19 – June 3, 2015
Mission: Ecosystem Monitoring Survey
Geographical area of cruise: Gulf of Maine Date: May 28, 2015, Day 11 of Voyage
Interview with Student Megan Switzer
Chief Scientist Jerry Prezioso and graduate oceanography student Megan Switzer
Megan Switzer is a Masters student at the University of Maine in Orono. She works in Dave Townsend’s lab in the oceanography department. Her research focuses on interannual nutrient dynamics in the Gulf of Maine. On this research cruise, she is collecting water samples from Gulf of Maine, as well as from Georges Bank, Southern New England (SNE), and the Mid Atlantic Bight (MAB). She is examining the relationship between dissolved nutrients (like nitrate and silicate) and phytoplankton blooms. This is Megan’s first research cruise!
In the generic ocean food chain, phytoplankton are the primary producers because they photosynthesize. They equate to plants on land. Zooplankton are the primary consumers because they eat the phytoplankton. There are so many of both kinds in the ocean. Megan is focusing on a particular phytoplankton called a diatom; it is the most common type of phytoplankton found in our oceans and is estimated to contribute up to 45% of the total oceanic primary production (Yool & Tyrrel 2003). Diatoms are unicellular for the most part, and a unique feature of diatom cells is that they are enclosed within a cell wall made of silica called a frustule.
Diatom Frustules. Photo by: Steve Schmeissner
Diatoms! Photo by: Micrographia
The frustules are almost bilaterally symmetrical which is why they are called di (2)-atoms. Diatoms are microscopic and they are approximately 2 microns to about 500 microns (0.5 mm) in length, or about the width of a human hair. The most common species of diatoms are: Pseudonitzchia, Chaetocerous, Rhizosolenia, Thalassiosira, Coschinodiscus and Navicula.
Pseudonitzchia. Photo by National Ocean Service
Thalassiosira. Photo by: Department of Energy Joint Genome Institute
Photo of Coscinodiscus
Diatoms also have ranges and tolerances for environmental variables, including nutrient concentration, suspended sediment, and flow regime. As a result, diatoms are used extensively in environmental assessment and monitoring. Furthermore, because the silica cell walls are inorganic substances that take a long time to dissolve, diatoms in marine and lake sediments can be used to interpret conditions in the past.
In the Gulf of Maine, the seafloor sediment is constantly being re-suspended by tidal currents, bottom trawling, and storm events, and throughout most of the region there is a layer of re-suspended sediment at the bottom called the Bottom Nepheloid Layer. This layer is approximately 5-30 meters thick, and this can be identified with light attenuation and turbidity data. Megan uses a transmissometer, which is an instrument that tells her how clear the water is by measuring how much light can pass through it. Light attenuation, or the degree to which a beam of light is absorbed by stuff in the water, sharply increases within the bottom nepheloid layer since there are a lot more particles there to block the path of the light. She also takes a water sample from the Benthic Nepheloid Layer to take back to the lab.
Marine Silica Cycle by Sarmiento and Gruber 2006
Megan also uses a fluorometer to measure the turbidity at various depths. Turbidity is a measure of how cloudy the water is. The water gets cloudy when sediment gets stirred up into it. A fluorometer measures the degree to which light is reflected and scattered by suspended particles in the water. Taken together, the data from the fluorometer and the transmissometer will help Megan determine the amount of suspended particulate material at each station. She also takes a water sample from the Benthic Nepheloid layer to take back to the lab. There, she can analyze the suspended particles and determine how many of them are made out of the silica based frustules of sinking diatoms.
This instrument is a Fluorometer and is used to measure the turbidity at various depths. Photo by: DJ Kast
She collects water at depth on each of the CTD/ Rosette casts.
Rosette with the 12 Niskin Bottles and the CTD. Photo by DJ Kast
Up close shot of the water sampling. Photo by DJ Kast
CTD, Rosette, and Niskin Bottle basics.
The CTD or (conductivity, temperature, and depth) is an instrument that contains a cluster of sensors, which measure conductivity, temperature, and pressure/ depth.
Here is a video of a CTD being retrieved.
Depth measurements are derived from measurement of hydrostatic pressure, and salinity is measured from electrical conductivity. Sensors are arranged inside a metal housing, the metal used for the housing determining the depth to which the CTD can be lowered. Other sensors may be added to the cluster, including some that measure chemical or biological parameters, such as dissolved oxygen and chlorophyll fluorescence. Chlorophyll fluorescence measures how many microscopic photosynthetic organisms (phytoplankton) are in the water. The most commonly used water sampler is known as a rosette. It is a framework with 12 to 36 sampling Niskin bottles (typically ranging from 1.7- to 30-liter capacity) clustered around a central cylinder, where a CTD or other sensor package can be attached. The Niskin bottle is actually a tube, which is usually plastic to minimize contamination of the sample, and open to the water at both ends. It has a vent knob that can be opened to drain the water sample from a spigot on the bottom of the tube to remove the water sample. The scientists all rinse their bottles three times and wear nitrile or nitrogen free gloves to prevent contamination to the samples.
On NOAA ship Henry B. Bigelow the rosette is deployed from the starboard deck, from a section called the side sampling station of this research vessel.
The instrument is lowered into the water with a winch operated by either Adrian (Chief Boatswain- in charge of deck department) or John (Lead Fishermen- second in command of deck department). When the CTD/Rosette is lowered into the water it is called the downcast and it will travel to a determined depth or to a few meters above the ocean floor. There is a conducting wire cable is attached to the CTD frame connecting the CTD to an on board computer in the dry lab, and it allows instantaneous uploading and real time visualization of the collected data on the computer screen.
CTD data on the computer screen. Photo by: DJ Kast
The water column profile of the downcast is used to determine the depths at which the rosette will be stopped on its way back to the surface (the upcast) to collect the water samples using the attached bottles.
Niskin Bottles:
Messenger- The manual way to trigger the bottle is with a weight called a messenger. This is sent down a wire to a bottle at depth and hits a trigger button. The trigger is connected to two lanyards attached to caps on both ends of the bottle. When the messenger hits the trigger, elastic tubing inside the bottle closes it at the specified depth.
Todd holding a messenger to trigger the manually operated Niskin Bottle. Photo by: DJ Kast
Todd with the manually operated Niskin Bottle. Photo by: DJ Kast
Manual CTD fully cocked and ready to deploy. Photo by DJ Kast
Here is a video of how the manual niskin bottle closes: https://www.youtube.com/watch?v=qrqXWtbUc74
The other way to trigger Niskin bottles is electronically. The same mechanism is in place but an electronic signal is sent down the wire through insulated and conductive sea cables (to prevent salt from interfering with conductivity) to trigger the mechanism.
Here is a video of how it closes electronically: https://www.youtube.com/watch?v=YJF1QVe6AK8
Conductive Wire to CTD. Photo by DJ Kast
Photo of the top of the CTD showing the trigger mechanism in the center. Photo by DJ Kast
Top of the Niskin Bottles shows how the lanyards are connected to the top. Photo by DJ Kast
The pin on the bottom is activated when an electronic signal is sent through the conductive sea cables. Photo by DJ Kast
Using the Niskin bottles, Megan collects water samples at various depths. She then filters water samples for her small bottles with a syringe and a filter and the filter takes out the phytoplankton, zooplankton and any particulate matter. She does this so that there is nothing living in the water sample, because if there is there will be respiration and it will change the nutrient content of the water sample.
Filtering out only the water using a syringe filter. Photo by DJ Kast
Syringe with a filter on it. Photo by: DJ Kast
This is part of the reason why we freeze the sample in the -80 C fridge right after they have been processed so that bacteria decomposing can’t change the nutrient content either.
Diatoms dominate the spring phytoplankton bloom in the Gulf of Maine. They take up nitrate and silicate in roughly equal proportions, but both nutrients vary in concentrations from year to year. Silicate is almost always the limiting nutrient for diatom production in this region (Townsend et. al., 2010). Diatoms cannot grow without silicate, so when this nutrient is used up, diatom production comes to a halt. The deep offshore waters that supply the greatest source of dissolved nutrients to the Gulf of Maine are richer in nitrate than silicate, which means that silicate will be used up first by the diatoms with some nitrate left over. The amount of nitrate left over each year will affect the species composition of the other kinds of phytoplankton in the area (Townsend et. al., 2010).
The silica in the frustules of the diatom are hard to breakdown and consequently these structures are likely to sink out of the euphotic zone and down to the seafloor before dissolving. If they get buried on the seafloor, then the silicate is taken out of the system. If they dissolve, then the dissolved silicate here might be a source of silicate to new production if it fluxes back to the top of the water column where the phytoplankton grow.
Below are five images called depth slices. These indicate the silicate concentration (rainbow gradient) over a geographical area (Gulf of Maine) with depth (in meters) latitude and longitude on the x and y axis.
Depth slices of nitrate and silicate. Photo by: GOMTOX at the University of Maine This is the type of data Megan is hoping to process from this cruise.
NOAA Teacher at Sea Dieuwertje “DJ” Kast Aboard NOAA Ship Henry B. Bigelow May 19 – June 3, 2015
Mission: Ecosystem Monitoring Survey
Geographical area of cruise: East Coast Date: May 22, 2015, Day 4 of Voyage
Interview with Jessica Lueders-Dumont
Who are you as a scientist?
Jessica Lueders-Dumont is a graduate student at Princeton University and has two primary components of her PhD — nitrogen biogeochemistry and historical ecology of the Gulf of Maine.
Jessica Lueders- Dumont, graduate student at Princeton cleaning a mini bongo plankton net for her sample. Photo by: DJ Kast
What research are you doing?
Her two projects are, respectively,
A) Nitrogen cycling in the North Atlantic (specifically focused on the Gulf of Maine and on Georges Bank but interested in gradients along the entire eastern seaboard)
B) Changes in trophic level of Atlantic cod in the Gulf of Maine and on Georges Bank over the history of fishing in the region. The surprising way in which these two seemingly disparate projects are related is that part A effectively sets the baseline for understanding part B!
She is co-advised by Danny Sigman and Bess Ward. Danny’s research group focuses on investigating climate change through deep time, primarily by assessing changes in the global nitrogen cycle which are inextricably tied to the strength of the biological pump (i.e. biological-mediated carbon export and storage in the ocean). Bess’s lab focuses on the functional diversity of marine phytoplankton and bacteria and the contributions of these groups to various nitrogen cycling processes in the modern ocean, specifically as pertains to oxygen minimum zones (OMZs). She is also advised by a Olaf Jensen, a fisheries scientist at Rutgers University.
In both of these biogeochemistry labs, nitrogen isotopes (referred to as d15N, the ratio of the heavy 15N nuclide to the lighter 14N nuclide in a sample compared to that of a known standard) are used to track nitrogen cycling processes. The d15N of a water mass is a result of the relative proportions of different nitrogen cycling processes — nitrogen fixation, nitrogen assimilation, the rate of supply, the extent of nutrient utilization, etc. These can either be constrained directly via 15N tracer studies or can be inferred from “natural abundance” nitrogen isotopic composition, the latter of which will be used as a tool for this project.
On this cruise she has 3 sample types — phytoplankton, zooplankton, and seawater nitrate — and two overarching questions that these samples will address: How variable is “baseline d15N” along the entire eastern seaboard, and does this isotopic signal propagate to higher trophic levels? Each sample type gives us a different “timescale” of N cycling on the U.S. continental shelf. She will be filtering phytoplankton from various depths onto filters, she will be collecting seawater for subsequent analysis in the lab, and she will be collecting zooplankton samples — all of which will be analyzed for nitrogen isotopic composition (d15N).
Biogeochemistry background:
Biogeochemists look at everything on an integrated scale. We like to look at the box model, which looks at the surface ocean and the deep ocean and the things that exchange between the two.
The surface layer of the ocean: euphotic zone (approximately 0-150 m-but this range depends on depth and location and is essentially the sunlit layer); nutrients are scarce here.
When the top zone animals die they sink below the euphotic zone and into the aphotic zone (150 m-4000m), and the bacteria break down the organic matter into inorganic matter (nitrate (NO3), phosphate (PO4) and silicate (Si(OH)3.). In terms of climate, an important nutrient that gets cycled is carbon dioxide.We look at the nitrate, phosphate, and silicate as limiting factors for biological activity for carbon dioxide, we are essentially calculating these three nutrients to see how much carbon dioxide is being removed from the atmosphere and “pumped” into the deep sea. This is called the biological pump. Additionally, the particulate matter that falls to the deep sea is called Marine Snow, which is tiny organic matter from the euphotic zone that fuels the deep sea environments; it is orders of magnitude less at the bottom compared to the top.
Visual Representation of the aphotic and euphotic zones and the nutrients that cycle through them. Photo by: Patricia Sharpley
Did you know that the “Deep sea is really acidic, holds a lot of CO2 and is the biggest reservoir of C02 in the world?” – From Jessica Lueders- Demont, graduate student at Princeton.
One of the most important limiting factors for phytoplankton is nitrogen, which is not readily available in many parts of the global ocean. “A limiting nutrient is a chemical necessary for plant growth, but available in quantities smaller than needed for algae and other primary producers to increase their abundance. Organisms can grow and reproduce only when they have sufficient nutrients. For algae, the carbon source is CO2and this, at least in the surface water, has a constant value and is not limiting their growth. The limiting nutrients are minerals (such as Fe+2), nitrogen, and phosphorus compounds” (Patricia Sharpley 2010).
Conversely, phosphorus is the limiting factor on land. The most common nitrogen is molecular nitrogen or N2, which has a strong bond to break and biologically it is very expensive to fix from the atmosphere.
Biological, chemical, and physical oceanography all work together in this biogeochemistry world and are needed to have a productive ocean. For example, we need the physical oceanography to upwell them to the surface so that the life in the euphotic zone can use them.
Activities on the ship that I am assisting Jessica with:
Zooplankton collected using mini bongos with a 165 micron mesh and then further filtered at meshes: 1000, 500, and ends with 250 microns, this takes out all of the big plankton that she is not studying and leaves only her own in her size range which is 165-200 microns.
She is collecting zooplankton water samples because it puts the phytoplankton that she is focusing on into perspective.
The last of the mesh buckets that’s filtering for phytoplankton. Photo by: DJ Kast
Aspirator pump sucks out all of the water so that the zooplankton are left on a glass fiber filter (GFFs) on the filtration rack.
Aspirator pump that is on the side sucks out all of the air so that the plankton get stuck on the filters at the bottom of the cups seen here. Photo by: DJ Kast
Bottom of the cup after all the water has been sucked through. Photo by: DJ Kast
Jessica removing the filter with sterilized tweezers to place into a labeled petri dish. Photo by: DJ Kast
Labeled petri dish with GFF of phytoplankton on it. Photo by: DJ Kast
Video of this happening:
Phytoplankton filtering:
Jessica collecting her water sample from the Niskin bottle in the Rosette. Photo by DJ Kast
Up close shot of the spigot that releases water from Niskin bottle in the Rosette. Photo by DJ Kast
DJ Kast helping Jessica collect her 4 L of seawater from the Niskin bottle in the Rosette. Photo by Jerry P.
DJ and Jessica collect her 4 L of seawater from the Niskin bottle in the Rosette. Photo by Jerry P.
Chief Scientist Jerry Prezioso and Megan Switzer next to the CTD and Rosette Photo by: DJ Kast
May 21, 14:00 hours: Phytoplankton filtering with Jessica.
In addition to the small bottles Jessica needs, we filled 4 L bottles with water at the 6 different depths (100, 50, 30, 20, 10, 3 m) as well.
We then brought all the 4 L jugs into the chemistry lab to process them. The setup includes water draining through the tubing coming from the 4 L jugs into the filters with the GFFs in it. Each 4 L jug is filtered by 2 of these filter setups preferably at an equal rate. The deepest depth 100 m was finished the quickest because it had the least amount of phytoplankton that would block the GFF and then a second jug was collected to try and increase the concentration of phytoplankton on the GFF.
Phytoplankton filtration setup. Photo by DJ Kast
The filter and pump setup up close. Photo by DJ Kast
Up close shot of the GFF within the filtration unit. Photo by DJ Kast
Jessica keeping an eye on her filtration system to make sure nothing is leaking and that there are no air bubbles restricting water flow. Photo by DJ Kast
Here I am helping Jessica setup the filtration unit.Photo by Jessica Lueders- Dumont
The GFF with the phytoplankton (green stuff) on it. Photo by: DJ Kast
There are 2 filters for each depth, and since she has 12 filtration bottles total, then she would be collecting data from 6 depths. She collects 2 filters so that she has replicates for each depth.
Here they are all laid out to show the differences in phytoplankton concentration.
The 6 depths worth of GFFs. See how the 30 m is the darkest. Thats evidence for the chlorophyll max. Photo by: DJ Kast
She will fold the GFF in half in aluminum foil and store it at -80C until back in the lab at Princeton. There, the GFF’s are combusted in an elemental analyzer and the resulting gases run through a mass spectrometer looking for concentrations of N2 and CO2. The 30 m GFF was the most concentrated and that was because of a chlorophyll maximum at this depth.
Chlorophyll maximum layers are common features of vertically stratified water columns. There is a subsurface maximum or layer of chlorophyll concentration. These are found throughout oceans, lakes, and estuaries around the world at varying depths, thicknesses, intensities, composition, and time of year.
NOAA Teacher at Sea
Julia West
Aboard NOAA ship Gordon Gunter March 17 – April 2, 2015
Mission: Winter Plankton Survey Geographic area of cruise: Gulf of Mexico Date: April 1, 2015
Weather Data from the Bridge
Date: 3/31/2015; Time 2000; clouds 25%, cumulus and cirrus; Wind 205° (SSW), 15 knots; waves 1-2 ft; swells 1-2 ft; sea temp 23°C; air temp 23°C
Science and Technology Log
You’re not going to believe what we caught in our neuston net yesterday – a giant squid! We were able to get it on board and it was 23 feet long! Here’s a picture from after we released it:
Giant Squid!
April Fools! (sorry, couldn’t resist) The biggest squid we’ve caught are about a half inch long. Image from http://www.factzoo.com/.
Let’s talk about something just as exciting – navigation. I visit the bridge often and find it all very interesting, so I got a 30 minute crash course on navigation. We joked that with 30 minutes of training, yes, we would be crashing!
From the bridge, you can see a long way in any direction. The visible range of a human eye in good conditions is 10 miles. Because the earth is curved, we can’t see that far. There is a cool little formula to figure out how far you can see. You take the square root of your “height of eye” above sea level, and multiply that by 1.17. That gives you the nautical miles that you can see.
So the bridge is 36 feet up. “Really?” I asked Dave. He said, “Here, I’ll show you,” and took out a tape measure.
ENS Dave Wang measuring the height of the bridge above sea level.
OK, 36 feet it is, to the rail. Add a couple of feet to get to eye level. 38 feet. Square root of 38 x 1.17, and there we have it: 7.2 nautical miles. That is 8.3 statute miles (the “mile” we are used to using). That’s assuming you are looking at something right at sea level – say, a giant squid at the surface. If something is sticking up from sea level, like a boat, that changes everything. And believe me, there are tables and charts to figure all that out. Last night the bridge watch saw a ship’s light that was 26 miles away! The light on our ship is at 76 feet, so they might have been able to see us as well.
Challenge Yourself
If you can see 7.2 nautical miles in any direction, what is the total area of the field of view? It’s a really amazing number!
Back to navigation
Below are some photos of the navigation charts. They can be zoomed in or out, and the officers use the computer to chart the course. You can see us on the chart – the little green boat.
This is a chart zoomed in. The green boat (center) is us, and the blue line and dot is our heading.
In the chart above, you’ll see that we seem to be off course. Why? Most likely because of that other ship that is headed our direction. We talk to them over the radio to get their intentions, and reroute our course accordingly.
Notice the left side, where it says “dump site (discontinued) organochlorine waste. There are a lot of these type dump sites in the Gulf. Just part of the huge impact humans have had on our oceans.
When we get close to a station, as in the first picture above, the bridge watch team sets up a circle with a one mile radius around the location of the station. See the circle, upper center? We need to stay within that circle the whole time we are collecting our samples. With the bongos and the neuston net, the ship is moving slowly, and with the CTD the ship tries maintain a stationary position. However, wind and current can affect the position. These factors are taken into account before we start the station. The officer on the bridge plans out where to start so that we stay within the circle, and our gear that is deployed doesn’t get pushed into or under the boat. It’s really a matter of lining up vectors to figure it all out – math and physics at work. But what is physics but an extension of common sense? Here’s a close-up:
Here is the setup for the station. The plan is that we will be moving south, probably into the wind, during the sampling. See the north-south line?
How do those other ships appear on the chart? This is through input from the AIS (Automated Information System), through which we can know all about other ships. It broadcasts their information over VHF radio waves. We know their name, purpose, size, direction, speed, etc. Using this and the radar system, we can plan which heading to take to give the one-mile distance that is required according to ship rules.
As a backup to the computer navigation system, every half hour, our coordinates are written on the (real paper) navigation chart, by hand.
ENS Pete Gleichauf is writing our coordinates on the paper navigation chart.
There are drawers full of charts for everywhere the Gunter travels!
ENS Melissa Mathes showing me where all the navigation charts are kept. Remember, these are just backups!
Below is our radar screen. There are 3 other ships on the screen right now. The radar computer tells us the other vessels’ bearing and speed, and how close they will get to us if we both maintain our course and speed.
The other vessels in the area, and their bearing, show up on the radar.
If the radar goes down, the officers know how to plot all this on paper.
On this maneuvering board, officers are trained to plot relative positions just like the radar computer does.
Below is Dave showing me the rudder controls. The rudder is set to correct course automatically. It has a weather adjustment knob on it. If the weather is rough (wind, waves, current), the knob can allow for more rudder correction to stay on course. So when do they touch the wheel? To make big adjustments when at station, or doing course changes.
Dave’s arm – showing me the rudder controls.
These are the propulsion control throttles – one for each propeller. They control the propeller speed (in other words, the ship’s speed).
Here are the throttles that control the engine power, which translates to propeller speed.
This controls the bow thruster, which is never used except in really tight situations, such as in port. It moves the bow either direction.
And below is the Global Maritime Distress and Safety System (GMDSS). It prints out any nautical distress signal that is happening anywhere in the world!
Global Marine Distress and Safety System
And then, of course, there is a regular computer, which is usually showing the ships stats, and is connected to the network of computers throughout the ship.
ENS Kristin Johns checking the weather system coming our way.
In my post of March 17, I described the gyrocompass. That is what we use to determine direction, and here is a rather non-exciting picture of this very important tool.
This is the gyrocompass, which uses the rotation of the Earth to determine true north.
As you can see, we have two gyrocompasses, but since knowing our heading is probably the most important thing on the ship, there are backup plans in place. With every watch (every 4 hours), the gyro compass is aligned the magnetic compass to determine our declination from true north. Also, once per trip, the “gyro error” is calculated, using this nifty device:
This is called the alidade. Using the position of the sun as it rises or sets, the gyro error can be computed and used to keep our heading perfectly accurate.
The reading off of the alidade, combined with the exact time, coordinates, and some fancy math, will determine the gyro error. (Click on a picture to see full captions and full size pictures.)
The math for calculating gyro error isn’t hard; it just takes many steps and careful following of instructions!
Numbers need to be taken from charts in these books…
Knowing how to read charts and tables is important!
You can see that we have manual backups for everything having to do with navigation. We won’t get lost, and we’ll always know where we are!
Here I am, “driving” the ship! Watch out! Photo by ENS Pete Gleichauf
Back to Plankton!
These past two days, we have been in transit, so no sampling has been done. But here are a couple more cool micrographs of plankton that Pam shared with me.
This picture shows several invertebrates, along with fish eggs. Madalyn and Andy, who are invertebrate people, got excited at this collection. The fat one, top left is a Doliolid. The U-shaped one is a Lucifer shrimp, the long one in center is an amphipod, at the bottom is a mycid, etc. There are crabs in different stages of development, and the multiple little cylinders are copepods! You can also see the baby fish inside the eggs. Photo credit Pamela Bond/NOAA
These are larval red snapper, a fall spawning fish species of economic interest. Notice the scale! You have to admit baby fish are awfully cute. Photo credit: Pamela Bond/NOAA
Interesting Fish Facts
Our main fish of interest in the winter plankton sampling are the groupers. There are two main species: gag groupers and red groupers. You can learn all about them on the NOAA FishWatch Website. Groupers grow slowly and live a long time. Interestingly, some change from female to male after about seven years – they are protogynous hermaphrodites.
Red grouper. Image credit: NOAA
In the spring plankton research cruise, which goes out for all of May, the main species of interest is the Atlantic bluefin tuna. This species can reach 13 feet long and 2000 lbs, and females produce 10 million eggs a year!
School of Atlantic bluefin tuna. Photo credit: NOAA
The fall plankton research focuses on red snapper. These grow up to about 50 pounds and live a long time. You can see from the map of their habitat that it is right along the continental shelf where the sampling stations are.
Red snapper in Gray’s Reef National Marine Sanctuary. Image credit: NOAA
The NOAA FishWatch website is a fantastic resource, not only to learn about the biology, but about how they are managed and the history of each fishery. I encourage you to look around. You can see that all three of these fish groups have been overfished, and because of careful management, and research such as what we are doing, the stocks are recovering – still a long way from what they were 50 years ago, but improving.
I had a good question come in: how long before the fish larvae are adults? Well, fish are interesting creatures; they are dependent on the conditions of their environment to grow. Unlike us, fish will grow throughout their life! Have you ever kept goldfish in an aquarium or goldfish bowl? They only grow an inch or two long, right? If you put them in an outdoor pond, you’ll see that they will grow much larger, about six inches! It all depends on the environment (combined with genetics).
“Adult” generally means that they are old enough to reproduce. That will vary by species, but with groupers, it is around 4 years. They spawn in the winter, and will remain larvae for much longer than other fish, because of the cooler water.
Personal Log
I’ve used up my space in this post, and didn’t even get to tell you about our scientists! I will save that for next time. For now, I want to share just a few more pictures of the ship. (Again, click on one to get a slide show.)
This is the bridge deck – inside those windows are where most of the pictures on this post were taken. The flying bridge is above.
This is looking forward (and very far down) from the flying bridge toward the bow.
This is the Gunter, looking aft from the flying bridge
My favorite part of the ship – the flying bridge. It’s the highest and a wonderful place for an afternoon nap or to read a book.
We have a small gym on board with an elliptical, treadmill, bike, free weights, a rowing machine, and other goodies. I use it often – I like to do the hill climb on the treadmill or ride the bike.
This is the lounge where people sometimes watch movies
Terms to Learn
What is the difference between a nautical mile and a statute mile? How about a knot?
Do you know what I mean when I say “invertebrate?” It is an animal without a backbone. Shrimp and crabs, are invertebrates; we are vertebrates!
NOAA Teacher at Sea Julia West Aboard NOAA ship Gordon Gunter March 17 – April 2, 2015
Mission: Winter Plankton Survey Geographic area of cruise: Gulf of Mexico Date: March 29, 2015
Weather Data from the Bridge
Time 1600; clouds 35%, cumulus; wind 170 (S), 18 knots; waves 5-6 ft; sea temp 24°C; air temp 23°C
Science and Technology Log
We have completed our stations in the western Gulf! Now we are steaming back to the east to pick up some stations they had to skip in the last leg of the research cruise, because of bad weather. It’s going to be a rough couple of days back, with a strong south wind, hence the odd course we’re taking (dotted line). Here’s the updated map:
Here’s where we are as of the afternoon of 3/29 (the end of the solid red line. We’ve connected all the dots!
I had a question come up: How many types of plankton are there? Well, that depends what you call a “type.” This brings up a discussion on taxonomy and Latin (scientific) names. The scientists on board, especially the invertebrate scientists, often don’t even know the common name for an organism. Scientific names are a common language used everywhere in the world. A brief look into taxonomic categories will help explain. When we are talking about numbers, are we talking the number of families? Genera? Species? Sometimes all that is of interest are the family names, and we don’t need to get more detailed for the purposes of this research. Sometimes specific species are of interest; this is true for fish and invertebrates (shrimp and crabs) that we eat. Suffice it to say, there are many, many types of plankton!
Another question asks what the plankton do at night, without sunlight. Phytoplankton (algae, diatoms, dinoflagellates – think of them like the plants of the sea) are the organisms that need sunlight to grow, and they don’t migrate much. The larval fish are visual feeders. In a previous post I explained that they haven’t developed their lateral line system yet, so they need to see to eat. They will stay where they can see their food. Many zooplankton migrate vertically to feed during the night when it is safer, to avoid predators. There are other reasons for vertical migration, such as metabolic reasons, potential UV light damage, etc.
Vertical migration plays a really important role in nutrient cycling. Zooplankton come up and eat large amounts of food at night, and return to the depths during the day, where they defecate “fecal pellets.” These fecal pellets wouldn’t get to the deep ocean nearly as fast if they weren’t transported by migrating zooplankton. Thus, migration is a very important process in the transport of nutrients to the deep ocean. In fact, one of the most voracious plankton feeders are salps, and we just happened to catch one! Salps will sink 800 meters after feeding at night!
Salp caught in the neuston sample. Salps are a colony of tunicates (invertebrate chordates for you biology students – more closely related to humans than shrimp are!)
Now it’s time to go back into the dry lab and talk about what happens in there. I’ll start with the chlorophyll analysis. In the last post I described fluorescence as being an indicator of chlorophyll content. What exactly isfluorescence? It is the absorption and subsequent emission of light (usually of a different wavelength) by living or nonliving things. You may have heard the term phosphorescence, or better yet, seen the waves light up with a beautiful mysterious light at night. Fluorescence and phosphorescence are similar, but fluorescence happens simultaneously with the light absorption. If it happens after there is no light input (like at night), it’s called phosphorescence.
An example of phosphorescence. We haven’t seen it yet, but I hope to! (From eco-adventureholidays.co.uk)
Well, it is not just phytoplankton that fluoresce – other things do also, so to get a more accurate assessment of the amount of phytoplankton, we measure the chlorophyll-a in our niskin bottle samples. Chlorophyll-a is the most abundant type of chlorophyll.
We put the samples in dark bottles. Light allows photosynthesis, and when phytoplankton (or plants) can photosynthesize, they can grow. We don’t want our samples to change after we collect them. For this same reason, we also process the samples in a dark room. I won’t be able to get pictures of the work in action, but here are some photos of where we do this.
This is the room where we do the chlorophyll readings.
We filter the chlorophyll out of the samples using this vacuum filter:
Each of these funnels filters the sea water through a very fine filter paper to capture the chlorophyll.
The filter papers are placed in test tubes with methanol, and refrigerated for 24 hours or so. Then the test tubes are put in a centrifuge to separate the chlorophyll from the filter paper.
Some of the test tubes for chlorophyll readings, and the filter paper. This box costs about $100!
The chlorophyll values are read in this fancy machine. Hopefully the values will be similar to those values obtained during the CTD scan. I’ll describe that next.
This fluorometer reads chlorophyll levels.
While the nets and CTD are being deployed and recovered, one person in the team is monitoring and controlling the whole event on the computer. I got to be this person a few times, and while you are learning, it is stressful! You don’t want to forget a step. Telling the winch operator to stop the bongos or CTD just above the bottom (and not hit bottom) is challenging, as is capturing the “chlorophyll max” by stopping the CTD at just the right place in the water column.
This is the graph that comes back from the SeaCAT on the bongo. We are interested in the green line, which shows depth as it goes down and comes back up.
Here I am trying my hand at the computers. The monitor on the left is the live video of what is happening on deck (see the neuston net?). Photo by A.L. VanCampen
This is the CTD graph after it has been completed. The left (magenta) line is the chlorophyll, and the horizontal red lines are where we have fired a bottle and collected a sample. Notice the little spike partway down. That is the chlorophyll max, and we try to capture that when bringing it back up. The colored chart shows columns of continuous data coming in.
Here’s another micrograph of larval fish. Notice the tongue fish, the big one on the right. It is a flatfish, related to flounder. See the two eyes on one side of its head? Flatfish lie on the bottom, and have no need for an eye facing the bottom. When they are juveniles, they have an eye on each side, and one of the eyes migrates to the other side, so they have two eyes on one side! Be sure to take the challenge in the caption!
There is a cutlass fish just right of center. Can you find the other one? How about the lizard fish? Hint – look back at the picture in the last post. Photo credit Pamela Bond/NOAA
Personal Log
It’s time to introduce our intrepid leader, Commanding Officer Donn Pratt, known as CO around here. CO lives (when not aboard the Gunter) in Bellingham, WA. He got his start in boats as a kid, starting early working on crab boats. He spent 9 years with the US Coast Guard, where he had a variety of assignments. In 2001, CO transferred to NOAA, while simultaneously serving in the US Navy Reserve. CO is not a commissioned NOAA officer; he went about his training in a different way, and is one of two US Merchant Marine Officers in the NOAA fleet. He worked as XO for about seven years on various ships, and last year he became CO of the Gordon Gunter.
CO is well known on the Gunter for having strong opinions, especially about food and music. He loves being captain for fish research, but will not eat fish (nor sweet potatoes for that matter). A common theme of meal conversations is music; CO plays drums and guitar and is a self-described “music snob.” We have fun talking about various bands, new and old.
CO Don Pratt on the bridge.
One of the most experienced and highly respected of our crew is Jerome Taylor, our Chief Boatswain (pronounced “bosun”). Jerome is the leader of the deck crew. He keeps things running smoothly. As I watch Jerome walk around in his cheerful and hardworking manner, he is always looking, always checking every little thing. Each nut and bolt, each patch of rust that needs attention – Jerome doesn’t miss a thing. He knows this ship inside and out. He is a master of safety. As he teaches the newer guys how to run the winch, his mannerism is one of mutual respect, fun and serious at the same time.
Jerome has been with NOAA for 30 years now, and on the Gunter since NOAA acquired the ship in 1998. He lives right in Pascagoula, MS. I’ve only been here less than two weeks, but I can see what a great leader he is. When I grow up, I want to be like Jerome!
Chief Bosun Jerome Taylor, refusing to look at the camera. No, he’s not grilling steaks; he’s operating the winch!
Challenge Yourself!
OK, y’all (yes, I’m in the south), I have a math problem for you! Remember, in the post where I described the bongos, I showed the flowmeter, and described how the volume of water filtered can be calculated? Let’s practice. The volume of water filtered is the area of the opening x the “length” of the stream of water flowing through the bongo.
V = area x length.
Remember how to calculate the area of a circle? I’ll let you review that on your own. The diameter (not radius) of a bongo net is 60 cm. We need the area in square meters, not cm. Can you make the conversion? (Hint: convert the radius to meters before you calculate.)
Now, that flow meter is just a counter that ticks off numbers as it spins. In order to make that a usable number, we need to know how much distance each “click” is. So we have R, the rotor constant. It is .02687m.
R = .02687m
Here’s the formula:
Volume(m3) = Area(m2) x R(Fe – Fs) m
Fe = Ending flowmeter value; Fs = Starting flowmeter value
The right bongo net on one of the stations this morning had a starting flowmeter value of 031002. The ending flowmeter value was 068242.
You take it from here! What is the volume of water that went through the right bongo net this morning? If you get it right, I’ll buy you an ice cream cone next time I see you! 🙂
Sunset from the Gordon Gunter as we are heading east.
Weather Data from the Bridge Air Temp: 14.1 degrees Celsius
Wind Speed:32 knots
Water Temp: 5.7 degrees Celsius Water Depth: 24.5 meters
This is the Video Plankton Recorder that takes pictures and collects data of plankton.
This is a picture of planktonic crustaceans we were able to look at under a microscope after a deep bongo net tow on Georges Bank slope. Two are called Amphipods and the other is a Euphausiid commonly know as krill.
Betsy showing volunteer Brian and me the computer program that collects all the shots the VPR takes while it’s under water.
Science and Technology Log
Today’s blog is about a piece of equipment called a Video Plankton Recorder or VPR for short. The VPR is attached to the bottom of a yellow V-fin that helps it stay under water when it is being towed. Scientists would want to use a VPR instead of a Bongo Net because the Bongo Net is very rough on the creatures that are captured in it as it is towed through the water, especially the very, very soft and fragile ones. The VPR allows the scientists to capture pictures of the creatures in their natural habitat. It also allows them to get close-ups of these creatures so they can really see what their body structures look like. The VPR also allows the scientist to collect data on many creatures are found in a given area in the body of water they are looking at. The VPR has two arms, one on each side about 2 feet apart. One arm has a camera and the other arm has a strobe or flash. The camera and strobe focus on taking pictures between the arms at a rate of 20 pictures a second. The VPR captures all the images as it goes through the water and stores them on a disk drive that the scientists can then upload to their computers. The VPR is generally towed at a speed of around 2-3 knots , or 3-4 miles per hour.
Science Spot Light
The scientist in charge of running the VPR here on the Gordon Gunter is Betsy Broughton. Betsy is an Oceanographer who works on the night crew here on our ship. Betsy has been working on ships for 31 years and has been to sea for close to 1300 days on 18 ships including 3 international ships! When she isn’t on a ship she works at National Marine Fisheries Service (NMFS) in Woods Hole, Massachusetts. Betsy primarily studies baby Cod and Haddock. She is trying to understand how they survive when they are really little, before they look like a fish, what they eat, where they live and what eats them. If you want to learn more you can visit the Fish Facts on the NMFS webpage. Betsy also works on designing the sampling gear that will work faster and give scientists more accurate information. In her spare time, Betsy is an International Challenge Master for Challenge A with Destination Imagination.
This is a close up of the mouth of a Salp. These plankton are filter feeders.
This is a chain of Salps after they were born. They can be found linked together like this in chains or in singles.
This a Salp, which is a jelly-like Zooplankton. These are found in our coastal waters starting in the spring time.
This is called a Pleurobrancia otherwise commonly known as a Comb Jelly because of the rows of fine hairs they use to swim. They use the tentacles sticking out from the side to feed smaller plankton. We have been finding many of these in our bongo nets!
This is a Phoronid in a Salp body that it ate and is now using as a house. He will swim around in ts house and the females will lay their eggs in there. He is a predator with large claws. They will eat anything small that comes near their house. This tiny plankton was used as the model for the monsters in the movie “Alien.”
This is called a hydromedusa. It looks like a Jellyfish but it is much smaller and not a true jellyfish. Sometimes these can be found in a form attached to the bottom of the ocean floor at a certain time in their life. Like jellyfish they sting things that drift into their tentacles.
This is called a Clione, commonly known as a Sea Butterfly, which is actually a type of a snail! They have wings that help them swim through the water and a bright red tail. They also feed on smaller plankton that drifts by them.
This a collection of various fish, planktonic crustaceans and snails that were photographed off Nantucket Shoals.
This this a Bolinopsis, which is another type of Comb Jelly. This one has a different shape than the other Comb Jelly. These are also predators of smaller plankton. They also have rows of tiny hairs on their body that they use to swim slowly through the water.
This is a Chaetognath, commonly know as an Arrow Worm. They are very clear, like glass, which makes them hard to see for their prey or predators that might eat them. They are fierce predators that feed on anything smaller than them. They have sharp spines on their head that they stab their prey with. We have been finding many of these in our bongo nets!
Personal Log
We have been on the NOAA Ship Gordon Gunter now for 8 days. It’s really hard to believe how much I have learned in a little over a week. It’s been a crash course in a whole bunch of cool science, as well as life on ship. It’s been a little crazy with the weather, it has not been very cooperative, especially the wind. Even though the weather has forced us to make changes in our original plans, the scientists have been very flexible and have done what they can to get their jobs done. Today we have come back from Georges Banks and we are going to be passing through the Cape Cod Canal and spending some time in Cape Cod Bay. Luckily there are a lot of Right Whales known to be there. It’s been really fun getting to know all the scientists, NOAA Corps folks and the crew. Everyone is very nice and it’s amazing how quickly I feel like I have known these people for a long time in just over a week. It is nice to be around like-minded folks who also love science. Yesterday was one of the nicest days, it was warm enough that we didn’t have to wear the mustang suits. I was also able to decorate and deploy a drifter buoy, but more on that later!
Me catching the beautiful sunset before the storm came in.
Weather Data from the Bridge Air Temp: 5.5 Degrees Celsius
Wind Speed: 9.0 Knots
Water Temp: 4.6 Degrees Celsius ater Depth: 41.2 Meters
The Science Teams – Photo by Mark Weekly
Science and Technology Log
If Science at Sea is what I wanted, this is the ship for it! The evening of our departure from Newport, R.I. on Monday, April 7th, the group of scientists met in the staff lounge for a meeting of the minds. I soon found out that there was an array of scientist on the ship all with different goals and science they wanted to conduct. On this ship we have two teams of Oceanographers, a day team and a night team. The Oceanographers are generally taking underwater tests and samples using a variety of equipment. We also have the Marine Mammal Observer Team who are on the look out for any sort of mammals that may poke head out of the water such as whales and dolphins.
There is also a group of Birders collecting data on any bird sightings. And lastly we have our Acoustics, or sound team, that is listening for the sounds of marine mammals. I also learned at that meeting that it would take a lot of teamwork and collaboration on the part of each of the Scientist crews, as well as the NOAA Corps and crew to make it all happen.
Every day the representatives from each team have to get together to coordinate the timing of each of the events that will happen throughout the day. The Mammal and Birding Observer teams are on the same schedule and can collect sighting data throughout the day from 7 AM to 7 PM, only stopping for lunch, as they need daylight to conduct their work. The daytime Oceanographers plan their work of collecting samples around the observer teams, sending off their collection equipment before 7AM, at lunch, and then again at 7PM when the observers teams are done. The nighttime Oceanographers are not working during the same time as other scientists so this gives them the opportunity to to do as many test and collections as they can without interrupting anyone else’s work. The Acoustic team can work anytime of day or during any kind of weather without conflicting with anyone as long as the water is deep enough to drop their equipment. It sounds like an easy schedule but there are many things, like weather, technology and location, that could disrupt this carefully orchestrated schedule of science. When that happens, and it has, everyone must be flexible and work together to make sure everyone can conduct the science they need.
Me helping to bring the Bongo net back onto the ship for cleaning. – Photo by Chris Tremblay
Scientist Jerry Prezioso tying the bottom of the Bong nets getting them really to be put in the water.
Science Spotlight
Since there is so much science happening on the ship that I am doing every day, I am going to have to share just one thing at a time or I would be writing for hours! Today’s science spotlight is about scientist Jerry Prezioso and the Bongo nets. Jerry is an Oceanographer who works at the NOAA Lab in Narragansett, R.I. Jerry primarily studies plankton distribution. He has been on many trips on NOAA ships since he was 18!
Today Jerry taught me how to do a Bongo net sample that is used to collect plankton from the various water columns. At the top of the net there is a piece of equipment called a CTD (Conductivity Temperature & Depth Unit) that communicates with the computers in the lab on the ship. The scientists in the lab use that piece of equipment to detect how far down the net is going and when it is close to the bottom, as well as collect data on the water temperature and salinity.
Once the CTD is set and turned on, the Bongo net can be lowered into the water. The nets have weights on them to sink them close to the bottom. Once the nets are close a scientist at the computer has the cable operator pull the nets up and out of the water. Once they are on deck they have to be washed down so all the organisms that were caught in the netting go to the cod end of the nets. The cod ends of the nets are opened up and the organisms are rinsed into a sieve where they will carefully be transferred into glass bottles, treated with formaldehyde and sent to a lab for sorting. There were lots of organisms that were caught in the net. Some that we saw today were: Copepods, Comb Jellies or Ctenophora, Herring Larva, aquatic Arrow Worms or Chaetognaths and tons of Phytoplankton and Zooplankton. The Bongo nets are towed several times a day and night to collect samples of plankton.
Jerry Prezioso and I washing down the Bongo Nets. – Photo by Chris Tremblay.
A shot of some of the creatures we caught being filtered into sampling jars for processing.
Personal Log
The start to the trip has been a little rough. It feels like this is the first day we have been able to do anything. Monday we had to sit in port and wait for a scientist to calibrate some equipment before we left so we didn’t get underway until bed time. When we awoke, the weather was bad and the seas were very rough. Several people were very sick and some still are. We were only able to drop one piece of acoustic equipment all day (more on that in another blog). We also had to change the plans on where we were going and move closer to shore due to the weather.
On a ship you need to be very flexible as things are changing all the time! Today was the the first day we were able to do any real science for a sustained amount of time and there were definitely lots of bugs and kinks that needed to be worked out. On top of dropping the BONGO nets with Jerry, I was also able to spend some time and fill in some shifts on the the decks with the Marine Mammal team watching for whales and dolphins. We had a few cool sighting of Humpbacks, Minke, and a Right Whales! (More on them and what they do in another blog too.) On another note, the state rooms are huge and I am sharing a room with one of the acoustic scientists, Genevieve. She is very nice and helpful. The food on the ship is spectacular! I am very surprised how good it is and how many choices there are every meal. All and all things are off to a good start and there is so much more I have to share with everyone about what all these scientist do and it is only our first “real” day!
Did You Know?
Did you know that North Atlantic Right Whales have a V- shaped blow. Their blow holes (two) are separated which gives them the characteristic blow shape.
NOAA Teacher at Sea Britta Culbertson Aboard NOAA Ship Oscar Dyson September 4-19, 2013
Mission: Juvenile Walley Pollock and Forage Fish Survey Geographical Area of Cruise: Gulf of Alaska Date: Wednesday, September 12th, 2013
Weather Data from the Bridge (for Sept 12th, 2013 at 9:57 PM UTC):
Wind Speed: 23.05 kts
Air Temperature: 11.10 degrees C
Relative Humidity: 93%
Barometric Pressure: 1012.30 mb
Latitude: 58.73 N Longitude: 151.13 W
Science and Technology Log
A humpback whale. (Photo credit: NOAA)
We have been seeing a lot of humpback whales lately on the cruise. Humpback whales can weigh anywhere from 25-40 tons, are up to 60 feet in length, and consume tiny crustaceans, plankton, and small fish. They can consume up to 3,000 pounds of these tiny creatures per day (Source: NOAA Fisheries). Humpback whales are filter feeders and they filter these small organisms through baleen. Baleen is made out of hard, flexible material and is rooted in the whale’s upper jaw. The baleen is like a comb and allows the whale to filter plankton and small fish out of the water.
This whale baleen is used for filter feeding. It’s like a small comb and helps to filter zooplankton out of the water. (Photo credit: NOAA)
I’ve always wondered how whales can eat that much plankton! Three thousand pounds is a lot of plankton. I guess I felt that way because I had never seen plankton in real-life and I didn’t have a concept of how abundant plankton is in the ocean. Now that I’m exposed to zooplankton every day, I’m beginning to get a sense of the diversity and abundance of zooplantkon.
In my last blog entry I explained how we use the bongo nets to capture zooplankton. In this entry, I’ll describe some of the species that we find when clean out the codends of the net. As you will see, there are a wide variety of zooplankton and though the actual abundance of zooplankton will not be measured until later, it is interesting to see how much we capture with nets that have 20 cm and 60 cm mouths and are towed for only 5-10 minutes at each location. Whales have much larger mouths and feed for much longer than 10 minutes a day!
Cleaning the codends is fairly simple; we spray them down with a saltwater hose in the wet lab and dump the contents through a sieve with the same mesh size as the bongo net where the codend was attached. The only time that this proves challenging is if there is a lot of algae, which clogs up the mesh and makes it hard to rinse the sample. Also, the crab larvae that we find tend to hook their little legs into the sieve and resist being washed out. Below are two images of 500 micrometer sieves with zooplankton in them.
A mix of zooplankton that we emptied out of the codend from the bongo.
Crab larvae (megalopae) that we emptied out of the codend.
Some of the species of zooplankton we are finding include different types of:
Megalopae (crab larvae)
Amphipods
Euphausiid (krill)
Chaetognaths
Pteropods (shelled: Limasina and shell-less: Clione)
Copepods (Calanus spp., Neocalanus spp., and Metridea spp.)
Larval fish
Jellyfish
Ctenophores
The other day we had a sieve full of ctenophores, which are sometimes known as comb jellies because they possess rows of cilia down their sides. The cilia are used to propel the ctenophores through the water. Some ctenophores are bioluminescent. Ctenophores are voracious predators, but lack stinging cells like jellyfish and corals. Instead they possess sticky cells that they use to trap predators (Source: UC Berkeley). Below is a picture of our 500 micrometer sieve full of ctenophores and below that is a close-up photo of a ctenophore.
A sieve full of ctenophores or comb jellies.
A type of ctenophore found in arctic waters. (Photo credit: Kevin Raskoff, MBARI, NOAA/OER)
It’s fun to compare what we find in the bongo nets to the type of organisms we find in the trawl at the same station. We were curious about what some of the fish we were eating, so we dissected two of the Silver Salmon that we had found and in one of them, the stomach contents were entirely crab larvae! In another salmon that we dissected from a later haul, the stomach contents included a whole capelin fish.
Juvenile pollock are indiscriminate zooplanktivores. That means that they will eat anything, but they prefer copepods and euphausiids, which have a high lipid (fat) content. Once the pollock get to be about 100 mm or greater in size, they switch from being zooplanktivores to being piscivorous. Piscivorous means “fish eater.” I was surprised to hear that pollock sometimes eat each other. Older pollock still eat zooplankton, but they are cannibalistic as well. Age one pollock will eat age zero pollock (those that haven’t had a first birthday yet), but the bigger threat to age zero pollock is the 2 year old and older cohorts of pollock. Age zeros will eat small pollock larvae if they can find them. Age zero pollock are also food for adult Pacific Cod and adult Arrowtooth Flounder. Older pollock, Pacific Cod, and Arrowtooth Flounder are the most voracious predators of age 0 pollock. Recently, in the Gulf of Alaska, Arrowtooth Flounder have increased in biomass (amount of biological material) and this has put a lot of pressure on the pollock population. Scientists are not yet sure why the biomass of Arrowtooth Flounder is increasing. (Source: Janet Duffy-Anderson – Chief Scientist aboard the Dyson and Alaska Fisheries Science Center).
The magnified images below, which I found online, are the same or similar to some of the species of zooplankton we have been catching in our bongo nets. Click on the images for more details.
A chaetognath found in the Bering Sea. (Photo credit: Dave Forcucci, NOAA)
A type of euphausiid called Thysanoessa raschii. (Photo credit: WoRMS Database)
A type of naked or shell-less pteropod called an “ice snail”. (Photo credit: Kevin Raskoff, NOAA Office of Ocean Exploration)
A type of copepod called Calanus. (Photocredit: Russ Hopcroft, University of Alaska, Fairbanks)
Limacina helicina, a type of shelled pteropod. (Photo credit: Russ Hopcroft, University of Alaska, Fairbanks)
Neocalanus critatus – a type of copepod found in the Gulf of Alaska. (Photocredit: Russ Hopcroft, University of Alaska, Fairbanks)
A type of amphipod found in the cold waters around Alaska. (Photo credit: Russ Hopcroft, NOAA Office of Ocean Exploration)
Metridia pacifica – a type of copepod found the Gulf of Alaska. (Photo credit: Russ Hopcroft, University of Alaska, Fairbanks)
Personal Log (morning of September 14, 2013)
I’m thankful that last night we had calm seas and I was able to get a full eight hours of sleep without feeling like I was going to be thrown from my bed. This morning we are headed toward the Kenai Peninsula, so I’m excited that we might get to see some amazing views of the Alaskan landscape. The weather looks like it will improve and the winds have died down to about 14 knots this morning. Last night’s shift caught an octopus in their trawl net; so hopefully, we will find something more interesting than just kelp and jellyfish in our trawls today.
Did You Know?
I mentioned that we had found some different types of pteropods in our bongo nets. Pteropods are a main food source for North Pacific juvenile salmon and are eaten by many marine organisms from krill to whales. There are two main varieties of pteropods; there are those with shells and those without. Pteropods are sometimes called sea butterflies.
A close-up of Limacina helicina, a shelled pteropod or sea butterfly. (Photo credit: Russ Hopcroft/University of Alaska, Fairbanks)
Unfortunately, shelled pteropods are very susceptible to ocean acidification. Scientists conducted an experiment in which they placed shelled pteropods in seawater with pH and carbonate levels that are projected for the year 2100. In the image below, you can see that the shell dissolved slowly after 45 days. If pteropods are at the bottom of the food chain, think of the implications of the loss of pteropods for the organisms that eat them!
Shelled pteropods after being exposed to sea water that has the anticipated carbonate and pH levels for the year 2100. Notice the degradation of the shell after 45 days. (Photo credit: David Liittschwager/National Geographic Stock)
In my last blog entry on the bongo, I talked about using the “frying pan” or clinometer to measure wire angle. If you’re interested in other applications of clinometers, there are instructions for making homemade clinometers here and there’s also a lesson plan from National Ocean Services Education about geographic positioning and the use of clinometers this website.
If you are interested in having your students learn more about ocean acidification, there is a great ocean acidification module developed for the NOAA Ocean Data Education Project on the Data in the Classroom website.
NOAA Teacher at Sea Britta Culbertson Aboard NOAA Ship Oscar Dyson September 4-19, 2013
Mission: Juvenile Walley Pollock and Forage Fish Survey Geographical Area of Cruise: Gulf of Alaska Date: Wednesday, September 11th, 2013
Weather Data from the Bridge (for Sept 11th, 2013 at 10:57 PM UTC):
Wind Speed: 4.54 kts
Air Temperature: 10.50 degrees C
Relative Humidity: 83%
Barometric Pressure: 1009.60 mb
Latitude: 58.01 N Longitude: 151.18 W
Science and Technology Log
What is a bongo net and why do we use it?
As I mentioned in a previous entry, one of the aspects of this cruise is a zooplankton survey, which happens at the same stations where we trawl for juvenile pollock. The zooplankton are prey for the juvenile pollock. There are many types of zooplankton including those that just float in the water, those that can swim a little bit on their own, and those that are actually the larval or young stage of much larger organisms like crab and shrimp. We are interested in collecting the zooplankton at each station because because we are interested in several aspects of juvenile pollock ecology, including feeding ecology. In order to catch zooplankton, we use a device called a bongo net. The net gets its name because the frame resembles bongo drums.
Diagram of a 20 cm bongo net set-up. (Photo credit: NOAA – Alaska Fisheries Science Center)
The bongo net design we are using includes 2 small nets on a 20 cm frames with 153 micrometer nets attached to them and 2 large nets on 60 cm frames with 500 micrometer nets. The 500 micrometer nets catch larger zooplankton and the 153 micrometer nets catch smaller zooplankton. In the picture above, there are just two nets, but our device has 4 total nets. At the top of the bongo net setup is a device called the Fastcat, which records information from the tow including the depth that bongo reaches and the salinity, conductivity, and temperature of the water.
This is what the bongo looks like when it’s finally in the water (Photo credit: John Eiler)
What happens during a bongo net tow?
The process of collecting zooplankton involves many people with a variety of roles. It usually takes three scientists, one survey tech, and a winch operator who will lower the bongo net into the water. In addition, the officers on the bridge need to control the speed and direction of the boat. All crew members are in radio contact with each other to assure that the operation runs smoothly. Two scientists and a survey tech stand on the “hero deck” and work on getting the nets overboard safely. Another scientist works in a data room at a computer which monitors the depth and angle of the bongo as it is lowered into the water. It is important to maintain a 45 degree angle on the wire that tows the bongo to make sure that water is flowing directly into the mouth opening of the net. One of the scientists on the hero deck will use a device that we lovingly call the “frying pan,” but more accurately it is called a clinometer or inclinometer. The flat side of the device gets lined up with the wire and an arrow dangles down on the plate and marks the angle. The scientist calls out the angle every few seconds so that the bridge knows whether or not to increase or decrease the speed of the ship in order to maintain the 45 degree angle necessary.
Scientist Peter Proctor holds up the “frying pan” also known as a clinometer or inclinometer, which is used to measure the wire angle of the bongo when it’s in the water.
Meanwhile, back at the computer, we monitor how close the bongo gets to the bottom of the ocean. We already know how deep the ocean is at our location because of the ship’s sonar. The bongo operation involves a bit of simple triangle geometry. We know the depth and we know the angles, so we just have to calculate the hypotenuse of the triangle that will be created when the bongo is pulled through the water to figure out how much wire to let out. The survey tech uses a chart that helps him determine this quickly so he knows what to tell the winch operator in terms of wire to let out. In the images below, you can see what we are watching as the bongo completes its tow. The black line indicates the depth of the bongo, and the red, purple, and blue lines indicate temperature, conductivity, and salinity.
This is an example of a good bongo tow. The black line on the left of the graph shows a consistent tow angle both up and down. The key is that the black line should have a “v” shape on the graph if the tow is good.
This graph shows what happens when a bongo gets caught in the current and stays at the same depth for a while. Look at how the black line isn’t smooth, but levels off for a bit. This happened with the bongo both when it was going down and coming back up to the surface.
When the bongo is within in 10 meters of the bottom, the survey tech radios the winch operator to start bringing the bongo back up. It usually takes longer for it to come up as it does for it to go out, nevertheless, the 45 degree wire angle needs to be maintained. When the survey tech sees the bongo at the surface of the water, the two scientists on the hero deck get ready to grab it. This operation can be quite difficult when it’s windy and the seas are rough. If you look at the sequence of the photos below, pay attention to the horizon line where the water meets the sky and you can get a sense of the size of the swells that day.
Chief Scientist Janet Duffy-Anderson and scientist Peter Proctor bringing the bongo back on deck.
Bongo nearly over the railing of the hero deck.
Pulling the nets over the railing.
Finally pulling up the codends of the bongo net. Note the change in the horizon line on all 4 pictures. There were pretty big swells this day.
When the bongo is safely back on deck, the person in the data room records the time of the net deployment, how long it takes to go down and up, how much wire gets let out, and the total depth at the station. If anything goes wrong, this is also noted in the data sheet.
As the bongo reaches the surface, the scientists grab the net keep it from banging into the side of the ship. When the net is on board, the next step is to read the flowmeters on the nets that indicate how much water has flowed through them. Then we rinse the nets and wash all of the material down the nets and into the “codends” at the very end of the net. These are little containers that can be detached and emptied to collect the samples.
Vince, the survey tech, and Peter the scientist prepare to read the flowmeters on the bongo.
Britta and Peter washing the bongo nets.
Once the codends are detached, they are taken to the wet lab and rinsed. Each of the four parts of the net has a codend where the zooplankton are caught. The zooplankton are rinsed out of the codends into a sieve and then collected in a jar and preserved with formalin. The purpose of having two of each of the 20 cm and 60 cm bongo nets is to ensure that if one sample is bad or accidentally dumped, there is always a backup. I have had to use the backup once or twice when there was a big jellyfish in the codend that kept me from getting all of the zooplankton out of the sample.
The codend from the 150 micrometer bongo net.
Britta rinsing the 500 micrometer sieve.
After we collect the zooplankton the samples are shipped to Seattle when we return to port. Back in the labs, the samples are sorted, the zooplankton are identified to species, and the catch is expressed at number per unit area. This gives a quantitative estimate of the density of plankton in the water. A high density of the right types of food means a good feeding spot for the juvenile walleye pollock! This sorting process can take approximately one year. I think it’s pretty amazing how much work goes into collecting the small samples we get at each station. Just to think of all of the person hours and ship hours involved makes me realize how costly it is to study the ocean.
Scientist Colleen Harpold holding up one of the preserved jars of zooplankton.
Scientist Colleen Harpold holding up one of the preserved jars of zooplankton that has A LOT of algae in it too!
Personal Log
It is hard to believe that I’ve been on the ship a week now. It feels strange that just 7 days ago I had never heard of a bongo net or an anchovy net. Now I see them every day and I know how to identify several types of fish, jellyfish, and zooplankton. I love working with the scientists and learning about the surveys we are doing. Nearly every trawl reveals a special, new organism, like the Spiny Lumpsucker – go look that one up, I dare you! We don’t have much down time and I’m trying to blog in between stations, but sometimes the time between stations after we finish our work can be 45 minutes and sometimes just 15 minutes. So we are pretty much on the go for the whole 12-hour shift. That’s where the fortitude part of Teacher at Sea comes in. You definitely need to have fortitude to endure the long hours, occasional seasickness (I like to think of it as “sea discomfort”), and periodic bad weather.
By now though, it all seems routine and I’d like to think I’ve gotten used to being thrown around in my sleep a little now and again when we hit some rough seas. This experience has been so worthwhile and even though I look forward to the comforts of home, I don’t really want it to end. When I graduated from college, I worked with a herpetologist studying lizards in the desert south of Carlsbad, New Mexico. I have fond memories of living in a tent for four months and collecting lizards all day to bring back to camp to measure and check for parasites. I often miss doing scientific work, so Teacher at Sea has given me the opportunity to be a scientist again and to learn about a whole new world in the ocean. What a treat! One of the reasons I chose to be a teacher was to be able to share my excitement about science with students and I feel so lucky that I get to share this experience too.
Did you know?
There are two species of Metridia, a type of copepod (zooplankton), that are found in the Gulf of Alaska/Bering Sea. One of them is called Metridia lucens and the other one is Metridia oketensis. These copepods are bioluminescent, which means that they glow when they are disturbed. They sometimes glow when they are in the wake of the ship or on the crest of a wave. Tonight when I was draining a codend into a sieve, my sieve looked like it had blue sparkles in it, but just for a second! I asked our resident zooplankton expert, Colleen Harpold what they might be and she thought that my blue sparkles likely belonged to the genus Metridia.
This is an image of Metridia longa. (Photo credit: NOAA/Hopcroft)
This is a picture from Scientific American of Metridia spp. glowing while in a sieve. (Photo Credit: Chris Linder, Woods Hole Oceanographic Institute)
Thanks for reading! Please leave me some comments or ask questions about any of the blog posts and feel free to ask other questions about the work we are doing or what it’s like at sea! I would love to be able to answer real-time while I am at sea.
Mission:Ecosystem Monitoring Survey Date: 6/19/2013 Geographical area of cruise: The continental shelf from north of Cape Hatteras, NC, including Georges Bank and the Gulf of Maine, to the Nova Scotia Shelf
Weather Data from the Bridge: Latitude/longitude: 3853.256 N, 7356.669W
Temperature: 18.6ºC
Barometer: 1014.67 mb
Speed: 9.7 knots
CTD reading on the computer. Blue is density, red is salinity, green is temperature and black indicates the depth.
Science and Technology Log:
Even before the plankton samples are brought onboard, scientists start recording many types of data when the equipment is launched. The bongos are fitted with an electronic CTD (conductivity, temperature and density) and as they are lowered into the ocean the temperature, density and salinity (salt content) are recorded on a computer. This helps scientists with habitat modeling and determining the causes for changes in the zooplankton communities. Each bongo net also has a flow-through meter which records how much water is moving through the net during the launch and can is used to estimate the number of plankton found in one cubic meter of water.
Zooplankton (Z) and Icthyoplankton (I) samples.
The plankton collected from the two bongo nets are separated into two main samples that will be tested for zooplankton and icthyoplankton (fish larvae and eggs). These get stored in a glass jars with either ethanol or formalin to preserve them. The formalin samples are sent to a lab in Poland for counting and identification. Formalin is good for preserving the shape of the organism, makes for easy identification, and is not flammable, so it can be sent abroad. However, formalin destroys the genetics (DNA) of the organisms, which is why ethanol is used with some of the samples and these are tested at the NOAA lab in Narragansett, Rhode Island.
Holding one of our zooplankton samples – photo by Paula Rychtar.
When the samples are returned from Poland, the icthyoplankton samples are used by scientists to determine changes in the abundance of the different fish species. Whereas, the zooplankton samples are often used in studies on climate change. Scientists have found from current and historic research (over a span of about 40 years) that there are changes in the distribution of different species and increases in temperature of the ocean water.
At the Rosette stations we take nutrient samples from the different water depths. They are testing for nitrates, phosphates and silicates. Nutrient samples are an important indicator of zooplankton productivity. These nutrients get used up quickly near the surface by phytoplankton during the process of photosynthesis (remember phytoplankton are at the base of the food chain and are producers). As the nutrients pass through the food chain (zooplankton eating phytoplankton and then on up the chain) they are returned to the deeper areas by the oxidation of the sinking organic matter. Therefore, as you go deeper into the ocean these nutrients tend to build up. The Rosettes also have a CTD attached to record conductivity, temperature and density at the different depths.
Scientist, Chris Taylor, completing the dissolved inorganic carbon test.
The dissolved inorganic carbon test uses chemicals to stop any further biological processes and suspend the CO2 in “time”.
Another test that is conducted on the Rosettes is for the amount of dissolved inorganic carbon. This test is an indicator of the amount of carbon dioxide that the ocean uptakes from outside sources (such as cars, factories or other man-made sources). Scientists want to know how atmospheric carbon is affecting ocean chemistry and marine ecosystems and changing the PH (acids and bases) of the ocean water. One thing they are interested in is how this may be affecting the formation of calcium in marine organisms such as clams, oysters, and coral.
New word: oxidation – the chemical combination of a substance with oxygen.
Cape Cod canal.
Personal Log:
This week we headed back south and went through the Cape Cod canal outside of Plymouth, Massachusetts. I had to get up a little earlier to see it, but it was well worth it. The area is beautiful and there were many small boats and people enjoying the great weather.
Small boat bringing in a new group to the Gordon Gunter.
We also did a small boat transfer to bring five new people onboard, while three others left at the same time. It was hard to say goodbye, but it will be nice to get to know all the new faces.
Common Dolphins swimming next to the Gordon Gunter.
So now that we are heading south the weather is warming up. I have been told that we may start seeing Loggerhead turtles as the waters warm up – that would be so cool. We had a visit by another group of Common Dolphins the other day. They were swimming along the side of the ship and then went up to the bow. They are just so fun to watch and photograph.
We have been seeing a lot of balloons (mylar and rubber) on the ocean surface. These are released into the air by people, often on cruise ships, and then land on the surface. Sea turtles, dolphins, whales and sea birds often mistake these for jelly fish and eat them. They can choke on the balloons or get tangled in the string, frequently leading to death. Today, we actually saw more balloons than sea birds!!! A good rule is to never release balloons into the air no matter where you live!
A mylar balloon seen in the water by our ship.
Did you know? A humpback whale will eat about 5000 pounds of krill in a day. While a blue whale eats about 8000 pounds of krill daily.
Question of the day? If 1000 krill = 2 pounds, then together how many krill does a humpback and blue whale consume on a daily basis.
NOAA Teacher at sea Bhavna Rawal On Board the R/V Walton Smith Aug 6 – 10, 2012
Mission: Bimonthly Regional Survey, South Florida Geographic area: Gulf of Mexico Date: August 8, 2012
. Weather Data from the Bridge:
Station: 21.5
Time: 1.43 GMT
Longitude: 21 23 933
Latitude: 24 29 057
Wind direction: East of South east
Wind speed: 18 knots
Sea wave height: 2-3 ft
Clouds: partial
Science and Technology Log:
Yesterday, I learned about the CTD and the vast ocean life. Today I learned about a new testing called net tow, and how it is necessary to do, and how it is done.
What is Net Tow? The scientist team in the ship uses a net to collect sargassum (a type of sea weed) which is towed alongside the ship at the surface of the predetermined station.
A net to collect sargassum (a type of sea weed)
How did we perform the task? We dropped the net which is made of nylon mess, 335 microns which collects zooplanktons in the ocean. We left this net in the ocean for 30 minutes to float on the surface of the ocean and collects samples. During this time the ship drives in large circles. After 30 minutes, we (the science team) took the net out of the ocean. We separated sargassum species, sea weeds and other animals from the net. We washed them with water, then classified and measured the volume of it by water displacement. Once we measure the volume, we threw them back into the ocean.
Dropped the net which collects zooplanktons in the ocean
Types of sargassum
Measured the volume of it by water displacement
Threw them back into the ocean
Record data
Types of Sargassum and Plankton: There are two types of sargassum; ones that float, and the other ones that attach themselves to the bottom of the ocean. There are two types of floating sargassum and many types attached to bottom of the ocean.
Also there are two types of plankton; Zooplankton and phytoplankton. As you all know phytoplankton are single celled organisms, or plants that make their own food (photosynthesis). They are the main pillar of the food chain. It can be collected in a coastal area where there is shallow and cloudy water along the coastal side. The phytoplankton net is small compared to the zooplankton and is about 64 microns (small mess).
Zooplanktons are more complex than phytoplankton, one level higher in their food chain. They are larva, fish, crabs etc. they eat the phytoplankton. The net that is made to catch zooplankton, is about 335 microns. Today, we used the net to collect zooplankton.
Why Net Tow is necessary: Net tow provides information about habitats because tons of animals live in the sargassum. It is a free floating ecosystem. Scientists are interested in the abundance of sargassum and the different kinds of animals, such as larva, fishes, crabs, etc. Many scientists are interested in the zooplankton community structures too.
Dive, Buoy and other data collection equipments: Two science team members prepared for diving; which means that they wore scuba masks, oxygen tanks and other equipment. They took a little boat out from the ship and went to the buoy station. They took the whole buoyancy and other data collection instruments with them. The two instruments were the Acoustic Doppler (ADCP) and the micro cat which was attached to the buoy. The micro cat measures salinity and temperature on profile of currents, and the ADCP measures currents of the ocean. Both instruments collect many data over the period. The reason for bringing them back, is to recover data in a Miami lab and the maintenance of the buoy.
The micro cat measures salinity and temperature on profile of currents
Acoustic Doppler (ADCP) measures currents of the ocean
Personal Log:
My first day on the ship was very exciting and nerve-racking at the same time. I had to take medicine to prevent me from being seasick. This medicine made me drowsy, which helped me to go to sleep throughout the night. The small bunk bed and the noise from the moving ship did not matter to me. I woke up in the morning, and got ready with my favorite ‘I love science’ t-shirt on. I took breakfast and immediately went to meet with my science team to help them out for the CTD and net tow stations. Today, I felt like a pro compared to yesterday. It was a bit confusing during the first day, but it was very easy today.
I started helping lowering the CTD in the ocean. Now I know when to use the lines for the CTD, water sampling for different kinds of testing, how to net tow and do the sargassum classification. I even know how to record the data.
When we have a station call from the bridge, then we work as a team and perform our daily CTD, water testing or net tow. But during the free time, we play card games and talk. Today was fun and definitely action packed. Two science team members dove into the ocean and brought the buoy back. I also saw a fire drill.
Nelson (the chief scientist) took me to see TGF or called the flow through station which is attached inside the bottom of the ship. This instrument measures temperature, salinity, chlorophyll, CDOM etc. Nelson explained the importance of this machine. I was very surprised by the precise measurements of this machine. Several hours later, I went to the captain’s chamber, also called the bridge. I learned how to steer the boat, and I was very excited and more than happy to sit on the captain’s chair and steer.
Excited to sit on the captain’s chair and steer the R/V Walton Smith
We have also seen groups of dolphins chasing our ship and making a show for us. We also saw flying fishes. In the evening, around 8 o’clock after dinner, I saw the beautiful colorful sunset from the ship. I took many videos and pictures and I can’t wait to process it and see my pictures.
Saw groups of dolphins ahead of ship
Around 10 o’clock in the night, it was net tow time again. We caught about 65 moon jelly fishes in the net and measured their volumes. Nelson also deployed a drifter in the ocean.
See moon jelly fish in my hand
Today was very fun and a great learning opportunity for me, and don’t forget the dolphins, they really made my day too!
Question of the Day:
How do you measure volume of solid (sea grass)?
New Word:
Sargassum
Something to Think About:
Why scientists use different instruments such as CTD as well as TFG to measuretemperature, salinity, chlorophyll, CDOM etc?
Challenge Yourself:
Why abundance of sargassum, types of animals and data collection is important in ocean?
Did you Know?
The two instruments were the Acoustic Doppler (ADCP) and the micro cat which was attached to the buoy. The micro cat measures salinity and temperature on profile of currents, which means it measures at surface of the ocean, middle of the ocean and bottom layer of the ocean too.
Animals Seen Today:
Five groups of dolphins
Seven flying fishes
Sixty five big moon jelly fishes
Two big crabs
NOAA Teacher at Sea
Valerie Bogan
Aboard NOAA ship Oregon II
June 7 – 20, 2012
Mission: Southeast Fisheries Science Center Summer Groundfish (SEAMAP) Survey
Geographical area of cruise: Gulf of Mexico
Date: Tuesday June 12, 2012
Weather Data from the Bridge: Sea temperature 28 degrees celsius, Air temperature 26.4 degrees celsius, building seas.
Science and Technology Log
Today I want to discuss the neuston net. This is a very large net made out of finely woven mesh which is deployed (shoved off the side of the boat) in order to catch plankton. There are three types of plankton: phytoplankton (plants and algae), zooplankton (animals), and ichytoplankton (baby fish). The neuston net rides along the surface of the water for ten minutes scooping up any organisms which are near the surface. After the ten minutes are up, the deck crew uses a crane to pull the net out of the water and bring it up to the point where someone can wash it down with a hose. This is necessary because not all of the plankton ends up in the cod end (the place where the collection jar is located) so we have to use a hose to get all of the loose stuff washed into the end of the net. After the net is washed down, the cod end is carefully removed, placed in a bucket and taken to the stern (back) of the ship where it is processed.
This is how the neuston net is moved from the ship into the water. From left to right Jeff, Marshall, and Chris are safely deploying the net.
To process the sample you must first empty the contents of the cod end into a filter which will allow the water to run out but will keep the sample. Then you transfer (move) the sample from the filter into a glass sample jar. Sometimes the sample smoothly slides into the jar and other times you have to wash down the filter with some ethanol. Once all of the sample is in the jar it is topped off with ethanol, a tag is placed inside the jar, and another tag is put on top of the jar. This sample is stored on the boat and taken back to the NOAA lab where it will be cataloged.
In this picture I am filtering out the water from the neuston sample so it can be placed in a sample jar.(Picture by Francis)
Personal Log
Today is our fifth day at sea and I’m feeling fairly comfortable with my duties on the ship. I was assigned to the night watch which runs from midnight till noon the next day. I’ll admit I didn’t make it the entire time the first day. We got done early and despite my intentions to stay up until my shift, I would have ended I falling asleep. The second night was better. I was beyond exhausted at the end, but I did manage to make it through the entire shift. At this point my mind and body have adjusted to the shift and I can easily drift to sleep at 3 pm and get up at 11:15 pm. Students, this is a great example of what it means to be responsible. If I was given the choice, do you think I would have chosen these crazy hours or to work twelve hours straight? No of course not but I really wanted to come on this expedition and this work assignment is part of the trip. So I’m doing the same thing I would expect you to do in a situation like this: accept it and get the work done.
Now I don’t want you to think that the trip is just about hard work. It’s also about seeing new places and getting to know some interesting people. I started out this trip in Pascagoula Mississippi, a city and state I never planned on visiting before this assignment. However, the people there were so helpful and friendly that I would gladly go back to see more of this region. All of you from the Kokomo area know that the major employers are automobile companies. Well, Pascagoula also has a major industry: ship building. So despite the distance between Kokomo and Pascagoula–about 900 miles–each town depends on an industry for their survival and both towns are incredibly proud of their contribution to society.
The major industry in Pascagoula is ship building.
I have been introducing you to parts of the ship, and today I’m going to tell you about the bridge. Now this is not the type of bridge that crosses a river, but rather the command center of the ship. The crew on the bridge is responsible for the safety of all personal on board and for the ship itself. There is a vast array of technology on the bridge which the crew uses to plot our course, check the weather, and to do hundreds of other things which are necessary for the ship to function.
This is the chart the bridge crew uses to plot our course.
NOAA Teacher at Sea Alexandra Keenan (Almost) Onboard NOAA Ship Henry B. Bigelow June 18 – June 29
Mission: Cetacean biology Geographical Area of Cruise: Gulf of Maine Date: June 16, 2012
Personal Log
Saludos! My name is Alexandra Keenan, and I teach Astronomy and Physics at Rio Grande City High School. Rio Grande City is a rural town located at the arid edge of the Rio Grande Valley. Because of our unique position on the Texas-Mexico border, our community is characterized by a rich melding of language and culture. Life in a border town is not always easy, but my talented and dedicated colleagues at RGC High School passionately advocate for our students, and our outstanding students gracefully rise to and surmount the many challenges presented to them.
Me in downtown Rio Grande City. Our historic buildings are evocative of the old “Wild West.”
Taquerias dot the highway running through our town– evidence of the binational character of the community.
I applied to the NOAA Teacher at Sea program because making careers in science seem real and attainable to students is a priority in my classroom. NOAA, the National Oceanic and Atmospheric Administration, provides a wonderful opportunity for teachers to have an interdisciplinary research experience aboard one of their research or survey ships. I believe that through this extraordinary opportunity, I can make our units in scientific inquiry and sound come alive while increasing students’ interest in and enthusiasm for protecting our ocean planet. I will also be able to provide my students firsthand knowledge on careers at NOAA. I hope to show my students that there is a big, beautiful world out there worth protecting and that they too can have an adventure.
The adventure begins on June 18th when the NOAA ship Henry B. Bigelow departs from Newport, RI. I’ll be on the vessel as a member of the scientific research party. We will be monitoring populations of the school-bus-sized North Atlantic right whale by:
using photo-identification techniques
obtaining biopsies from live whales (wow!)
catching zooplankton
recovering specials buoys that have been monitoring the whales’ acoustic behavior (the sounds they make)
Aerial view of North Atlantic right whale swimming with calf. (photo: NOAA)
Why would we do all of this? Because North Atlantic Right Whales are among the most endangered whales in the world. Historically, they were heavily hunted during the whaling era. Now, they are endangered by shipping vessels and commercial fishing equipment. The data we gather and analyze will help governing bodies make management decisions to protect these majestic animals.
NOAA ship Henry B. Bigelow (photo: NOAA)
The next time you hear from me, it’ll be from the waters of the Gulf of Maine!
NOAA Teacher at Sea
Valerie Bogan
Aboard NOAA ship Oregon II
June 7 – 20, 2012
Mission: Southeast Fisheries Science Center Summer Groundfish (SEAMAP) Survey
Geographical area of cruise: Gulf of Mexico
Date: Friday June 15, 2012
Weather Data from the Bridge:
Sea temperature 28 degrees celsius, Air temperature 26.4 degrees celsius, calm seas.
Science and Technology Log
The scientific device for this blog entry is called the Bongo net. This apparatus is actually two nets which are mounted on a metal frame. Each net has a diameter of 60 cm and is 305 cm long with a cod end which is the narrowest part of the net to catch the plankton (both plants and animals). At the opening of each net is a flow meter which records the amount of water that passes through the net in liters. This allows the scientists to calculate the total population of each type of plankton without having to collect all the plankton in the area. This is done by first finding out how many individuals there are of each species in the sample. Then you calculate the number of liters in the transect (sample area) by multiplying the length of the transect by the width of the transect to find the area in square meters. To find the volume, you multiply the area by the depth which will give you the amount of water in cubic meters. Lastly you have to take the volume in cubic meters and convert it to cubic liters. Now that you have found the amount of water in the transect you are ready to find the number of each species of plankton in that amount of water. To do this you take the number of individuals in the entire sample and divide it by the amount of liters which flowed through the net during sampling to find the number of the species per liter. Then you multiply that number by the total amount of liters in the transect which gives you an estimate of how many of that species exist in that part of the Gulf of Mexico.
In this picture I am helping Jeff bring the Bongo nets back on board the ship. (Picture by Francis Tran)
NOAA personnel aren’t the only scientists on board. There is also a volunteer named Marshall Johnson, who just finished his master’s degree at the University of South Alabama where he was working on a project involving larval fish and what they eat. He chose to come on this cruise in order to help a fellow student collect samples for her Master’s degree. Thus far he has been amazed by the vast array of sea life that have shown up in our nets and have been seen swimming around our ship. He has almost finished his Master’s degree and his dream job would be to captain a charter boat so he can share his love of sea life and fishing with other people. His advice for middle school students, “Dream big and follow your goals”.
Marshal holding two of his favorite species in the dry lab.
We also have a NOAA intern on board named Francis Tran who is going into his junior year at Mississippi State University where he is studying electrical engineering. He found out about the internship through his university and applied by submitting an essay and references to the coordinator of the program. His advice for middle school students, “do something you love, don’t settle”.
Francis with his favorite animal the brown shrimp.
Personal Log
We have been at sea for one whole week and honestly it is going better than I expected. I was uncertain if I could live on a ship for this amount of time due to my intense independence. I’m not used to giving up control of where I am and what I am doing so I feared I would be tempted to jump overboard and start swimming to shore by now. However I have found that I’m quite content to stay on the ship and am enjoying my time at sea immensely. However, I do miss my workouts. There is some exercise equipment on board but finding the time to use it is impossible. I also miss my daily yoga practices but with the ship pitching from side to side unpredictably I’m afraid of giving it a try because it is quite possible I would be doing downward facing dog pose and the ship would pitch me head first into a wall.
In order for a ship to stay at sea for an extended time it must have a well-stocked galley (kitchen) and serve excellent food. As I have mentioned before, the shifts are long and don’t exactly match up with normal meal times so it is important for the crew to be able to grab a little something in between meals. For example since my shift starts at midnight I’m hungry for breakfast at about 2 a.m., not the normal breakfast time, but I’m able to pour myself some cereal so that I am working with a full stomach and am able to concentrate on my work. However, we do have three wonderful meals prepared for us each day. Paul and Walter are the men who work to make sure the crew and scientists are well taken care of when it comes to mealtimes.
Alonzo and Chris hanging out in the galley having a little snack.
NOAA Teacher at Sea Jennifer Fry
Onboard NOAA Ship, Oscar Elton Sette March 12 – March 26, 2012
Mission: Fisheries Study Geographical area of cruise: American Samoa
Date: March 15, 2012
Pago Pago, American Samoa
Science and Technology Log:
Nighttime Cobb Trawling : Day 4
We began the trawling around 8:30 p.m. The data we collect tonight will replace the previous trawl on day 2 which was flawed in the method by which the experiment was collected. The Day 2 experiment was when the winch became stuck and the trawl net was left in the water well over 2 ½ hours, long past the 1 hour protocol.
Here’s is what the science team found.
Tonight the trawl nets went into the ocean and were timed as all the other times.
During the sorting we found some very interesting species of fish which included:
Pyrosomes: chordate/Tunicate
Two Juvenile cow fish (we placed them into a small saltwater tank to observe interesting species caught in the net.)
This is a great place to make further observations of these unique animals.
The data collected included:
Name of fish:
Numbers Count
Volume (milliliters)
Mass (grams)
Myctophids
120
700
650
Non-Myctophids
148
84
115
Crustaceans
77
28
40
Cephalopods:
16
64
50
Gelatinous zooplankton
71
440
400
Misc. zooplankton
n/a
840
900
The Cobb trawl net was washed, rinsed and the fish strained through the net. They were then brought inside the web lab for further sorting.
The white-tailed tropic bird is a regular visitor to the South Pacific islands.
We were close to finishing the sorting, counting, and weighing when suddenly we heard something at the back door of the lab. Fale, the scientist from American Samoa went to the door and proceeded to turn the latch, and slowly opened the door. There huddled next to the wall, near some containers was a beautiful black and white Tropic bird, a common bird of this area. Its distinctive feature was the single white tail feather that jutted out about 1 foot in length. He looked just as surprised to see us and we were of him. He did not make a move at all for about 10-15 minutes . We took pictures and videos to mark the occasion, yet he still didn’t budge or act alarmed.
With a bit more time passing, he began to walk, or more like waddle like a duck. His ebony webbed feet made it difficult to maneuver over the open slats in the deck. He attempted flight but appeared to get confused with the overhanging roof.
I quickly found a small towel and placing it over his head, gently carried him to a safe spot on the aft deck where he would have no trouble flying away.
The time was about 2:00 a.m. when we were distracted by the ship’s fire alarm, and we quickly reported to our muster stations. Luckily, there was no fire and we returned resuming our trawl data collection. Upon reaching the wet lab, we noticed at the stern of the ship, our newly found feathered friend had flown off into the dark night.
It was a great way to end our night with research and early hour bird watching. How lucky we all are to be in the South Pacific.
Animals Seen:
Ppyrosome
Pictured here is a Pyrosome which many came up in our Cobb net.
Cow fish
Our trawl net caught three juvunile cow fish specimans which were quickly placed in our observation tank for further study.
Tropical bird
The Tropic bird, with its distinctive long tail feather, is common in the South Pacific.
NOAA Teacher at Sea Dave Grant Aboard NOAA Ship Ronald H. Brown February 15 – March 5, 2012
Mission: Western Boundary Time Series Geographical Area: Sub-Tropical Atlantic, off the Coast of the Bahamas Date: March 3, 2012
Weather Data from the Bridge
Position:30 deg 37 min North Latitude & 79 deg 29 min West Longitude
Windspeed: 30 knots
Wind Direction: North
Air Temperature: 14.1 deg C / 57.4 deg F
Water Temperature: 25.6 deg C / 78.4 deg F
Atm Pressure: 1007.2 mb
Water Depth:740 meters / 2428 feet
Cloud Cover: 85%
Cloud Type: Cumulonimbus and Stratus
Science/Technology Log:
Entering the Gulf Stream and Straits of Florida
“There is in the world no other such majestic flow of waters.
Its current is more rapid than the Mississippi or the Amazon.
Its waters, as far out from the Gulf as the Carolina coasts, are of an indigo blue.
They are so distinctly marked that their line of junction with the common sea-water
may be traced by the eye.”
Matthew Maury – The Physical Geography of the Sea
While our cruise could hardly be called leisurely, most sampling has been spread out between sites, sometimes involving day-long periods on station while the CTD and moorings are recovered from great depths (5,000 meters). However, Chief Scientist Dr. Baringer regularly reminds us that west of the Bahamas in the Gulf Stream transect, our stations are in much shallower water (≤800 meters) and close together (The Florida Straits are only about 50 miles wide), so we should anticipate increased activity on deck and in the lab. In addition to the hydrology measurements, we will deploy a specialized net to sample those minute creatures that live at the surface film of the water – the neuston.
The Neuston net is deployed for a 10-minute tow.
Now that we have crossed the Bahama Banks and are on-station, the routine is, as expected, very condensed, and there is little time to rest. What I did not anticipate was the great flow of the Gulf Stream and the challenge to the crew to keep the Brown on our East-West transect line as the current forces us north. Additionally, as Wordsworth wrote, “with ships the sea was sprinkled far and wide” and we had to avoid many other craft, including another research ship sampling in the same area.
Ben Franklin is famous for having produced the first chart of this great Western Boundary Current, but naval officer Matthew Maury – America’s Scientist of the Sea – and author of what is recognized as the first oceanography text, best described it. Remarkably, in The Physical Geography of the Sea, first published in 1855, he anticipates the significance of this major climate study project and summarizes it in a short and often-quoted paragraph:
“There is a river in the ocean. In the severest of droughts it never fails,
and in the mightiest floods it never overflows.
Its banks and its bottom are of cold water, while its current is of warm.
The Gulf of Mexico is its fountain, and its mouth is the Arctic seas.
It is the Gulf Stream.”
Gulf Stream water
CTD data from the Straits of Florida 1. Note that temperature (Red) decreases steadily with depth from about 26-degrees C at the surface, to less than 10-degrees C at 700 meters. (Most of the ocean’s waters are cool where not warmed by sunlight). 2. Dissolved Oxygen (Green) varies considerably from a maximum at the surface, with a sharp decline at about 100 meters, and a more gradual decline to about 700 meters. (Phytoplankton in surface water produce excess oxygen through photosynthesis during daylight hours. At night and below about 100 meters, respiration predominates and organisms reduce the level of dissolved oxygen.) 3. Salinity (Blue) is related to atmospheric processes (Precipitation and Evaporation) and also varies according to depth, being saltiest at about 150 meters.
At Midnight, just within sight of the beam of the Jupiter Inlet Lighthouse (And to the relief of the home-sick sailors on board – “Finally – after more than two weeks, we are within the range of cell phone towers!”) we began our studies of the Straits of Florida and the Gulf Stream. Nine stations in rapid order – standing-by for a CTD cast, and then turning into the current to set the neuston net for a ten-minute tow.
The purpose of the net is to sample creatures that live on or visit the interface between air and water, so the mouth of the net is only half submerged. Neuston comes from the Greek for swimming and in warm waters a variety of invertebrates and even some young mesopelagic fishes rise within a few centimeters of the surface at night to filter phytoplankton and bacteria, and feed upon other zooplankton and even drowned terrestrial insects that have been blown out to sea.
On the upper side of this water/atmosphere interface, a smaller variety of floating invertebrates, notably Physalia and Velella (Portuguese man-of-war and By-the-wind-sailor) use gas-filled buoyancy chambers or surface tension to ride the winds and currents. This much smaller group of seafarers is further classified by oceanographers as Pleuston.
Prior to this cruise, my experience with such a sampling device was limited – Years ago, spending miserable nights sailing in choppy seas off of Sandy Hook, NJ searching for fishes eggs and larva rising to the surface after dark; and later, much more enjoyable times studying water striders – peculiar insects that spend their lives utilizing surface tension to skate along the surface of Cape Cod ponds.
Our CTD and net casts are complicated by rising winds and chop, but some great samples were retrieved. Once the net is recovered, we rinse it down with the seawater hose, collect everything from the bottle at the codend, rinse off and separate the great mass of weed (Sargassum) and pickle the neuston in bottles of alcohol for analysis back at the lab.
Midnight shift: Recovering the net by moonlight.
Since much of the zooplankton community rises closer to the surface at night where phytoplankton is more concentrated and the chances of being preyed upon are slimmer, there are some noticeable differences in the samples taken then and during daylight hours. Unavoidably, both samples contain great quantities of Sargassum but the weed-colored carapaces of the different crustaceans are a clue to which specimens are from the Sargassum community and which are not.
Gulfweed Shrimp – Latreutes
We hit the jackpot early; snaring a variety of invertebrates and fishes, including the extraordinarily well-camouflaged Sargassum fish – a piscatorial phenomenon I’ve hoped to see ever since I was a kid reading William Beebe’s classic The Arcturus Adventure. What a tenuous existence for such a vulnerable and weak swimmer, hugging the Sargassum as it is dashed about in the waves. Even with its weed-like disguise and ability to blend in with the plants, it must lead a challenging life.
A unique member of the otherwise bottom-dwelling frogfishes, the Histriohistrio has smooth skin, and spends its life hitch-hiking along in the gulf-weed forest. Like other members of the family Antennariidae, it is an ambush predator, luring other creatures to their doom by angling with its fleshy fins.
The Sargassum fish (Histrio)
Needlefish and Sargassum fish
Another highlight for me is the water striders we found in several samples. These “true bugs” (Hemiptera) are remarkable for several reasons. Most varieties of these “pond-skaters” (Or Jesus Bugs if you are from Texas) are found on calm freshwater lakes and streams, but a few members of this family (Gerridae) are the only true marine insects – representing a tentative Arthropod reinvasion of the sea after their splendid foray onto land hundreds of millions of years ago.
Two great finds: Sygnathus pelagicus– A Sargassum pipefish – a cousin of the sea horse. Halobates – the water strider. An example of the Pleuston community.
Using surface tension to their advantage, they “skate” along by flicking their middle and hind legs, and can even “communicate” with each other by vibrating the surface of the water with the hair-like setae on their feet. On lakes their prey is other insects like mosquito larvae, confined to the surface. How they manage to find food and communicate at the surface of the raging sea is a mystery, but whatever the means, they are adept at it, and we recovered them in half of the samples.
The ocean’s insect: The remarkable water stride
The scientists who provided the net are generally more interested in ichthyoplankton to monitor fish eggs and larvae to predict population trends, and monitor impacts like oil spills; so this is why samples are preserved to return to the lab in Miami.
Before packing up things after our marathon sampling spree I was able to examine our catch and observed a few things:
1. I am the “High-Hook” on the cruise – catching far more fishes (albeit tiny ones) than the rest of the crew with their fishing poles. (Needlefish, sargassum fish, pipe fish, filefish and several larval species)
2. Depending on the time of day the samples were taken, there is a marked difference in the quantity and composition of organisms that have separated from the Sargassum and settled in the sample jars – (Noticeably more at night than during daylight hours).
3. There appears to be a greater variety of sea grasses present (Turtle grass, etc.) on the eastern (Bahamas side) of the Straits. We observed one seabean – drift seeds and fruits (or disseminules) from terrestrial plants.
4. Plastic bits are present in all samples – particularly plastic ties (Table 1.)
Settled organisms in sample jars.
Sargassum fauna: Portunid crab – with eggs on her belly. (Portunus was a Roman god – Protector of harbors and gates,
who supposedly also invented navigation)
Belly view of a Caridean shrimp
A tiny fish egg ready to hatch!
A larval fish begins its perilous journey in the Gulf Stream.
Site/Local time
Notable Contents*
Biomass
Site
Depth
8 Day 17:48
Weed, Grasses(3 spp)
3.0 mm
79˚12’
485 m
7 Day 16:10
Grasses(4 spp)
2.0 mm
79˚17’
616 m
6 Day 14:30
Grasses(2 spp) Fish eggs and larva
Trace
79˚22’
708 m
5 Day 12:45
Water striders, Grass (1 spp)
Trace
79˚30’
759 m
4 Day 10:13
Crustacean larva, shrimp (large),
7.0 mm
79˚36’
646 m
3 Dawn 07:53
Crustacean larva, shrimp (large), water striders
Trace
79˚41’
543 m
2 Night 05:10
Crustacean larva, shrimp (small), Pipefish, water striders
*Plastic bits and Sargassum weed and its endemic epibionts are present in all samples.
Table 1. Contents in sample jars.
There is a marked difference in the quantity and composition of organisms collected at night (Left).
There is a marked difference in the quantity and composition of organisms collected during the day (Right).
With sampling completed we steer north to ride the Gulf Stream towards the Brown’s home-port, and turn away from the bright lights of Florida …
“Where the spent lights quiver and gleam;
Where the salt weed sways in the stream;
Where the sea-beasts rang’d all around
Feed in the ooze of their pasture ground:”
Matthew Arnold
“Red sky at morning…sailor take warning!”
Homeward bound:
A storm battering the Midwest will impede our progress back north to Charleston and threatens to bring us the only foul weather of the cruise. Note the location of the cold front over the Florida Straits.
“Now the great winds shoreward blow; Now the salt tides seaward flow; Now the wild white horses play, Champ and chafe and toss the spray.”
Matthew Arnold
As the sailors say: “The sheep are grazing.” A gale is brewing and kicking up whitecaps as we sail north to Charleston.
NOAA Teacher at Sea Dave Grant Aboard NOAA Ship Ronald H. Brown February 15 – March 5, 2012
Mission: Western Boundary Time Series Geographical Area: Sub-Tropical Atlantic, off the Coast of the Bahamas Date: March 2, 2012
Weather Data from the Bridge
Position: 26 degrees 19 minutes North Latitude & 79 degrees 55 minutes West Longitude
Windspeed: 14 knots
Wind Direction: South
Air Temperature: 25.4 deg C / 77.7 deg F
Water Temperature: 26.1 deg C / 79 deg F
Atm Pressure: 1014.7 mb
Water Depth: 242 m / 794 feet
Cloud Cover: none
Cloud Type: NA
“The moment one gives close attention to anything, even a blade of grass,
it becomes a mysterious, awesome, indescribably magnificent world in itself.”
Henry Miller
My evenings looking through the microscope are a short course in invertebrate zoology. Every drop of water filtered through the plankton net reveals new and mystifying creatures. Perhaps 90% of marine invertebrates, like newly hatched mollusks and crustaceans, spend part of their life in a drifting stage – meroplankton; as opposed to holoplankton – organisms that are planktonic throughout their life cycle.
MOLLUSK LARVAE
Bivalve
Univalve
The lucky individuals that escape being eaten, and are near a suitable substrate at the right moment, settle out into a sedentary life far from their place of origin. For the long distance travelers swept up in the Gulf Stream, the most fortunate waifs of the sea that survive long enough might make it all the way to Bermuda. The only hope for the remainder is to attach to a piece of flotsam or jetsam, or an unnatural and unlikely refuge like the electronic picket fence of moorings the Ron Brown is servicing east of the Bahamas.
“The gaudy, babbling, and remorseful day, Is crept into the bosom of the sea.” Shakespeare
A league and a half* of cable, sensors and a ton of anchor chain are wrestled on deck during a day-long operation in the tropical heat. (*A mariner’s league equals three nautical miles or 3041 fathoms [18,246 feet])
It is easy to be humbled by the immensity of the sea and the scope of the mooring project while observing miles of cable and buoys stretched towards the horizon, about to be set in place with a ton of anchor chain gingerly swung off the stern for its half-hour trip to the bosom of the sea.
Thanks to the hard labor and alert eyes of our British and French (“And Irish”) colleagues retrieving and deploying the attached temperature and salinity sensors, I am regularly directed to investigate “something crawling out of the gear” or to photograph bite marks from deep sea denizens on very expensive, but sturdy equipment.
A retrieved sensor with bite marks.
To my surprise, other than teeth marks, very little evidence of marine life is present on the miles of lines and devices strung deeper than about 200 meters. This may be due in part to the materials of which they are constructed and protective coatings to prevent bio-fouling, but sunlight or more precisely, the attenuation of it as one goes deeper, is probably the most important factor.
Fireworm (Drawings and images by Dave Grant – NOAA Ron Brown)
Handle with care! Close-up of worm spines
The first discovery I was directed to was a striking red bristle worm wiggling out of the crevice in a buoy. It appears to be one of the reef-dwelling Amphinomids – the aptly-named fireworms that SCUBA divers in the Caribbean avoid because of their venomous spines; so I was cautious when handling it. This proved to be the deepest-dwelling organism we found, along with some minute growths of stony and soft corals.
“Five o’clock shadow” on a buoy – A year’s growth of fouling organisms – only an inch tall.
On shallower buoys and equipment, there are sparse growths of brown and blue-green algae, small numbers of goose barnacles, tiny coiled limey tubes of Serpulid worms like the Spirobis found on the floating gulfweed, some non-descript bivalves (Anomia?) covered with other fouling growth, skeleton shrimp creeping like inch-worms, and of course the ubiquitous Bryozoans. Searching through this depauperate community not as challenging as the plankton samples, but not surprising since our distance from land, reefs or upwelling areas – and especially clear water and lack of seabirds and fishes; are all indicators that this is a nutrient-deficient, less productive part of the ocean.
Bio-fouling – “on the half-shell.” Skeleton shrimp (Caprellidae)
The Ron Brown is the largest workhorse in the NOAA fleet and its labs and decks are intentionally cleared of equipment between cruises so that visiting scientists can bring aboard their own gear that is best suited to their specific project needs. NOAA’s physical oceanographers from Miami arrived with a truckload of crates holding Niskin water sampling bottles for the CTD and their chemistry equipment for DO (Dissolved Oxygen) and salinity measurements; and in a large shipping container (“Ship-tainer”) from England, the British and French (“and Irish”) scientists transported their own remote sensing gear, buoys, and (quite literally) tons of massive chain and cables to anchor their moorings. (I am surprised to learn from the “Brits” that the heavy chain is shipped all the way from England because it is increasingly hard to acquire. )
In the lab: Scores of sensors serviced and ready for deployment
This is how most science is facilitated on the Brown and it requires many months of planning and pre-positioning of materials. I am lucky and can travel light – and with little advanced preparation. I am using simple methods to obtain plankton samples and images via a small portable microscope, digital camera and plankton net which I can cram into my backpack for any trips that involve large bodies of water. The little Swift* scope has three lens (4x, 10x, 40x) with a 10x ocular, and I get great resolution at 40x, and can get decent resolution to 100x. Using tips from Dave Bulloch (Handbook for the Marine Naturalist) I am able to push that somewhat with a simple Nikon Coolpix* point-and-shoot camera – but lose some of the sharpness with digital zoom. As you might suspect, the ship’s movement and engine vibration can be a challenge when peering through the scope, but is satisfactory for some preliminary identification. (*These are not commercial endorsements, but I can be bought if either company is willing to fund my next cruise!)
PHYTOPLANKTON
Centric diatom – Coscinodiscus
Dinoflagellates – Different Ceratium species
ZOOPLANKTON
A Plankton précis
Collecting specimens would be much more difficult without the cooperation of the Brown’s crew and visiting scientists, and their assistance is always reliable and appreciated. The least effective method of collection has been by filtering the deep, cold bottom water brought up in the Niskin bottles. As mentioned earlier, no live specimens were recovered; only fragments of diatom and Silicoflagellate skeletons surviving the slow drift to the bottom, which I have been able to identify through deep sea core images posted at the Consortium for Ocean Leadership website.
Needless to say, the most indiscriminate method of collection and the most material collected is through the large neuston net. The greatest biomass observed on the trip is the millions of tons of Sargassum weed, which covers the surface in great slacks around us that are even visible in satellite images.
Although the continuous flow of ocean water pumped into the wet lab and through my plankton net is effective and the most convenient collection method, the most surprising finds are from the saltwater intake screens that the engineer directed me to. This includes bizarre crystal-clear, inch-long, and paper-thin Phylosoma – larvae of tropical lobsters – that I initially mistook for pieces of plastic.
Inch-long Phylosoma larvae on a glass slide. (One of the tropical lobsters.)
“All the ingenious men, and all the scientific men, and all the fanciful men in the world …
…could never invent anything so curious and so ridiculous, as a lobster.”
Charles Kingsley -The Water-Babies
Plankton communities are noticeably different between the Gulf Stream, inshore, and offshore in the pelagic waters east of the Bahamas. Near the coast, either the shallower Bahama Banks or the neritic waters over the continental shelf closer to Charleston, the plankton is larger, more familiar to me and less challenging to sort, including: copepods, mollusk larvae and diatoms. Steaming over the shelf waters at night, the ship’s wake is often phosphorescent, and dinoflagellates, including the “night-light” Noctiluca are common in those samples.
Dinoflagellate – Noctiluca
The waters east of the Bahamas along the transect line are notable for their zooplankton, including great numbers and varieties of Foraminifera, and some striking amphipod shrimp. Compared to cooler waters I am familiar with, subtropical waters here have over a dozen species of Forams, and some astonishingly colorful shrimp that come up nightly from deeper water.
It’s not all work and no play on the Ron Brown, and there are entertaining moments like decorating foam cups with school logos to send down with the CTD to document the extreme pressure at the bottom. Brought back to class, these graphically illustrate to younger students the challenges of deep sea research.
Foam cup: Before-and-after a trip to 5,000 meters
Navigating by Dead-reckoning
On calm days while we are being held on-station by the Brown’s powerful thrusters, I can measure current speeds using Sargassum clumps as Dutchman’s logs as they drift by. Long before modern navigation devices, sailors would have to use dead-reckoning techniques to estimate their progress. One method used a float attached to a measured spool of knotted line (A log-line), trailing behind the moving vessel. The navigator counted the number of knots that passed through his hands as the line played out behind the ship to estimate the vessel’s speed (in knots). Since nothing is to be tossed off the Brown, I rely on a simpler method by following the progress of the Sargassum as it drifts by stem-to-stern while we are stationary at our sampling site. Since I know the length of the Brown at the waterline (~100-meters), I can estimate current speed by observing drifting Sargassum.
Watching sargassum, I wonder if a swimmer could keep pace with the currents in these waters. When in college
my brothers and would strive to cover a 100-meter race by swimming it in under a minute. Here is the data from east of the Bahamas. See if you can determine the current speed there and if a good swimmer could keep pace.
ESTIMATING CURRENT SPEED
Data on currents:
Average of three measurements of Sargassum drifting the length of the Ron Brown = 245 seconds.
Length of the Ron Brown – 100-meters.
1. How many meters per second is the current east of the Bahamas?
2. As a swimmer in college – with my best time in the 100-meters freestyle of one minute – could I have kept up with the Ron Brown… or been swept away towards the Bahamas?
Other navigational exercises I try to include determining Latitude and Longitude. Latitude is easy as long as you can shoot the sun at midday or find the altitude of Polaris in the night sky; and sailors have done that for centuries. The ship’s navigator will get out the sextant for this, or, since the width of one’s fist is about 10-degrees of sky, I can estimate the height of both of these navigational beacons by counting the number of fists between the star and the horizon.
ESTIMATING LATITUDE
Data:
Night observation (Shooting the North Star) – Number of Fists from the Northern horizon to Polaris = 3
Day observation (Shooting the Sun) – Number of Fists from the Southern horizon to the Sun = 5.5
If the width of a fist is equal to about 10-degrees of horizon, our estimate of Latitude using Polaris is 30-degrees (3 x 10).
Not too bad an estimate on a rocking ship at night, compared to our actual location (See Data from the Bridge at the top.).
Shooting the Sun at its Zenith at 12:30 that day gives us its altitude as 55-degrees – which seems too high unless we consider the earth’s tilt (23.5-degrees). So if we deduct that (55 – 23.5) we get 31.5, which is closer to our actual position. And if we consult an Almanac, we know that the sun is still about six degrees below the Equator on its seasonal trip North; so by deducting that (31.5 – 6) we end up with an estimate of 25.5-degrees. This is an even better estimate of our Latitude.
Here is the dreaded word problem:
By shooting the Sun, our best estimate of Latitude is 25.5 degrees (25 degrees/30 minutes)
The actual Latitude of the ship using GPS is 26-degrees/19 minutes.
If there are 60 minutes to a degree of Latitude – each of those minutes representing a Nautical Mile – how many Nautical Miles off course does our estimate place us on the featureless sea?
**************************
Longitude is much harder to determine if you don’t have an accurate timepiece to compare local time with universal time (The time at Greenwich, England), and an accurate ship’s chronometer wasn’t in use until the mid-1700’s.
To understand the challenge of designing a precise timepiece that reliably will function at sea, I used two crucial clock mechanisms: a pendulum and a spring. Finding a spring was easy, since “Doc” had a scale at Sick Bay. For the pendulum I fashioned a small weight swinging on a string)
Using the scale to observe the ship’s motion.
Standing on the scale and swinging the pendulum even in calm weather quickly demonstrated three things:
First: I have developed my sea legs, and no longer notice the regular motion of the ship. Second: Even when the sea feels calm, the scale’s spring mechanism swings back and forth under my weight; adding and deducting 20 pounds to my real weight and reflecting the ship’s rocking that I no longer notice. Three: On rough days, even if I can hold still, the ship’s heaving, pitching and rolling alters my pendulum’s reliable swing – its movements reflecting the ship’s indicator in the lab. Experimenting helps me appreciate clock-maker John Harrison, and his massive, 65-pound No. 1 Ship’s Chronometer he presented to the Royal Navy in 1728.
Ship movement as recorded by the computer
Doc: Always on duty – Sick Bay on the Ron Brown
Besides having very well-provisioned Sick Bays, NOAA ships have experienced and very competent medical officers. Our “Doc” received his training at Yale, and served as a medic during the Gulf War.
Especially alert to anyone who exhibits even the mildest symptoms of sea-sickness, Christian is available 24-hours for emergencies – and in spite of the crew constantly wrestling with heavy equipment on a rocking deck, we’ve only experienced a few minor bumps and bruises. He has regular office hours every day, and is constantly on the move around the ship when not on duty there.
Besides keeping us healthy, he helps keep the ship humming by testing the drinking water supply (The Brown desalinates seawater when underway, but takes on local water while in port); surveys all departments for safety issues; and with the Captain, has the final word if-or-when a cruise is to be terminated if there is a medical emergency.
Since a stormpounding the Midwest will head out to sea and cross our path when we head north to Charleston, he is reminding everyone that remedies for sea sickness are always available at his office door, and thanks to NASA and the space program, if the motion sickness pills don’t work, he has available stronger medicine. So far we have been blessed with relatively calm weather and a resilient crew.
The warm (Red) Gulf Stream waters viewed from a satellite image.
Contact: The edge of the Gulf Stream – Matthew Maury’s River in the Ocean
Birdwatching on the Ron Brown
For the time being I take advantage of the calm seas to scrutinize what’s under the microscope, and when on break, look for seabirds. East of the Bahamas, as anticipated after consulting ornithologist Poul Jespersen’s map of Atlantic bird sightings, I only spotted two birds over a two-week stretch at sea (storm petrels). This is very much in contrast to the dozens of species and hundreds of seabirds spotted in the rich waters of the Humboldt Current off of Chile , where I joined the Brown in 2008.
(http://ux.brookdalecc.edu/staff/Web%2012-2-04/seabirds/Brown%20terns%202/Terns%20%20fixed/SEPacific.html)
Passing through Bahamian waters was no more rewarding, but now that we are west and in the Florida Straits there are several species of gulls during the day, and at night more storm petrels startled by the ship’s lights. One windy night a large disoriented bird (Shearwater?) suddenly fluttered out of the dark and brushed my head before bumping a deck light and careening back out into the darkness. Throughout the day a cohort of terns has taken up watch on the forward mast of the Brown and noisily, they juggle for the best positions at the bow – resting until the ship flushes a school of flying fishes, and then swooping down across the water trying and snatch one in mid-air. Like most fishermen, they are successful only about 10% of the time.
Caspian tern “on station” at the jack mast.
Royal tern “on station” at the jack mast.
*************************************
Despite the dreary forecast from the Captain, Wes and I are enthusiastic about all we have done on the cruise and formulated a list of why NOAA’s Teacher At Sea program is so rewarding.
Top Ten Reasons:
Why be a Teacher At Sea?
10. Fun and excitement exploring the oceans!
9. Meeting dedicated and diligent scientists and crew from around the world!
8. Bragging rights in the Teachers’ Room – and endless anecdotes!
7. Cool NOAA t-shirts, pins and hats from the Ship’s Store!
6. Great meals, three times a day…and FREE laundry!
5. Amazing sunsets, sunrises and star-watches!
4. Reporting on BIG science to students…and in real-time!
3. Outstanding and relevant knowledge brought back to students and colleagues!
2. First-hand experience that relates to your students’ career objectives!
1. Rewarding hours in the lab and field…remembering why you love science and sharing it with students!
NOAA Teacher at Sea Dave Grant Aboard NOAA Ship Ronald H. Brown February 15 – March 5, 2012
Mission: Western Boundary Time Series Geographical Area: Sub-Tropical Atlantic, off the Coast of the Bahamas Date: February 22, 2012
Weather Data from the Bridge
Position:26.30 N – 75.42 W
Windspeed: 0
Wind Direction: Calm
Air Temperature: 29 C
Water Temperature: 24 C
Atm Pressure: 1025
Water Depth: 4,410 meters
Cloud Cover: 0
Cloud Type: Slight haze
Science/Technology Log:
We are becalmed and even the veteran sailors onboard are remarking on how flat the sea has become. At about 30 degrees North and South Latitude, moist, low pressure air that was heated and lifted from the surface at the Equator has cooled and is now plunging back down to Earth, forming a line of light winds in a band across the sea. This dry, high pressure air becomes the Trade winds as it is drawn back towards the Equator along the sea surface in what is called a Hadley Cell (After its discoverer). We seem to be on the edge of this meteorological milepost, which was more than a nuisance in the days of sail. If stranded in its pattern too long, food and especially drinking water became an issue, and the first to suffer would be animals being transported from the Old World to the New. Legend has it that subsequent voyagers would come across their carcasses…hence the name Horse Latitudes.
While observing ships returning to port near his home, sixteen year-old future rock star Jim Morrison (The DOORS) composed what is perhaps his most eerie ballot – Horse Latitudes.
“When the still sea conspires an armor And her sullen and aborted Currents breed tiny monsters True sailing is dead Awkward instant And the first animal is jettisoned Legs furiously pumping”
However, the stable ship makes deck work easier and I am catching up on samples under the microscope, including some of my own tiny “monsters” that the currents have bred.
“It is the astonishing variety of life that makes the sea such a fascinating
hunting ground. Get a tow-net, dredge and simple microscope,
and a new world is yours – a world of endless surprises.”
(Sir Alister Hardy)
The chief survey technician set me up with his flow-through seawater system and I can leave a net under it to continuously gather plankton. I have noticed some patterns already. One: Phytoplankton is scarce compared to temperate waters off of New Jersey, and this helps account for the clarity and
brilliant blue color of the water. The absence of large rivers here adding nutrients to the system, and little coastal
upwelling, means that there is little to fertilize plantlife. Two: More accumulates in the nets at night, confirming that Zooplankton rises to the surface at in the dark. This diurnal
pattern of the plankton community has been well documented ever since biologists and fishermen went to sea. Three: Also, there is much more plankton at the surface than in deeper water. This is no surprise since sunlight is the
key ingredient at the surface of this ocean ecosystem. Four: Creatures from offshore tend to have a more feathery look about them than inshore species. This added surface
area may use the turbulence to help support them near the surface and increase their buoyancy.
It is said: “Turn off the sun, and the oceans will starve to death in a week.” It is assumed that among other stresses on the Biosphere that accompany disastrous impacts of large asteroids, dust and ash from these rare collisions block out enough sunlight to stifle photosynthesis, causing Phytoplankton (The “Pasture of the Sea”) to waste away, and setting the stage for the collapse of the Food Chain and mass extinction events. Fortunately we have plenty of brilliant sunshine here and no celestial catastrophes on the horizon.
Some of the most interesting Zooplankton are the Pteropods, the Sea Butterflies.
Empty shell and live pteropod specimen
(Images on the Ron Brown by Dave Grant)
The renowned oceanographer Alister Hardy used them as indicators of different water masses flowing around the British Isles; and New England’s great oceanographer, Alfred Redfield correlated their drifting with the anti-clockwise circulation of water in the Gulf of Maine. Although most are small and less than an inch long, they feed on a variety of creatures and in turn become food for many others. In surface waters they gather phytoplankton, some utilizing cilia and mucus to sweep food to the mouth; but in deeper waters, others are carnivorous.
I am informed by our English colleagues that on Europe’s fishing grounds, they are sometimes fed upon by herring, cod and haddock; which is bad news for British fishermen, whose catch rapidly decays and is not marketable. Such fish are referred to as “black gut” or “stinkers.”
How concentrated are pteropods? Whales and seabirds that we hope to encounter later in the cruise are sustained by them, and in the warmer waters of the Atlantic, at relatively shallow depths and on the tops of submerged peaks at around 2,000 meters, R.S. Wimpenny reports considerable deposits of “pteropod ooze” from their descending shells, covering an estimated 1,500,000 square kilometers of the bottom of the Atlantic (An area the size of the Gulf of Mexico.). Like the Foraminifera, in deeper waters the aragonite in their shells (a more soluble form of calcium carbonate) dissolves, and other sediments like silicates from diatoms accumulate instead. Check out any oceanography text and you are likely to find a picture of this biogenic pteropod mud, as well as other types of deposits.
At least 90% of the animals in the ocean are meroplankton – spending time in this itinerant stage before becoming adults. This phase may vary from a few days to over a year, depending on the creature. (European eels larva are the long distance champions; for over a year, drifting from below us in their Sargasso Sea breeding grounds, all the way to rivers in Britain and France.)
Drifting larvae are cheap insurance for a species, filling the surrounding habitat with individuals of your own kind, settling in new areas and expanding ranges, and particularly, not lingering around their birthplace and competing with the parent stock. However, most individuals simply end up as food for other creatures that are higher on the food chain.
Not surprising, there are copepods, the “cattle of the sea” grazing on smaller organisms.
(Images on the Ron Brown by Dave Grant)
Calanus finmarchicus is sometimes called the most abundant animal in the world and is found throughout the oceans, sustaining many types of marinelife; even right whales and basking sharks off the coast of New England.
Other sea soup and children of the sea that author David Bulloch likes to call them, drift by me and swim circuits trapped by surface tension in the water drop under the microscope.
Radiolaria are single cell Protozoa that not only ensnare food with mucous, but harbor mutualistic algae
among their spines. (100 x’s)
More live pelagic snails. (Pteropod means winged foot.)
An empty shell with copepod sheltered inside. Other skeletons filled with Paramecia, and a mixed sample of shells
and dust particles. (Images on the Ron Brown by Dave Grant)
Now that is calm, everyone seems to have their sea legs and are comfortable talking about their bouts of mal de mer.
Here is the worst story about sea sickness I have come across:
From Dave Grant’s collection of sea stories: The world’s worst tale of seasickness. As told by Ulysses S. Grant in his Memoirs
One amusing circumstance occurred while we were lying at anchor in Panama Bay. In the regiment there was a Lieutenant Slaughter who was very liable to seasickness. It almost made him sick to see the wave of a table-cloth when the servants were spreading it. Soon after his graduation [from West Point] Slaughter was ordered to California and took passage by a sailing vessel going around Cape Horn. The vessel was seven months making the voyage, and Slaughter was sick every moment of the time, never more so than while lying at anchor after reaching his place of destination. On landing in California he found orders that had come by way of the Isthmus [Panama], notifying him of a mistake in his assignment; he should have been ordered to the northern lakes. He started back by the Isthmus route and was sick all the way. But when he arrived back East he was again ordered to California, this time definitely, and at this date was making his third trip. He was sick as ever, and had been so for more than a month while lying at anchor in the bay. I remember him well, seated with his elbows on the table in front of him, his chin between his hands, and looking the picture of despair. At last he broke out, “I wish I had taken my father’s advice; he wanted me to go into the navy; if I had done so, I should not have had to go to sea so much.”
Poor Slaughter! It was his last sea voyage. He was killed by Indians in Oregon.
NOAA Teacher at Sea Dave Grant Aboard NOAA Ship Ronald H. Brown February 15 – March 5, 2012
Mission: Western Boundary Time Series Geographical Area: Sub-Tropical Atlantic, off the Coast of the Bahamas Date: February 17, 2012
Weather Data from the Bridge
Position: Windspeed: 15 knots
Wind Direction: South/Southeast
Air Temperature: 23.9 deg C/75 deg F
Water Temperature: 24.5 deg C/76 deg F
Atm Pressure: 1016.23 mb
Water Depth: 4625 meters/15,174 feet
Cloud Cover: less than 20%
Cloud Type: Cumulus
Science/Technology Log
Sailors used to describe their trips as short-haul or coastal, or “long seas” which also was described as going “Blue Water”
We are off to a great start after passing the harbor lighthouse and breakwater, and the seas are calm and winds gentle. The Low Country and barrier islands of South Carolina disappear quickly over the horizon, and the most striking change for me is the color of the water. As we have transited from the sediment rich waters upriver, to the estuary, and out to the ocean, its color has gone from grayish, to green to blue.
Bay/Estuary water in Charleston
Gulf Stream water
As a rapid indicator of what’s going on within it biologically, oceanographers use the color of the water. To quantify their observations for other scientist to compare results, a white secchi disc is lowered just below the surface and the observer compares the ocean’s color with tinted water in a series of small vials – the Forel-Ule Scale. (Francois Forel was an oceanographer and his end of the scale is the bluest; and Willi Ule was a limnologist and his end of the scale is darker, reflecting the fresh waters he studied.) The 21 colors run the gambit of colors found in natural waters and modified by the plankton community and range from brownish-to-green-to-blue. This gives you a quick measure of productivity of the waters and the types of phytoplankton predominating. For example: Diatom blooms are brownish and Dinoflagellate blooms form the notorious red tides. Clear, less productive waters look blue, and we are sailing into waters that are a deeper blue with every league we sail.
I lack a secchi disk and we can’t stop the ship to lower one anyway, so I am using instead a scupper on the side as a photographic frame to document this well-studied and interesting phenomenon.
“Being on a boat that’s moving through the water, it’s so clear. Everything falls into place in terms of what’s important, and what’s not.”
(James Taylor)
Before departing on the trip I came across Richard Pough’s bird map of the Atlantic. On it he divides the ocean into 10-degree quadrants and indicates the average water temperature and number of birds he sighted daily. The good news is we are heading southeast into warmer waters. The bad news is, he does not indicate a very productive hunting ground for bird watching. For example, Cape Hatteras, NC, where the Gulf Stream skirts North Carolina, shows 40 birds. Off the highly productive sub-polar regions like Iceland where there are great breeding colonies of seabirds like gannets, he indicates scores of birds. Regardless, I am hopeful we will find some true seabirds to photograph on our voyage; and perhaps have some migrating songbirds drop in for a rest.
Gulf Stream sunset
Today, as our colleague Wes Struble discusses on his blog, we retrieved our first samples with the CTD rosette. Water is retrieved from predetermined levels between the surface and 4,500 meters sealed in bottles for salinity and dissolved oxygen analysis. These two physical features, along with temperature, are the benchmarks physical oceanographers rely upon to track the ocean circulation.
For an understanding of this process and an overview of the project, I met with Molly Baringer in her office – a large bench that the ship’s carpenter built on deck. It seats three and is similar to a lifeguard stand, so it can give a view of the water and fit over the [dis]array of equipment constantly being shifted around the fantail by various scientists and deck hands. With the calm seas and sunny weather, it is the perfect spot on the ship to sit with a laptop to outline daily assignments for all of us, review the mass of data streaming in, and relax to watch the sunset.
“When I am playful, I use the meridians of longitude and parallels of latitude for a seine,
and drag the Atlantic Ocean for whales!”
Mark Twain
Scientists and crew prepare to retrieve a mooring before the next big wave!
Chief scientist Dr. Baringer is a physical oceanographer and so is interested less in the creatures moving around in the ocean and more about the water currents that are moving them around, and particularly the vast amount of heat that is transferred from the Equator to the Polar Regions by “rivers in the sea” like the Gulf Stream.
Currents and storms in our atmosphere produce our daily weather patterns, which of course change seasonally too. Ocean currents work on a much longer time scale and the text book example of the turnover time of warm water moving Pole-ward, cooling and returning to the Tropics as “centuries.” This timeframe infers that dramatic fluctuations in climate do not occur.
However, by analyzing ice cores from Greenland, scientists recently have detected evidence of abrupt changes in climate – particularly a significant cooling event 8,200 years ago – that could be associated with vacillations in the Gulf Stream. Although lacking a blackboard at her impromptu lecture hall on deck, a patient Dr. Baringer was artful in walking me through a semester of climatology and modeling to highlight the implications of an oscillating Gulf Stream and its deepwater return waters – the Deep Western Boundary Current.
Surface water is driven from the southern latitudes towards the Poles along the western side of the Atlantic, constantly deflected in a clockwise pattern by the Earth’s rotation. Bathing Iceland with warm and saltier water and keeping it unusually mild for its sub-polar latitude, the Gulf Stream divides here with some water flowing into the Arctic Sea and the rest swirling down the Eastern Atlantic moderating the climate in Great Britain, France and Portugal. (This explains the presence of a rugged little palm tree that I once saw growing in a Scottish garden.)
Perturbations in the northward flow of heat by meanderings of the Gulf Stream or the smothering of it of it by lighter fresh waters from melting ice in Greenland and Canada appears play a significant role in occasionally upsetting Europe’s relatively mild and stable climate – which is bad enough. What is more alarming is new evidence that these changes don’t necessarily occur gradually over centuries as once assumed, but can take place rapidly, perhaps over decades.
There is more bad news. The surface of the sea is dynamic and even without wind and waves, there are gentle hills and valleys between areas. I remember my surprise when our physical oceanography teacher, Richard Hires, pointed out that because of warmer water and displacement by the Earth’s rotation, Gulf Stream waters are about a meter higher than the surrounding ocean…that to sail East into it from New Jersey, we are actually going uphill. If these giant boundary currents are suppressed in their movements, it will exasperate an ongoing coastal problem as those hills and valleys of water flatten, resulting in rising sea levels and erosion along northern coastlines.
This explains why we are “line sailing” at 26.5 North, sampling water and monitoring sensors arrayed on the parallel of latitude between Africa and the Bahamas. To measure change, it is necessary to have baseline data, and the stretch of the Atlantic is the best place to collect it.
Snap shots of the water column are taken using the CTD apparatus as we sail an East-West transect, but at $30-50,000. Per day for vessel time, this is not practical or affordable. Here is where moorings, data recorders and long-life Lithium batteries come into play. By anchoring a line of sensors in strategic locations and at critical depths to take hourly readings, year-long data sets can be recorded and retrieved periodically. Not only does this save time and money, it is the only way to generate the ocean of data for researchers to analyze and create a model of what is happening over such a vast region – and what may occur in the future.
For more specific details, check out the project overview.
Deep Western Boundary Current Transport Time Series to study:
-the dynamics and variability of ocean currents;
-the redistribution of heat, salt and momentum through the oceans;
-the interactions between oceans, climate, and coastal environments; and
-the influence of climate changes and of the ocean on extreme weather events.
Information at: http://www.aoml.noaa.gov/phod/wbts/ies/index.php
We hear that “The package is on deck” and it is time to collect water samples from the 24 different depths the Niskin bottles were fired (Remotely closed). As any aquarist will assure you, as soon as seawater is contained it begins to change, so we always start with the bottom water and work around to the top water since dissolved oxygen levels can drop with rising temperatures and biological activity from planktonic creatures trapped along with the water samples.
Although as oceanography students we read that most ocean water is quite cold (~3.5C) because only the top 100 meters soaks up the warmth from sunlight, it is still an awakening for me to fill the sample bottles with even colder bottom water. After a half hour of rinsing and filling bottles, my hands are reminded of the times I worked in an ice cream parlor restocking containers from the freezer and filling soft-serve cones. It is a delight to get to the last several bottles of warm (25C) surface water.
Once the DO and salinity bottles are filled, they are removed to the chemistry lab and the Niskins are all mine. By holding a small plankton net under them as they drain excess water, I try my luck at catching whatever has almost settled to the bottom. There is an extra bonus too. A patch of floating Sargassum weed that tangled in the rosette was retrieved by the technician and set aside for me to inspect.
Windrows of Sargassum weed drift past the Ron Brown
Here is what I found under the microscope so far:
From depth:
The bottom water is absolutely clear with no obvious life forms swimming around. However a magnification of 50x’s and the extra zoom of my handy digital camera set-up reveals a number of things of interest I am sorting into AB&C’s: Abiotic: Specks of clear mineral crystals. Are these minute sediments washed from the mainland or nearby Caribbean islands? Or is it possible they are quartz grains carried from much greater distances, like the Saharan dust that satellite images have proven are swept up by desert winds and carried all the way across the Atlantic?
Biotic: Although I can not find anything living, the silica dioxide skeletons (frustules) of at least two species of diatoms are present. These fragile fragments of glass accumulate in deep sediments below highly productive zones in the sea and different species are useful to paleontologists for determining the age of those deposits. On land, fossil diatom deposits are mined for diatomaceous earth – used as an abrasive and cleaner, pool filter material, and even in nanotechnologyresearch applications. There is other detrital material in the samples, but nothing identifiable.
Celestial(?): One tiny round particle caught my attention under the microscope. It looks like the images I’ve seen of microtektites – glassy and metallic meteor particles that have been molded by the heat of entry into the atmosphere. The Draxler brothers, two science students in Massachusetts, collect them and I hope they will confirm my identification when I see them again.
Dust particle (Right) and foraminifera (Center)
From the surface:
The warm, sunlit surface water here is covered with Sargassum weed, a curious algae that sustains an entire ecosystem in the waters mariners named the Sargasso Sea. On board the Brown it is simply called “weed” in part because it can be a minor nuisance when entangled with equipment. The Sargassum’s air bladders that support it at the surface reminded Portuguese sailors of their sargazagrapes and they named the gulfweed after them.
Can you spot the two Sargassum shrimp next to the air bladder?
Floating Sargassum weed harbors a great variety of other creatures including baby sea turtles, crustaceans and especially bryozoan colonies. The film of life encrusting the weed is sometimes called aufwuchs by scientists and is a combined garden and zoo.
A quick rinse in a plastic bag revealed two species of bryozoan and numerous tiny crustaceans. The Phylum Bryozoa is the “moss animals” a puzzling colonial creature to early biologists. Bryozoans are an ancient group with a long fossil record and are used by paleontologists as an “index” species to date sediments.
Byozoan colony
To my delight there were also some foraminifera in the samples. “Forams” as they are called by researchers, are single celled protozoa with calcium carbonate skeletons. They are abundant and widespread in the sea; having had 330 million years to adjust to different habitats – drifting on the surface in the plankton community and on benthic habitats on the bottom.
It is not necessary for you to go to sea with a microscope to find them. I have seen their skeletons imbedded in the exterior walls of government buildings in Washington, DC; and our own lab building at Sandy Hook, NJ has window sills cut from Indiana limestone – formed at the bottom of the warm Mesozoic seas that once covered the Midwest. In the stone, a magnifying glass reveals pin-head sized forams cemented among a sea of Bryozoan fragments. Some living forams from tropical lagoons are large enough to be seen without a magnifier, and are among the largest single-celled creatures on the planet. With a drop of acid (The acid test!) our Geology students confirm that our window sills are indeed made of limestone as the drops fizzing reaction releases carbon dioxide sequestered when the animal shell formed.
Living foraminifera eat algae, bacteria and detritus and are fed upon by fishes, crustaceans and mollusks. Dead forams make contributions to us by carrying the carbon in their skeletons to the bottom where it is sequestered for long geological periods.
Geologists also use different species of forams as “index” species to fix the date of strata in sediment cores and rocks. The appearance and demise of their different fossil assemblages leave a systematic record of stability and change in the environment; and paleoclimatologists use the ratios of Carbon and Oxygen isotopes in their skeletons document past temperature ranges.
Our first plankton samples extracted from the deepest samples retrieved from the Niskin bottles at 4,000 meters (2.5C) did not produce any forams. This may be because in deep, cold water, calcium carbonate is more soluble and the skeletons dissolve. Presumably why we identified only the glassy tests of diatoms.
Foraminifera shell at 100x’s
Tiny Paramecia swarm over the detritus in my slide and taking a closer look at that and the growth associated with the weed I am reminded of Jonathon Swifts jingle:
Big fleas have little fleas Upon their backs to bite ’em And little fleas have lesser fleas And so, ad infinitum
Sunset over the Sargassum Sea
The Chief Scientist:
A day in the life of our chief scientist involves: checking with her staff to evaluate the previous day’s collections, consulting with visiting scientists on their needs and any problems that might arise, checking with the deck hands and technicians about equipment needs and repairs, advising the ship’s officers of any issues, and making certain we are on course and schedule for the next station.
And then rest? Hardly!
Even when off duty there are inquiries to field from staff, scientists and crew; equipment repairs to be made; and software that needs to be tweaked to keep the data flowing.
How does one prepare for a career like this? Physically: the capacity to function on little sleep so you can work 12-hour shifts and be on-call the other twelve. (And there is little escape at mealtimes either, where the conversation never stays far from the progress of the cruise.)Mentally: the capability to multi-task with a variety of very different chores. Emotionally: the flexibility to accommodate people with many different personalities and needs, while staying focused on your own work.
Also, excellent organizational skills, since months of planning and preparation are crucial.
And perhaps most importantly, a sense of humor!
“Lock-and-Load!
Midnight shift.
Chief Scientist Dr. Molly Baringer prepares to fire the XBT
off the stern for an 800 meter profile of temperature and pressure.
NOAA Teacher at Sea Elizabeth Bullock Aboard R/V Walton Smith December 11-15, 2011
Introduction
Hello! My name is Elizabeth (Liz) Bullock and I work for the NOAA Teacher at Sea Program (TAS). Before I worked at NOAA (the National Oceanic and Atmospheric Administration) I was in graduate school at Clark University in Worcester, MA studying Environmental Science and Policy. As my final project, I created an environmental curriculum for the Global Youth Leadership Institute (GYLI). Through this experience, I realized how much I love both science and educating others about the importance of the natural world.
What will we be studying? The scientists on this survey are very interested in knowing about the strength and health of the ecosystem. They can judge how strong it is by looking at various indicators such as water clarity, salinity, and temperature. They can also record information about the phytoplankton and zooplankton that live in the water.
Question for students: Why do you think it is important to learn about the phytoplankton and zooplankton? What can they tell us about the ecosystem? Please leave a reply with your answers below by clicking on “Comments.”
Here is a map of the route the R/V Walton Smith will be taking.
The R/V Walton Smith will be leaving Miami, FL and traveling around the Florida Keys into the Gulf of Mexico.
I am so excited and I hope you will follow along with me on this journey of a lifetime!
Leg 1 has concluded. Oscar Dyson is currently at port in Dutch Harbor. Please use link (NOAA Ship locator) to follow ship in future research cruises and current location/conditions.
Science and Technology Log
I am back home and my expedition aboard the Oscar Dyson has come to a conclusion. My travels home had me leaving Dutch Harbor at 7:30 PM and arriving into Newark, NJ the following day at 2:30 pm EST, an incredibly long, red-eye flight back home. Although my involvement aboard the ship has come and gone, the ship is currently in port at Dutch Harbor taking on more fuel and supplies and readying to do a “turnaround trip”. For Leg II they will be heading back out into the Bering Sea to obtain further data. The following is a map that depicts the stations for Leg 1 and 2. For Leg 1, all of the green stations (40#) represents the areas where we conducted our research. For Leg II, they will be focusing on the black circle stations. When all of this field work is complete, and the numbers are “crunched” they can be extrapolated out to get a better idea of the overall health of the Bering Sea ecosystem as detailed in prior blogs.
BASIS 2011 Station Grid
So, before I left Alaska, I was discussing a bloom and readying the blog platform for a discussion of zooplankton and other higher-ordered interactions of the Bering. Ok, so moving on…the next feeding level in the marine world would be the primary consumers….the zooplankton. Zooplankton, although a very simplified explanation, are essentially animals that drift (planktonic) while consuming phytoplankton (for the most part). These zooplankton in turn, are a resource for consumers on higher trophic levels such as the Pacific Cod, salmon, and Walleye Pollock (which are a primary focus on this survey). Zooplankton are typically small and in order to obtain samples from the sea, we have been utilizing specialized nets (information and pictures to follow) to extract, analyze and collect them for further investigations back at the lab.
The following picture is a good visual to represent this flow of energy that we have been discussing since the first Blog Entry. An important observation is that the sun is the “engine” that initiates all of these interactions. The exchange of carbon dioxide compliments of Photosynthesis and respiration, the abundance of phytoplankton in the photic zone (see last blog entry), which are food for the zooplankton, which in turn, become food for higher-order carnivores.
Marine Food Chain
One of the more important zooplankton species out in the Bering are the euphasiids. These are small invertebrates found in all of worlds oceans. The common name is Krill. These species are considered a huge part of the trophic level connection, feeding on the phytoplankton and converting this energy into a form suitable for the larger animals. In the last blog, I put in some pictures of euphasiids that we caught. These euphasiids have a very high lipid content (fat) and in turn, are what is responsible for getting salmon their richness in oily flesh, the Omega Fatty acids, and there natural, pink-fleshed color. I have read before about the differences between farm-raised vs. wild salmon from a nutritional standpoint. Farm-raised salmon often lack the abundant Omega oils that are found in the wild species. Also, it is true that in order for the farm-raised salmon to get their pinkish color to the flesh, they are fed a nutritional supplement to give the color….essentially, like adding a food dye. So, in class this year, we will have to be very careful when analyzing the pros and cons of aquaculture/fish-farming.
Personal Log
Although my official involvement with the Oscar Dyson has come to an end, I will take with me the experiences and knowledge for a lifetime. It was everything I was hoping it would be and then so much more. These blogs, the pictures, the video…… all do the expedition no justice. However, I have pledged to make every effort possible to spread the word about NOAA and its mission and this is exactly what I will do. I have several more decades of career in front of me and I know that between now and that date, I will use this recent expedition countless times and will hopefully convince the general public about the overall importance of government agencies like NOAA and how common resources must be valued and protected to ensure the health of all of Earth’s inhabitants.
There are so many people who I would like to thank for providing and delivering such an extraordinary experience. All of the crew aboard the Oscar Dyson, from the engineers, to the chef, and captain……Thank You. Your professionalism and ability were truly inspiring.
To the Scientists, You were really the “teachers at sea”. May you always continue your motivated path to revealing the beautiful secrets this planet has to offer. Also, my hope that it continues to be done in a fashion that I saw while during my time on the water…..In a professional, unbiased, non-political fashion. You have reassured my passion for the sciences and have given me fuel to disprove any “non-believers” who claim that the sciences have become corrupted. In the end, you have shown me the most universal and balanced approach at reaching the truth.
Weather Data from the Bridge
Latitude: 56.95N
Longitude: 162.93 W
Wind Speed: 10 Knots
Surface Water Temperature: 10.5 C
Air Temperature: 55F
Relative Humidity: 97%
Science and Technology Log:
Well, at this time tomorrow, the Oscar Dyson will be tied up in port at Dutch Harbor. This is our end destination for Leg I of the BASIS survey. I will write-up a summary/conclusion either at that time or shortly after getting back into town. For now, I will fill you in on some material that I promised. As noted in earlier blogs…I have been intentionally writing in a trophic bottom up approach. That is, I started my first blog entries with descriptions of the primary producers, the Phytoplankton. I covered this extensively and correlated it to the oceanographic work that has been going on aboard this ship. It seemed logical to work from the base of the food chain and work my way up the trophic levels to the more complex consumers.
However, before I close the chapter on Phytoplankton take a look at the picture I took below. When I stepped outside and saw this, I thought I had been transported to the Caribbean. Clear skies, calm seas, tropical blue waters are not typical descriptions for the Bering Sea. If you look closely enough, you can even see the shadow of the clouds on the surface of the sea. Science is the field of making observations, forming hypothesis, designing and conducting experiments and drawing conclusions about the natural world we live in. So…what would you make of this observation? What has caused this temporary “mirage” of tropics? Clearly something is going on here.
Coccolithophores 08-28-11
Well, although not 100% certain, the most likely explanation is what would be called a Coccolithophore bloom. These are single-celled algae which are characterised by special calcium carbonate plates as seen in photo below under magnification.
Coccolithophore
Under certain conditions, (some speculate that wind pattern changes fail to mix the water column favoring cocolithophore blooms as opposed to other plankton) coccolithophores can create large blooms turning the water brilliant shades of blue pending on the species of coccolithophore blooming at the time. Ed (Chief Scientist) was telling me of a major bloom that had occurred back in the late 90’s. I researched it a bit and the following picture is of this bloom in the same general vicinity where we are now. Amazing to think of how microscopic plants can influence a region on the scale of an entire sea and be seen from space. *Note: this is not a false colored Image
Coccolithophore Bloom 98 Bering Sea
There is also some speculation that these types of blooms may be linked to sub-average runs of salmon (and even impact seabirds negatively in the area). Some hypothesize that this may be due to the idea that salmon prey heavily upon euphausiids (see picture I took below on 08-28-11 and the one centered beneath for a closer look taken from NOAA) and the euphausiids have difficulty subsiding on the extremely small coccolithophores. Remember what I was saying about visualizing the flow of energy as a pyramid and the effects of taking out a few or many blocks that make up the base of the food chain.
euphausiids 08-28-11
Euphasiid
Ok, to make this easier for the reader, I am going to stop this blog here and start a new one dedicated to the zooplankton…..I got a little sidetracked with the whole coccolithophore bloom event…….
Personal Log
Earlier this morning we were greeted with some higher winds and consequently some larger seas. As my friend back East says conditions got “Sporty.” Here is a picture from where we launch the CTD. Winds were out of the SW gusting to 30 knots and seas were in the 10′ range with some larger swells thrown into the mix to keep things interesting.
NOAA TEACHER AT SEA CATHRINE PRENOT FOX ONBOARD NOAA SHIP OSCAR DYSON JULY 24 – AUGUST 14, 2011
Mission: Walleye Pollock Survey
Location: Kodiak, Alaska
Date: August 11, 2011
Weather Data from the Bridge
Latitude: 57deg 22.630N, Longitude: 152.02° W
Air Temperature: 13.6° C
Water temperature: 9.0° C
Wind Speed/Direction: 12kn/240°
Barometric Pressure: 1020.1
Partly cloudy (5%) and sun
Science Log:
Stern of the Oscar Dyson
Somewhere back in my family history there must have been a fishmonger, because I’ve been channeling something or someone. The entire process of watching the acoustic footprint of the ocean under the ship, deciding where to physically sample (trawl) populations, and then seeing and processing the fish that live 100 meters or more below us? Fascinating. Add to this camera drops to get snapshots of the ocean floor (more amazing footage this morning), and interesting ‘Methot’ plankton tows to sample what is available for the fish to eat and give a more accurate and complete picture? How many adjectives can I use?
Before we dive too far into the depths, let me explain/refresh what plankton are. Plankton are any drifting organisms that inhabit the water columns of bodies of water. In fact, their name derives from the Greek for “wanderer,” and it would be helpful if you thought of them as drifters in the current…from deep in the ocean to up on the surface. They are generally broken down into plant-like-photosynthesizing plankton (phytoplankton) and animal-like plankton (zooplankton).
Phytoplankton are “photosynthesizing microscopic organisms that inhabit the upper sunlit layer of almost alloceans and bodies of water” (wikipedia). If you have taken biology or forensics with me, I have described some of them ad nauseam: diatoms? Those organisms that are in every body of water on the planet? Ah, yes. I can see it all coming back to you.
Zooplankton encompass a diverse range of macro and microscopic animals. They generally eat the phytoplankton or one another. Examples include krill, copepods, jellyfish, and amphipods.
In the great food web of life, other organisms eat the zooplankton. Among them was a pod of 50+ Humpback whales in the Barnabas Trough off of Kodiak Island. They were exciting enough that I went from being sound asleep to dressed and on the bridge in less than five minutes. Issue 12, Humpback Whales: Better than any alarm clock I have ever known delves into these organisms (Cartoon citations 1, 2, 3 and 4).
Our chief survey technician, Kathy Hough, took a lot of photos the following day as we traveled from Barnabas Trough to Alitak Bay. The three photos that follow and descriptions are courtesy of Kathy.
Adventures in a Blue World, Issue 12
Whale tail: Individual humpback whales can be identified by the black/white pattern on the ventral side of the fluke (tail). The pattern is like a human’s fingerprint, unique to one animal.
There is evidence of three whales in the photo above: the closest whale’s rostrum (blow hole) is visible. The second whale is diving and you can see the peduncle (the stocky part of the tail before the fluke). The glassy area in the back of the photo is evidence of a recent dive and is called a “footprint.”
This Humpback was last seen in this area in 2004, and has not been seen since. The white marks on its fluke are from a killer whale attack! Kathy emailled photos of the whales to observers, and they were able to identify individuals!
All hands on deck… 100+ Humpback Whales. Darin and Staci.
Our team of scientists sample plankton using a Methot net, which is fine mesh and captures macroscopic organisms. We sample plankton for the same reason that we physically trawl for fish: we need to make certain what we are “hearing” is what is down there, with a focus on the types and sizes of the plankton. Additionally, knowledge about what and where plankton populations are will help with modeling the entire ecosystem. If you know where the food lives, its abundance and composition, by extension you have a much greater understanding of the predators, both pollock and whale.
(If you get a chance, check out this video about how whales hunt with bubble nets; fascinating!)
Personal Log
Bowditch
I try to spend time on the bridge every morning before breakfast. I bring up a cup of tea and watch the horizon lighten until the sun pushes its way up above the lingering clouds. This morning, I saw the green flash for the first time. The green flash is not a superhero. It is not a myth. It is not a sailor’s fish tail. It is real. Furthermore, if you still don’t believe me, the green flash is in the “bible” of maritime studies, The American Practical Navigator (Bowditch, if you are on a first name basis). I was told by Ensign David Rodziewiczthat “if it is in Bowditch, it must be true.” So there.
The green flash appears on the horizon just after the sun sets or just before it rises. For one moment on that spot the sky looks as if someone broke a green glow stick and smeared a distant florescent mark. As fast as it was there, it is gone. The name is appropriate: green flash. It occurs because light is bent slightly as it passes through the atmosphere (refraction); this bending is greatest on the horizon. Since light is made up of different colors with different wavelengths, the bending causes the colors to be seen separately. Bowditch says it is like offset color printing (nice metaphor, eh?). The red end of the spectrum is first to rise. The blue end of the spectrum is scattered the most by the atmosphere, leaving behind the momentary and memorable second of green.
Evidently, to see the green flash is considered very good luck. I already feel very lucky. I am in one of the most beautiful places in the world, on a ship with interesting and intelligent people, driving around the Gulf of Alaska learning about science and occasionally checking out whales. If I can get luckier than this… well… wow.
Tomorrow is the last day of our cruise, but I have a few more cartoons up my sleeves, so keep checking back. In the meantime, thank you to the incredible staff of the Oscar Dyson, the scientists of MACE, my rockin’ cohort Staci, and the NOAA Teacher at Sea program.
Until our next adventure,
Cat
p.s. Whales have the worst morning breath I have ever smelled. I know it isn’t really their fault–imagine having 270-400 baleen sheets on either side of your mouth that you could get krill stuck in…
NOAA Teacher at Sea
Caitlin Thompson Aboard NOAA Ship Bell M. Shimada August 1 — 14, 2011
Mission: Pacific Hake Survey Geographical Area: Pacific Ocean off the Oregon and Washington Coasts Date: August 7, 2011
Weather Data from the Bridge Lat. 47 degrees, 00.8N
Long. 124 degrees, 29.8W
Present weather: Cldy 8/8
Visibility: 10 n.m.
Wind direction: 323
Wind speed: 08 kts
Sea wave height: 1 feet
Swell waves – direction: —
Swell waves – height: —
Sea water temperature: 13.7 degrees C
Sea level pressure: 1018.8 mb
Temperature – dry bulb: 15.8 degrees C
Temperature – wet bulb: 14.7 degrees C
Science and Technology Log
On the fish deck in my work clothes
The Shimada conducts research around the clock, with crew members working twelve-hour shifts. So far, I have worked with the acoustics team studying hake during the day, when the hake school together and are easy to fish. Last night I branched out, staying up with Steve Pierce, the oceanographer studying ocean currents, Jennifer Fisher, a faculty assistant at Oregon State University (OSU) who is studying zooplankton, and her intern, Angie Johnson, a graduate student at OSU. All the different research on this trip complements each other, and I learned more about the acoustic team’s work from the night people.
Gray's Harbor Transects
The map at right shows the transects we follow and the stations that the night team takes samples, which Steve chooses. Just like the acoustics team, he only chooses sites on the east-west transects. The night team usually works one transect ahead of the day team, and must have the ship back where they started by sun-up. Steve is mapping small currents because, he says, surprisingly little is known about ocean currents, even though they have a tremendous impact on ocean life.
He is especially interested in the polar undercurrent that brings nutrient-rich water from the south up along the west coast. A small current, it is nonetheless important because of the nutrients it carries, which come to the surface through upwelling. He uses an acoustic device, the Acoustic Doppler Current Profile (ADCP), to find the velocity of the water at various depths. The data from the ADCP is skewed by many factors, especially the velocity of the ship. Later, Steve will use trigonometry to calculate the true velocity. He also uses the Conductivity, Temperature, Depth (CTD) meter, lowered into the water at every station during the night. The CTD gives much more information than its name would suggest, including salinity, density, and oxygen. It is deployed with a high-speed camera and holds bottles to capture water samples. I was impressed by the amount of work – and math! – that Steve does in between cruises. When he has down time on this cruise, he told me, he is calculating work from two years ago.
Jennifer divides a sample in the Folsom plankton splitter
Jennifer and Angie are studying plankton, the organisms at the very bottom of the food web. Immediately, I recognized euphausiids, or krill, from the contents of hake stomachs. Actually I recognized their small black eyes, which always reminded me of poppy seeds when I saw them in hake stomachs. Jennifer is conducting this work through her group Northwest Fisheries Science Center, which, as she describes it, gives her a wonderful freedom to research different projects related to ocean conditions, especially salmon returns. In this project, they measuring phytoplankton, tiny, photosynthetic organisms, by measuring chlorophyll and nutrients. They are also looking at zooplankton, like euphausiids, salps, and crab larvae, which we examined other the microscope. To help the acoustics team refine their ability to use sonar to identify zooplankton, Jennifer and Angie record certain species. The acoustics team will match up the acoustics data that is continuously generated on this ship with the samples.
Angie takes water samples from the CTD.
Today, the second catch of the day was aborted because of whales too close to the ship. However, the NOAA’s Pacific Marine Environmental Laboratory (PMEL), had asked the Shimada to investigate its waveglider. A waveglider is type of robot called an autonomous underwater vehicle (AUV). Programmed to travel and record data, it does not need an operator. The PMEL folks were concerned, however, that its AUV might have a problem.The bridge set the course for the AUV, described as a yellow surfboard, and I headed up to the flying deck, the highest deck and an ideal spot for observation, to watch for it. Immediately we saw a humpback whale, just starboard of the ship, spout and roll through the water, its tail raised in the air. Soon the AUV appeared. We saw nothing wrong with it but communicated our observations, photographs, and video tape of it to PMEL. The PMEL’s system of wavegliders monitor carbon dioxide levels and use the kinetic energy of ocean waves to recharge the batteries. The acoustics team hopes to get their own waveglider next year to collect acoustic data in between transects. As I was peering over the edge of the boat, examining the surfboard-like robot below, I heard a loud splash. A bout ten Dall’s porpoises were playing around the bow of our boat, rippling in and out of the water. Dall’s porpoises are tremendously playful creatures, and will often play around ships. But our ship was barely moving, and the porpoises soon lost interest and swam away.
Wave Glider, seen from above
Personal Log
I’m getting a little of everything on this cruise. I would have stayed up two nights ago for the deploymentof the CTD and zooplankton samples, but the propeller developed a loud enough whamming sound to suspend all operations indefinitely. I woke up at 4:00 AM yesterday because the boat was swaying back and forth violently. (Violently by my standards, that is; more experienced mariners insist the swell is nothing.) Since our bunks go port to starboard, I could feel my weight sliding from hip to head to hip to head as I was rocked back and forth in bed. Meanwhile a discarded lightbulb in a metal shelf was rolling back and forth steadily – rattle-rattle-WACK! rattle-rattle-WACK! – until Shelby Herber, a student at Western University and my roommate, got up, found the culprit, and wrapped it in a shirt. When I woke again, it was eleven hours after the discovery of the problem with the prop and well past breakfast, and I started to get up until Shelby told me we were off transect, headed to shore because of the propeller.
Wave Glider from beneath the water, taken from PMEL's website
So we took our time getting up. But when I finally arrived in the acoustics lab, Rebecca was running up the hall, saying, “Caitlin, I was looking for you! There’s a great big shark outside, and we’re pulling up the ROV!” The ROV is the remotely controlled vehicle, a robot like the AUV, but one that requires an operator to make it move. Unfortunately, out on the fish deck, the ROV was being put away and the shark gone off on his fishy business. To console me, John had the videotaped footage from the ROV and the dorsal fin of the shark, and showed me both. The ROV revealed no damage and I was invited down to the winch room, where the bang-bang-bang coming from the propeller was unnerving.
Puzzled birds approach the ROV
Everyone was in an uproar trying to decide what to do, an uproar made all the more dramatic by the steady lurching and swaying of the ship, which throughout the day has sent most of the scientists to their room for at least a few hours and most of the deck hands to tell stories of unhappy tourists who couldn’t find their sea legs. Finally, the engine guys decided the warped propeller would not prevent us from getting to Port Angeles, and Rebecca decided it would not interfere with the acoustics, and we got back on transect.
ROV
I’m getting a little bit of everything on this cruise. I’ve seen sharks and marines mammals, calm seas and rockier seas, an impressively well-functioning ship and a number of technological problems. I’ve interviewed scientists, NOAA Corps officers who command the ship, and crew members who recount endless adventures at sea. I’m even signed up for the cribbage tournament, which I’m not entirely thrilled about since I don’t know how to play bridge. I’ve been impressed by how much time and information everyone seems to have for me. I am constantly thinking how I can bring this experience back to my students. Some ideas are to have a science and math career day, collect weather data like the data the bridge collects, dissect hake, and examine zooplankton under a microscope. Various people on board have volunteered to help with all my ideas.
NOAA Teacher at Sea Caitlin Fine Aboard University of Miami Ship R/V Walton Smith August 2 – 7, 2011
Mission: South Florida Bimonthly Regional Survey Geographical Area: South Florida Coast and Gulf of Mexico Date: August 6, 2011
Weather Data from the Bridge
Time: 4:24pm
Air Temperature: 31.6°C
Water Temperature: 32.6°C
Wind Direction: Southwest
Wind Speed: 4 knots
Seawave Height: calm
Visibility: good/unlimited
Clouds: partially cloudy (cumulous and cirrus clouds)
Barometer: 1013nb
Relative Humidity: 62%
Science and Technology Log
Many of you have written comments asking about the marine biology (animals and plants) that I have seen while on this cruise. Thank you for your posts – I love your questions! In today’s log, I will talk about the biology component of the research and about the animals that we have been finding and documenting.
We have another graduate student aboard, Lorin, who is collecting samples of sargassum (a type of seaweed).
Sargassum sample from Neuston net tow
There are two types of sargassum. One of those types usually floats at the top of the water and the other has root-like structures that help it attach to the bottom of the ocean.
Lorin is filtering a sample from the Neuston net in the web lab
We are using a net, called a Neuston net, to collect samples of sargassum that float. The Neuston net is towed alongside the ship at the surface at specific stations. This means that the ship drives in large circles for 30 minutes which can make for a rocky/dizzy ride – some of the chairs in the dry lab have wheels and they roll around the floor during the tow!
Towing the Neuston net along the side of the ship
Lorin and other researchers are interested in studying sargassum because it provides a rich habitat for zooplankton, small fish, crabs, worms, baby sea turtles, and marine birds. It is also a feeding ground for larger fish that many of you may have eaten, such as billfish, tuna, and mahi mahi.
Small crab that was living in the sargassum
The net not only collects sargassum, but also small fish, small crabs, jellyfish, other types of seaweed, and small plankton.
Small fish from the Neuston net
Plankton can be divided into two main categories: zooplankton and phytoplankton. As I said in my last post, phytoplankton are mostly very small plants or single-celled organisms that photosynthesize (they make their own food) and are the base of the food chain. Zooplankton are one level up on the food chain from phytoplankton and most of them eat phytoplankton. Zooplankton include larva (babies) of starfish, lobster, crabs, and fish.
Small zooplankton viewed through the dissecting microscope
We also use a Plankton net to collect samples of plankton. This has a smaller mesh, so it collects organisms that are so small they would fall through the Neuston net. Scientists are interested in studying the zooplankton that we catch in the Plankton net to understand what larger organisms might one day grow-up and live in the habitats we are surveying. They study the phytoplankton from the Plankton net to see what types of phytoplankton are present in the water and in what quantities.
Washing off the Plankton net
Today we collected so many diatoms (which are a type of phytoplankton) in the Neuston net that we could not lift it out of the water! This tells us that there are a lot of nutrients in the water (a diatom bloom) – maybe even harmful levels. I am bringing some samples of the diatoms and zooplankton home with me so we can look at them under the microscopes at school!
Evidence of a diatom (phytoplankton) bloom in the Gulf of Mexico
The marine biologists on this cruise are mainly interested in looking at phytoplankton and zooplankton, but we also have seen some larger animals. I have seen many flying fish skim across the surface of the water as the boat moves along. I have also seen seagulls, dolphins, sea turtles, cormorants (skinny black seabirds with long necks), and lots of small fish.
Small flying fish from the Newston net
Personal Log
Working as an oceanographer definitely demands flexibility. I have already mentioned that we chased the Mississippi River water during our second day. After collecting samples, we had to find blue water (open ocean water) to have a control to compare our samples against. We traveled south through the night until we were about 15 miles away from Cuba before finding blue water. All of this travel was in the opposite direction from our initial cruise plan, so we have had to extend our cruise by one day in order to visit all of the stations that we need to visit inside the Gulf of Mexico. This has meant waking-up the night shift so we can all change their airplane tickets and looking at maps to edit our cruise plan!
Changes to our cruise plan on the survey map
Many of you are writing comments about sharks – I have not seen any sharks and I will probably not see any. The chief scientist, Nelson, has worked on the ocean for about 33 years and he has sailed for more than 1,500 hours and he has only seen 3 sharks. They mostly live in the open ocean, not on the continental shelf where we are doing our survey. If there were a shark nearby, our ship is so big and loud that it would be scared away.
Playing with syringodium
Today I saw a group of about 4 dolphins off the side of the ship. They were pretty far away, so I could not take pictures. Their dorsal fins all seemed to exit the water at the same time – it was very beautiful. A member of the crew spotted a sea turtle off the bow (front) of the ship and I saw several different types of sea birds, especially seagulls.
Yesterday afternoon we passed through the Gulf of Mexico near the Everglades and there were storm clouds covering the coastline. The crew says that it rains a lot in this part of the Florida coast and that Florida receives more thunderstorms than any other state. It is strange to me because I always think of Florida as “the sunshine state.”
Grey sky and green water in the Gulf of Mexico
The color of the ocean has changed quite a lot during the cruise. The water is clear and light blue near Miami, clear and dark blue farther away from the coast in the Atlantic Ocean, cloudy and yellow-green in coastal Gulf of Mexico, and cloudy and turquoise in the Florida Bay. Scientists say that the cloudiness in coastal Gulf of Mexico is caused by chlorophyll and the cloudiness in the Florida Bay is caused by sediment.
It has been hot and sunny every day, but the wet lab (where we process the water samples and marine samples), the dry lab (where we work on our computers), the galley and the staterooms are nice and cool thanks to air conditioning! I can tell that I am getting used to being at sea because now when we are moving, I feel as though we are stopped. And when we do stop to take measurements, it feels strange.
Did you know?
NOAA does not own the R/V Walton Smith. It is University of Miami ship that costs NOAA from $12,000 to $15,000 a day to use!
Organisms seen today…
– Many sea birds (especially seagulls)
– 2 cormorants (an elegant black sea bird)
– 10-12 dolphins
– 1 sea turtle
– Lots of small fish
– Lots of zooplankton and phytoplankton (especially diatoms)
NOAA Teacher at Sea Caitlin Fine Aboard University of Miami Ship R/V Walton Smith August 2 – 6, 2011
Mission: South Florida Bimonthly Regional Survey Geographical Area: South Florida Coast and Gulf of Mexico Date: August 4, 2011
Weather Data from the Bridge Time: 10:32pm
Air Temperature: 30°C
Water Temperature: 30.8°C
Wind Direction: Southeast
Wind Speed: 7.7knots
Seawave Height: calm
Visibility: good/unlimited
Clouds: clear
Barometer: 1012 nb
Relative Humidity: 65%
Science and Technology Log
As I said yesterday, the oceanographic work on the boat basically falls into three categories: physical, chemical and biological. Today I will talk a bit more about the chemistry component of the work on the R/V Walton Smith. The information that the scientists are gathering from the ocean water is related to everything that we learn in science at Key – water, weather, ecosystems, habitats, the age of the water on Earth, erosion, pollution, etc.
First of all, we are using a CTD (a special oceanographic instrument) to measure salinity, temperature, light, chlorophyll, and depth of the water. The instrument on this boat is very large (it weights about 1,000 lbs!) so we use a hydraulic system to raise it, place it in the water, and lower it down into the water.
Lindsey takes a CO2 sample from the CTD
The CTD is surrounded by special niskin bottles that we can close at different depths in the water in order to get a pure sample of water from different specific depths. Nelson usually closes several bottles at the bottom of the ocean and at the surface and sometimes he closes others in the middle of the ocean if he is interested in getting specific information. For each layer, he closes at least 2 bottles in case one of them does not work properly. The Capitan lowers the CTD from a control booth on 01deck (the top deck of the boat), and two people wearing a hard hat and a life vest have to help guide the CTD into and out of the water. Safety first!
Once the CTD is back on the boat, the chemistry team (on the day shift, Lindsey and I are the chemistry team!) fills plastic bottles with water from each depth and takes them to the wet lab for processing. Throughout the entire process, it is very important to keep good records of the longitude and latitude, station #, depth of each sample, time, etc, and most importantly, which sample corresponds to which depth and station.
We are taking samples for 6 different types of analyses on this cruise: nutrient analysis, chlorophyll analysis, carbon analysis, microbiology analysis, water mass tracers analysis and CDOM analysis.
The nutrient analysis is to understand how much of each nutrient is in the water. This tells us about the availability of nutrients for phytoplankton. Phytoplankton need water, CO2, light and nutrients in order to live. The more nutrients there are in the water, the more phytoplankton can live in the water. This is important, because as I wrote yesterday – phytoplankton are the base of the food chain – they turn the sun’s energy into food.
Sampling dissolved inorganic carbon
That said, too many nutrients can cause a sudden rise in phytoplankton. If this occurs, two things can happen: one is called a harmful algal bloom. Too much phytoplankton (algae) can release toxins into the water, harming fish and shellfish, and sometimes humans who are swimming when this occurs. Another consequence is that this large amount of plankton die and fall to the seafloor where bacteria decompose the dead phytoplankton. Bacteria need oxygen to survive so they use up all of the available oxygen in the water. Lack of oxygen causes the fish and other animals to either die or move to a different area. The zone then becomes a “dead zone” that cannot support life. There is a very large dead zone at the mouth of the Mississippi River. So we want to find a good balance of nutrients – not too many and not too few.
The chlorophyll analysis serves a similar purpose. In the wet lab, we filter the phytoplankton onto a filter.
I am running a chlorophyll analysis of one of the water samples
Each phytoplankton has chloroplasts that contain chlorophyll. Do you remember from 4th grade science that plants use chlorophyll in order to undergo photosynthesis to make their own food? If scientists know the amount of chlorophyll in the ocean, they can estimate the amount of phytoplankton in the ocean.
Carbon can be found in the form of carbon dioxide (CO2) or in the cells of organisms. Do you remember from 2nd and 4th grade science that plants use CO2 in order to grow? Phytoplankton also need CO2 in order to grow. The carbon dioxide analysis is useful because it tells us the amount of CO2 in the ocean so we can understand if there is enough CO2 to support phytoplankton, algae and other plant life. The carbon analysis can tell us about the carbon cycle – the circulation of CO2 between the ocean and the air and this has an impact on climate change.
The microbiology analysis looks for DNA (the building-blocks of all living organisms – kind of like a recipe or a blueprint). All living things are created with different patterns or codes of DNA. This analysis tells us whose DNA is present in the ocean water – which specific types of fish, bacteria, zooplankton, etc.
The water mass tracers analysis (on this boat we are testing N15 – an isotope of Nitrogen, and also Tritium – a radioactive isotope of Hydrogen) helps scientists understand where the water here came from. These analyses will help us verify if the Mississippi River water is running through the Florida Coast right now. From a global viewpoint, this type of test is important because it helps us understand about the circulation of ocean water around the world. If the ocean water drastically changes its current “conveyor belt” circulation patterns, there could be real impact on the global climate. (Remember from 2nd and 3rd grade that the water cycle and oceans control the climate of Earth.) For example, Europe could become a lot colder and parts of the United States could become much hotter.
This is an image of the conveyor belt movement of ocean currents
The last type of analysis we prepared for was the CDOM (colored dissolved organic matter) analysis. This is important because like the water mass tracers, it tells us where this water came from. For example, did the water come from the Caribbean Sea, or did it come from freshwater rivers?
I am coming to understand that the main mission of this NOAA bimonthly survey cruise on the R/V Walton Smith is to monitor the waters of the Florida Coast and Florida Bay for changes in water chemistry. The Florida Bay has been receiving less fresh water runoff from the Everglades because many new housing developments have been built and fresh water is being sent along pipes to peoples’ houses. Because of this, the salinity of the Bay is getting higher and sea grass, fish, and other organisms are dying or leaving because they cannot live in such salty water. The Bay is very important for the marine ecosystem here because it provides a safe place for small fish and sea turtles to have babies and grow-up before heading out to the open ocean.
Personal Log
This cruise has provided me great opportunities to see real science in action. It really reinforces everything I tell my students about being a scientist: teamwork, flexibility, patience, listening and critical thinking skills are all very important. It is also important to always keep your lab space clean and organized. It is important to keep accurate records of everything that you do on the correct data sheet. It can be easy to get excited about a fish or algae discovery and forget to keep a record of it, but that is not practicing good science.
It is important to keep organized records
It is also important to stay safe – every time we are outside on the deck with the safety lines down, we must wear a life vest and if we are working with something that is overhead, we must wear a helmet.
I have been interviewing the scientists and crew aboard the ship and I cannot wait to return to Arlington and begin to edit the video clips. I really want to help my students understand the variety of science/engineering and technology jobs and skills that are related to marine science, oceanography, and ships. I have also been capturing videos of the ship and scientists in action so students can take a virtual fieldtrip on the R/V Walton Smith. I have been taking so many photos and videos, that the scientists and crew almost run away from me when they see me pick up my cameras!
Captain Shawn Lake mans the winch
The food continues to be wonderful, the sunsets spectacular, and my fellow shipmates entertaining. Tomorrow I hope to see dolphins swimming alongside the ship at sunrise! I will keep you posted!!
Did you know?
The scientists and crew are working 12-hour shifts. I am lucky to have the “day shift” which is from 8am to 8pm. But some unlucky people are working the “night shift” from 8pm to 8am. They wake-up just as the sun is setting and go to sleep right when it rises again.
Animals seen today…
zooplankton under the dissecting microscope
– Many jellyfish
– Two small crabs
– Lots of plankton
A sampling of zooplankton
– Flying fish flying across the ocean at sunset
– A very small larval sportfish (some sort of bluerunner or jack fish)
Some moon jellyfish that we collected in the tow net
NOAA Teacher at Sea Caitlin Fine Onboard University of Miami Ship R/V Walton Smith August 2 – 6, 2011
Mission: South Florida Bimonthly Regional Survey Geographical Area: South Florida Coast and Gulf of Mexico Date: August 3, 2011
Weather Data from the Bridge
Time: 10:18pm
Air Temperature: 29.5°C
Water Temperature: 31.59°C
Wind Direction: North
Wind Speed: 3 knots
Seawave Height: calm
Visibility: good/unlimited
Clouds: Partially cloudy (cumulos and cirrus)
Barometer: 1011.0mb
Relative Humidity: 72%
Science and Technology Log
The oceanographic work on the boat can be divided into three categories: physical, chemical, and biological. In this log, I will explain a little bit about the part of the research related to the physics of light. Upcoming 5th graders – pay attention! We will be learning a lot about light in January/February and it all relates to this research project.
Brian and Maria are two PhD students who are working with the physical components. They are using several optical instruments: the SPECTRIX, the GER 1500, the Profiling Reflectance Radiometer (PRR), and the Profiling Ultraviolet Radiometer (PUV).
Brian and Maria take optic measurements with the SPECTRIX and GER 1500
The SPECTRIX is a type of spectroradiometer that measures the light coming out of the water in order to understand what is in the water. For example, we can measure the amount of green light that is reflected and red and blue light that is absorbed in order to get an idea about the amount of chlorophyll in the water. This is important because chlorophyll is the biggest part of phytoplankton and phytoplankton are tiny plant-like algae that form the base of the food chain on Earth.
Brian lowers PRR into the water
The PRR and the PUV measure light at different depths to also understand what is in the water and at what depth you will find each thing in the water. The light becomes less bright the further down you go in the water. Most of light is between 0-200 meters of depth. The light that hits the water also becomes less bright based upon what is in the water. For example, you might find that chlorophyll live at 10 meters below the surface. It is important to understand at what depth each thing is in the water because that tells you where the life is within the ocean. Most of the ocean is pitch-black because it is so deep that light cannot penetrate it. Anything that lives below the light level has to be able to either swim up to get food, or survive on “extras” that fall below to them.
Personal Log
These few days have been very fun and action-packed! I arrived on the ship on Sunday afternoon and helped Nelson and the crew get organized and set-up the stations for the cruise. Several other people had also arrived early – two graduate students who are studying the optics of the water as part of their PhD program, one college student and one observer from the Dominican Republic who are like me – trying to learn about what NOAA does and how scientists conduct experiments related to oceanography.
On Monday morning, we gathered for a team meeting to discuss the mission of the cruise, introduce ourselves, and get an updated report on the status of the Mississippi River water. It turns out that the water is going in a bit of a different direction than previously projected, so we will be changing the cruise path of the ship in order to try to intersect it and collect water samples.
I am helping lower the CTD into the water
Monday we all learned how to use the CTD (a machine that we use to collect samples of water from different depths of the ocean) and other stations at the first several stops. It was a bit confusing at the beginning because there is so much to learn and so many things to keep in mind in order to stay safe! We then ate lunch (delicious!) and had a long 4-hour ride to the next section of stops. When we arrived, it was low tide (only 2 ft. of water in some places) so we could not do the sampling that we wanted to do. We continued on to the next section of stops (another 3 hour ride away!), watched a safety presentation and ate another delicious meal. By this time, it was time for the night shift to start working and for the day shift to go to bed. Since I am in the day shift, I was able to sleep while the night shift worked all night long.
Today I woke up, took a shower in the very small shower and ate breakfast just as we arrived at another section of stops. I immediately started working with the CTD and on the water chemistry sampling. We drove through some sea grass and the optics team was excited to take optical measurements of the sea grass because it has a very similar optical profile to oil. The satellites from space see either oil or sea grass and report it as being the same thing. So scientists are working to better differentiate between the two so that we can tell sea grass from oil on the satellite images. The images that Maria and Brian took today are maybe some of the first images to be recorded! Everyone on the ship is very excited!
Several hours later, we came to a part of the open ocean within the Florida Current near Key West where we believe water from the Mississippi River has reached. Nelson and the scientific team believe this because the salinity (the amount of dissolved salt) of the surface water is much lower than it normally is at this time of year in these waters. Normally the salinity is about 36-36.5 PSUs in the first 20 meters and today we found it at 35.7 PSUs in the first 20 meters. This may not seem like a big difference, but it is.
The water from the Mississippi River is fresh water and the water in the Florida Keys is salt water. There is always a bit of fresh water mixing with the salt water, but usually it is not enough to really cause a change in the salinity. This time, there is enough fresh water entering the ocean to really change the salinity. This change can have an impact on the animals and other organisms that live in the Florida Keys.
Additionally, the water from the Mississippi River contains a lot of nutrients – for example, fertilizers that run off from farms and lawns into gutters and streams and rivers – and those nutrients also impact the sea life and the water in the area. Nelson says that this type of activity (fresh water from the Mississippi River entering the Florida Current) occurs so infrequently (only about ever 6 years), scientists are interested in documenting it so they can be prepared for any changes in the marine biology of the area.
For all of these reasons and more, we took a lot of extra samples at this station. And it took almost 2 hours to process them!
In the evening, we stopped outside of Key West and the director of this program for NOAA, Michelle Wood, took a small boat into the harbor because she cannot be with us for the entire cruise.
Sunset over Key West - a beautiful way to end the day
She asked me if I’d like to go along with the small boat to see Key West, since I have never been there before, and of course I agreed! I got some great pictures of the R/V Walton Smith from the water and we saw a great sunset on the way back to the ship after dropping her off with Jimmy Buffet blasting from the tourist boats on their own sunset cruises.
We will be in the Mississippi River plume for most of tonight. Everyone is very excited and things are pretty crazy with the CTD sampling because we are doing extra special tests while we are in the Mississippi River plume. We might not get much sleep tonight. I will explain in my next blog all about the chemistry sampling that we are doing with the CTD instrument and why it is so important.
Did you know?
On a ship, they call the kitchen the “galley,” the bathroom is the “head,” and the bedrooms are called “staterooms.”
One interesting thing about the ship is that it does not have regular toilets. The ship has a special marine toilet system that functions with a vacuum and very thin pipes. If one of the vacuums on one of the toilets is not closed, none of the toilets work!
Animals seen today…
Zooplankton that live in the sargassum (a type of seaweed that usually floats on the water) –baby crab, baby shrimp, and other zooplankton. The sargassum is a great habitat for baby crab, baby shrimp, and baby sea turtles.
NOAA Teacher at Sea
Becky Moylan
Onboard NOAA Ship Oscar Elton Sette July 1 — 14, 2011
Mission: IEA (Integrated Ecosystem Assessment)
Geographical Area: Kona Region of Hawaii
Captain: Kurt Dreflak
Science Director: Samuel G. Pooley, Ph.D.
Chief Scientist: Evan A. Howell
Date: July 13, 2011
Ship Data
Latitude
1940.29N
Longitude
15602.84W
Speed
5 knots
Course
228.2
Wind Speed
9.5 knots
Wind Dir.
180.30
Surf. Water Temp.
25.5C
Surf. Water Sal.
34.85
Air Temperature
24.8 C
Relative Humidity
76.00 %
Barometric Pres.
1013.73 mb
Water Depth
791.50 Meters
Science and Technology Log
Results of Research
Crustaceans
Chief Scientist guiding the CTD into the ocean
Beginning on July 1st, the NOAA Integrated Ecosystem Assessment project (IEA) in the Kona region has performed scientific Oceanographyoperations at eight stations. These stations form two transects (areas) with one being offshore and one being close to shore. As of July 5th, there have been 9 CTD (temperature, depth and salinity) readings, 7 mid-water trawls (fish catches), over 15 acoustics (sound waves) recordings, and 30 hours of marine mammal (dolphins and whales) observations.
The University of Hawaii Ocean Sea Glider has been recording its data also.The acoustics data matches the trawl data to tell us there was more mass (fish) in the close to shore area than the offshore area. And more mass in the northern area than the south. This is evidence that the acoustics system is accurate because what it showed on the computer matched what was actually caught in the net. The fish were separated by hand into categories: Myctophid fish and non-Myctophid fish, Crustaceans, and gelatinous (jelly-like) zooplankton.
Variety of Non-Myctophid Fish caught in the trawl
The CTD data also shows that there are changes as you go north and closer to shore. One of the CTD water sample tests being done tells us the amount of phytoplankton (plant) in different areas. Phytoplankton creates energy by making chlorophyll and this chlorophyll is the base of the food chain. It is measured by looking at its fluorescence level. Myctophids eat phytoplankton, therefore, counting the amount of myctophids helps create a picture of how the ecosystem is working.
The data showed us more Chlorophyll levels in the closer to shore northern areas . Phytoplankton creates energy using photosynthesis (Photo = light, synthesis = put together) and is the base of the food chain. Chlorophyll-a is an important pigment in photosynthesis and is common to all phytoplankton. If we can measure the amount of chlorophyll-a in the water we can understand how much phytoplankton is there. We measure chlorophyll-a by using fluorescence, which sends out light of one “color” to phytoplankton, which then send back light of a different color to our fluorometer (sensor used to measure fluorescence). Myctophids eat zooplankton, which in turn eat phytoplankton. Therefore, counting the amount of myctophids helps create a picture of how the ecosystem is working. The data showed us more chlorophyll-a levels in the closer to shore northern areas.
Bringing in the catch
The Sea Glider SG513 has transmitted data for 27 dives so far, and will continue to take samples until October when it will be picked up and returned to UH.
Overall the mammal observations spotted 3 Striped dolphins, 1 Bottlenose dolphin, and 3 Pigmy killer whales. Two biopsy “skin” samples were collected from the Bottlenose dolphins. A main part of their research, however, is done with photos. They have so far collected over 900 pictures.
Looking at all the results so far, we see that there is an area close to shore in the northern region of Kona that has a higher concentration of marine life. The question now is why?
We are now heading south to evaluate another region so that we can get a picture of the whole Eastern coastline.
Personal Log
In the driver's seat
Krill
And on deck the next morning we found all kinds of krill, a type of crustacean. Krill are an important part of the food chain that feed directly on phytoplankton. Larger marine animals feed on krill including whales. It was a fun process finding new types of fish and trying to identify them.Last night I found a beautiful orange and white trumpet fish. We also saw many transparent (see-through) fish with some having bright silver and gold sections. There were transparent crabs, all sizes of squid, and small clear eels. One fish I saw looked like it had a zipper along the bottom of it, so I called it a “zipperfish”. A live Pigmy shark was in the net, so they put it in a bucket of water for everyone to see. These types don’t ever get very big, less than a foot long.
I have really enjoyed living on this ship, and it will be sad to leave. Everyone treated me like I was part of the group. I have learned so much about NOAA and the ecosystem of the Kona coastline which will make my lessons more interesting this year. Maybe the students won’t be bored!
NOAA Teacher at Sea
Heather Haberman Onboard NOAA Ship Oregon II July 5 — 17, 2011
Mission: Groundfish Survey
Geographical Location: Northern Gulf of Mexico
Date: Saturday, July 09, 2011
Weather Data from NOAA Ship Tracker Air Temperature: 30.4 C (86.7 F)
Water Temperature: 29.6 C (85.3 F)
Relative Humidity: 72%
Wind Speed: 6.69 knots (7.7 mph)
Preface: Scroll down the page if you would like to read my blog in chronological order. If you have any questions leave them for me at the end of the post.
Science and Technology Log
Topic of the Day: Plankton, the most important organisms on the planet.
Say the word plankton to a class full of students and most of them will probably think of a small one-eyed cartoon character. In actuality plankton are some of the most important organisms on our planet. Why would I so confidently make such a bold statement? Because without plankton, we wouldn’t be here, nor would any other organism that requires oxygen for life’s processes.
Plankton are a vital part of the carbon and oxygen cycles. They are excellent indicators of water quality and are the base of the marine food web, providing a source of food and energy for most of the ocean’s ecosystem’s. Most plankton are categorized as either phytoplankton or zooplankton.
Question: Can you identify which group of plankton are the plants and which are the animals based on the prefix’s?
Simple marine food web. Image: NOAA
Phyto comes from a Greek word meaning “plant” while planktos means “to wander”. Phytoplankton are single-celled plants which are an essential component of the marine food web. Plants are producers meaning they use light energy from the sun, and nutrients from their surroundings, to photosynthesize and grow rather than having to eat like animals, which are consumers. Thus producers allow “new” energy to enter into an ecosystem which is passed on through a food chain.
Because phytoplankton photosynthesize, they also play an important role in regulating the amount of carbon dioxide in our atmosphere while providing oxygen for us to breathe. Scientists believe that the oceans currently absorb between 30%-50% of the carbon dioxide that enters into our atmosphere.
Did you know: It is estimated that marine plants, including phytoplankton, are responsible for 70-80% of the oxygen we have in our atmosphere. Land plants are only responsible for 20-30%.
Diatoms are one of the most common forms of phytoplankton. Photo: NOAA
Question: Since phytoplankton rely on sun and nutrients for their energy, where would you expect to find them in greater concentrations, near the coast or far out at sea?