Mission: Hydrographic Survey – Approaches to Houston
Geographic Area of Cruise: Gulf of Mexico
Date: July 15th, 2018
Weather Data from the Bridge
Latitude: 28° 49.4115’N
Longitude: 93° 37.4893’W
Visibility: 10+ Nautical Miles
Sky Condition: 4/8
Wind: Direction: 240°, Speed: 7 knots
Temperature:
Seawater: 31.7°C
Air: Dry bulb:31.5°C Wet bulb: 27.5°C
Science and Technology Log
NOAA Ship Thomas Jefferson is well underway in its mission of surveying the seafloor. The primary tool that the ship (as well as its 2 Hydrographic Survey Launches) is using to accomplish this task is sonar. Sonar was originally an acronym for SOund Navigation And Ranging. If you are familiar with echolocation – the system that some animals (such as bats and dolphins) use to navigate their surroundings – then you already have a basic understanding of how sonar works. The sonar transmits a short sound (called a ping) that will travel down, away from the ship, until it hits the seafloor. At this point, it will reflect off of the sea floor, and echo back up to the ship, where it is detected by the sonar’s receiver. The crew aboard are then able to calculate the depth of the water.
To make the necessary calculations, there are 3 variables at play: the time that it takes for the ping to travel; the distance that the ping travels; and the velocity, or the speed, at which the ping moves through the water. If we know two of those variables, it is easy to calculate the third.
When using sonar to determine the depth of the water, distance is the unknown variable – that’s what we’re ultimately trying to figure out. To do so, we need to know the other two variables. Time is an easy variable for the sonar to measure. The sonar has a transmitter, which generates the ping, and a receiver, which hears it. These two components communicate with one another to give us an accurate measure of time. The third variable, velocity, is a bit trickier.
In saltwater, sound travels approximately 1500 meters per second. However, that rate can vary slightly based on water conditions such as temperature and salinity (how salty the water is). In order for sonar to get as accurate a reading as possible, it needs to calculate the precise speed of sound for the particular water it is in at the moment. The sonar is able to do that by using a component called a sound velocity sensor, known colloquially as a singaround.
The sonar on the hull of one of the Hydrographic Survey Launches. The orange rectangles are the projector (or, the transmitter) and the receiver, and the component in the green circle is the singaround
A singaround looks like a bar with a nub on each end. One nub is a projector, and the other is a reflector. The projector broadcasts a ping that travels parallel to the hull of the ship, bounces off of the reflector, and returns to the projector. We use that information to calculate velocity. The calculation uses the same 3 variables as above (time, distance, and velocity), but this time, distance isn’t the unknown variable anymore – we know exactly how far the ping has traveled, because we know how far the projector and reflector are from one another. The singaround electronically measures how long it takes for the ping to travel, and since we now know two of the variables (distance and time) we can calculate the third (velocity) for our particular water conditions at the face of the sonar.
Sound travels roughly 4 times faster in water than it does in air (this is because water is denser than air). To ensure that the sonar gets an accurate reading, it is important that air bubbles don’t get in the way. The boat’s hull (bottom) has a triangular metal plate directly in front of the sonar, which routes air bubbles around to the side of the sonar.
The hull of one of the Hydrographic Survey Launches.
Personal Log
Each day, the ship’s CO (Commanding Officer) publishes a POD, or Plan Of the Day. This is full of important information – it tells us what the ship will be doing; if/when we will deploy the launch boats, and who will be on them; what time meals will be; and the expected weather conditions. Below is an example from Friday, July 13th.
NOAA Ship Thomas Jefferson Plan of the Day for Friday, July 13, 2018
On Friday, I had the opportunity to go out on one of the Hydrographic Survey Launches. Because of their smaller size, the launch boats are great for surveying difficult to maneuver areas. For instance, we spent most of the day surveying an area near an oil rig, and were able to get much closer than the Thomas Jefferson could.
Survey Tech Mike Hewlett collecting and analyzing survey data aboard a launch boatAn oil rig and a supply vessel
I’ve been very impressed by how multi-talented everyone on the ship seems to be. In addition to analyzing data, the ship’s survey techs can also be found handling lines as the survey boats are launched and recovered, and do a lot of troubleshooting of the hardware and software they’re using. The coxswains (people who drive small boats) double as engineers, fixing issues on the launch vessels when away from the ship. I’m surrounded by some very gifted people!
Coxswain Francine Grains and Survey Tech Brennan Walters fixing the air conditioner on one of the launch boats that had stopped working unexpectedly. They had it up and running in no time
Did you know?: As president, Thomas Jefferson ordered the first survey of the coastline of the United States. Because of this, NOAA Ship Thomas Jefferson is named for him.
Latest Highlight: While surveying, we spotted a water spout in the distance. A water spout is a tornado that forms over water. Luckily, we were a safe distance away. It was an amazing sight to see!
Mission: Hydrographic Survey- Approaches to Houston
Geographic Area of Cruise: Gulf of Mexico
Date: July 1, 2018
Weather Data from the Bridge
Latitude: 29° 10.1’ N
Longitude: 093° 54.5’ W
Visibility: 10+ NM
Sky Condition: 3/8
Wind: 16 kts
Temperature:
Sea Water: 29.4° C
Air: 27° C
Science and Technology Log
At this point I have been able to understand more of the sonar technology taking place during the survey aboard the Thomas Jefferson. The ship uses two types of sonar: multibeam and side scan. Both work together transmitting and receiving sound pulses to and from the ocean floor. This provides a multispectral analysis.
Julia Wallace, a physical scientist, works at the sonar acquisition station. This requires a large amount of multitasking as she communicates with the bridge (ship steering deck), watches the safety cameras, and makes sure both sonar devices are working correctly.
Multibeam sonar is located underneath the hull of the ship. Multibeam is used to detect bathymetry (the depth of the ocean floor). Multibeam backscatter (reflected wave energy) gives a reading of the surface intensity. For example, a strong signal would mean a harder surface like rock or pipeline. With multibeam sonar, you can also adjust the sound wave frequency. For example, high frequency (primarily used during this survey in the Gulf of Mexico) is used for shallower waters allowing for higher resolution images. Images from multibeam have a color gradient to allow for clear vision of contours and depth differences. One way surveyors aboard the TJ may use backscatter images is to determine areas where bottom sampling might be applicable.
A NOAA ship using mulitbeam sonar. (Courtesy of NOAA)Bathymetry acquired using multibeam echosounder layered over a nautical chart. Blue and green wave lengths penetrate further in water, so the coloring corresponds to this observation. This poster is from a previous Thomas Jefferson hydrographic survey near Savannah, Georgia. (Prepared by CHST Allison Stone)3D bathymetry imagery from the Okeanos Explorer. (NOAA)A close-up view of multibeam data. The third window down shows multibeam backscatter.
The side scan sonar is used alongside multibeam to provide black and white scans of images. Like multibeam backscatter, side scan measures the intensity of the sound returning from the sea floor. For example, a side scan return with high intensity could indicate a difference in material like pipeline or a wreck. A low intensity value could mean that the side scan sonar waves have reached a muddy substrate. Julia used the analogy of a tennis ball being bounced against a wall of different materials. For example, the tennis ball hitting a concrete wall would bounce back with higher intensity than one being bounced against a soft wall. Side scan sonar is very effective at detecting features that protrude off the sea floor, and for shallow water surveys, typically can see farther and cover a greater area the sea floor than multibeam echosounders alone.
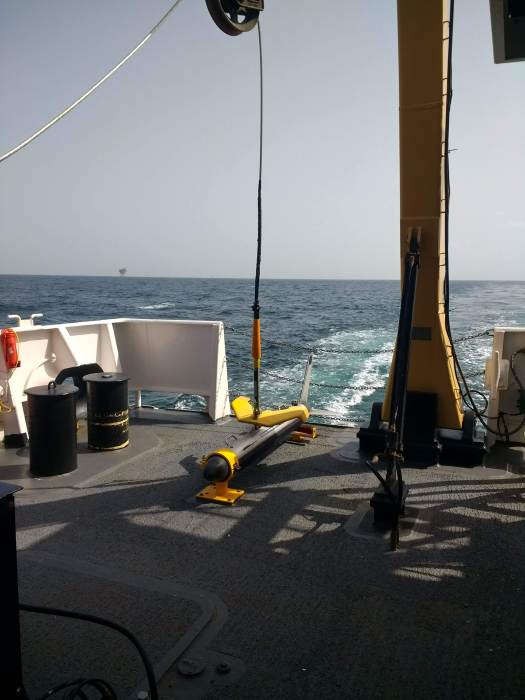
The side scan sonar sensor is located on a torpedo-shaped “towfish” and pulled behind the boat. When viewing side scan images, surveyors typically look for the acoustic shadow cast by a feature protruding off the sea floor. By measuring the length of the acoustic shadow, hydrographers can determine whether the feature requires additional investigation. For example, the outline of a shipwreck, bicycle, or pipeline. However, it can also detect mammals like dolphins or schools of fish.
Diagram of side scan sonar. (Courtesy of thunder bay 2001, Institute for Exploration, NOAA-OER)The Thomas Jefferson sidescan sonar on deck.In the early morning, the sidescan sonar picked up the image of an incorrectly charted shipwreck. Height is estimated using the “shadow” of the wreck.Sidescan sonar imagery layered on a nautical chart. It is important to remember that sidescan data does not account for depth, it is a measure of differences in sea floor substrate.Look closely and you can see arc lines in the sidescan imagery. Lt. Anthony Klemm explains that these arcs are from ships dragging anchor and stirring up the sea floor.
While this is happening, surveyors are also towing a MVP or Moving Vessel Profiler to capture information about the water column. This is important because multiple factors in the water column need to be corrected in order for accurate sonar calculations. For example, the speed of sound in salt water is roughly 1500 m/s but may change while the ship is traveling over different parts of the sea floor or passing through a thermocline (steep temperature gradient) or halocline (steep salinity gradient). The MVP is similar to the CTD used on the launch boat (see previous post), but the MVP allows the ship to continue moving at about 10 knots (average survey speed), while the CTD must be cast when the ship is stationary.
Information from the Moving Vessel Profiler. From left to right, the MVP tracks sound speed, temperature, and salinity in relation to depth.
For more information on multispectral analysis and sonar, see these resources:
One of my goals in the classroom is to teach students to be comfortable making and learning from mistakes. Making mistakes in math and science is common and welcome because they lead to great discussion and future change. Often, my sixth graders get discouraged or so caught up in failure that they become paralyzed in making further attempts. While aboard the Thomas Jefferson, I have witnessed several aspects not go according to plan. I think these experiences are important to share because they provide real-life examples of professionals coming together, learning from mistakes, and moving forward.
Around 4:00 am, the towfish side scan sonar became entangled with the MVP. This was a horrendous disaster. The crew spent about 16 hours contemplating the issue and collecting data using the multibeam only, which is less than ideal. One of XO LCDR McGovern’s many roles aboard the ship is to serve as the investigator. She reviewed tapes of the early morning, talked with the crew, and later held a debrief with all involved. When something like this happens, the ship must write a clear incident report to send to shore. There were many questions about why and how this happened as well how to best proceed. In the end, the towfish and MVP were untangled with no damage present to the sensor. Within the same day, both were cast out and back in use.
I find this to be an astounding example of perseverance and teamwork. Despite being disappointed and upset that a critical tool for collecting accurate data was in dire shape, the crew came up with a plan of action and executed. Part of the engineering and scientific processes include evaluation and redesign. Elements of the sea and a center drift of the side scan lead to a documented new plan and refiguring the process so that this is unlikely to happen again.
Lt. Charles Wisotzsky’s sketch of the complications with launching both the sidescan sonar (which tends to centerline) and MVP towfish with a current coming from port side.This camera image captures the entanglement of the sidescan sonar and MVP.
Peaks
+Saw a tuna eat a flying fish
Flying Fish. (www.ocean.si.edu)
+There is a large sense of purpose on the ship. Despite complex sleep schedules to enable 24 hour operations with a smaller crew, people are generally happy and working hard.
+ There seems to be an unlimited supply of ice cream in the ice cream freezer. Junior Officer, ENS Garrison Grant introduced me to a new desert- vanilla ice cream, a scoop of crunchy peanut butter, and chocolate syrup. I also found the rainbow sprinkles.
Mission: Pelagic Juvenile Rockfish Recruitment and Ecosystem Assessment Survey
Geographic Area of Cruise: Pacific Ocean off the California Coast
Date: June 8, 2017
TAS David Amidon with a tray of sorted catch
Different Rockfish species caught 6/8/17
Science and Technology Log
The main scientific research being completed on the Reuben Lasker during this voyage is the Pelagic Juvenile Rockfish Recruitment and Ecosystem Assessment Survey and it drives the overall research on the ship during this voyage. Rockfish are an important commercial fishery for the West Coast. Maintaining healthy populations are critical to maintaining the fish as a sustainable resource. The samples harvested by the crew play an important role in establishing fishery regulations. However, there is more happening than simply counting rockfish here on the ship.
How does it work? Let me try to explain it a bit.
First, the ship will transfer to a specific location at sea they call a “Station.”
Collection stations off the California Coast that the Reuben Lasker trawls annually.
For a half hour prior to arrival, a science crew member will have been observing for Marine Mammals from the bridge area. When the station is reached, a new observer from the science crew will take over the watch outside on the deck. The fishermen on the boat crew will then unwind the net and launch it behind the boat. It must be monitored from the deck in order to ensure it is located 30 m below the surface. Once everything is set, then the ship trawls with the net at approximately 2 knots. Everything must be consistent from station to station, year to year in order to follow the standardized methods and allow the data recorded to be comparable. After the 15 minutes, then the crew pulls the net in and collects the sample from the net. This process is potentially dangerous, so safety is a priority. Science crew members can not go on the deck as they have not received the proper training.
Timelapse video of the fishermen bringing in a catch. 6/7/17 (No sound)
Once the sample is hauled in, the science personnel decide which method will be used to establish a representative sample. They pull out a sample that would most likely represent the whole catch in a smaller volume. Then we sort the catch by species. After completing the representative samples, they will eventually stop taking counts of the more abundant organisms, like krill. They will measure the volume of those creatures collected and extrapolate the total population collected by counting a smaller representative sample. Finally, we counted out all of the less abundant organisms, such as squid, lanternfish and, of course, rockfish. After the sample is collected and separated, Chief Scientist Sakuma collects all of the rockfish and prepares them for future investigations on shore.
A selection of species caught off the coast of San Clemente. These include Market Squid, Anchovies, Red Crab, King-of-Salmon (the long ribbonfish), and Butterfish, among others.
NOAA has used this platform as an opportunity. Having a ship like the Reuben Lasker, and the David Starr Jordan before that, collecting the samples as it does, creates a resource for furtAher investigations. During the trawls we have catalogued many other species. Some of the species we analyzed include Sanddab, Salp, Pyrosoma, Market Squid, Pacific Hake, Octopus, Blue Lanternfish, California Headlightfish and Blacktip Squid, among others. By plotting the biodiversity and comparing the levels we recorded with the historic values from the stations, we gain information about the overall health of the ecosystem.
What happens to the organisms we collect? Not all of the catch is dumped overboard. Often, we are placing select organisms in bags as specimens that will be delivered to various labs up and down the coast.
Collecting subsets for classification
This is a tremendous resource for researchers, as there is really no way for many of these groups to retrieve samples on their own. Rachel Zuercher joined the crew during this survey in part to collect samples to aid in her research for her PhD.
Along with the general species analysis, the team specifically analyzes the abundance of specific krill species. Krill forms the base of the marine ecosystems in the pelagic zone. They are a major food source for many species, from fish to whales. However, different krill species are favored by different consumers. Therefore, an extension of the Ecosystem Assessment involves determining the abundance of specific krill species. Thomas Adams has been responsible for further analyzing the krill collected. He counts out the representative sample and use microscopes to identify the species collected based on their physical characteristics.
Additionally, at most stations a Conductivity, Temperature and Depth cast (CTD) is conducted. Basically, bottles are sent overboard and are opened at a specified depth.
The apparatus for collecting water during CTD casts
Then they are collected and the contents are analyzed. Often these happen during the day prior to the Night Shift taking over, with final analysis taking place after the cruise is complete. This data is then connected with the catch numbers to further the analysis. Ken Baltz, an oceanographer on the ship, uses this information to determine the production of the phytoplankton based on the amounts of chlorophyll detected at depth. This is an important part of the food web and by adding in this component, it makes the picture below the surface clearer.
NOAA Corps’ Ryan Belcher completing the CTD collection for a station.
Finally, there are two more scientific investigations running as we cruise the open seas during the daylight hours. Michael Pierce is a birdwatcher from the Farallon Institute for Advanced Ecosystem Research who is conducting a transect survey of Seabirds and Marine Mammals. He is based on the Flying Bridge and catalogs any birds or marine mammals that pass within 300 meters of the ship’s bow. Although difficult, this study attempts to create a standardized method for data collection of this nature. As he explained, birds are more perceptive than we are – what looks like open ocean really varies in terms of temperature, salinity and diversity below the surface. Therefore, birds tend to favor certain areas over others. These are also important components of the food web as they represent upper level predators that are not collected in the trawl net. Also, on the bottom of the ship transducers are installed that are able to gather information through the EK60 Echosounder. This sonar can accurately identify krill populations and schools of fish underwater. Again, adding the data collected from these surveys help create a much more complete understanding of the food web we are analyzing out on the open sea.
Sonar data from the EK60
Personal Log
Sunday, June 4
The waves were very active all day. Boy am I glad I’m wearing the patch. There was so much wind and the waves were so high, there was a question if we were even going to send the net out. High wind and waves obviously add an element of concern, especially for the safety of the boat crew working the net.
I spent some of the day up on the Bridge- the section of the boat with all of the navigation equipment. The Executive Officer (XO) gave me an impromptu lesson about using the map for navigation. They have state-of-the-art navigation equipment, but they also run a backup completed by hand and using a compass and straightedge just like you would in math class. Of note – the Dungeness Crab season is wrapping up and many fishermen leave traps in the water to catch them. When the boat is passing through one of these areas, someone will act like a spotter so the boat can avoid getting tangled up. When I was looking with him, we saw some whale plumes in the distance.
We did launch the net twice Sunday night, collecting a TON of krill each time. In the first batch, we also caught some squid and other small prey species. The second trawl was very surprising. Despite cutting it down to a 5 minute trawl, we caught about the same amount of krill. We also caught more squid and a lot of young salmon who were probably feeding on the krill.
That is a ton of krill!
Monday, June 5
I am getting used to the hours now – and do not feel as guilty sleeping past 2PM considering we are up past 6 in the morning. It will make for a tricky transition back to “the real world” when I go home to NY!
During the day, spent some time just talking with the science folks and learning about the various tasks being completed. I also spent some time up on the Flying Bridge as they said they had seen some Mola, or Giant Ocean Sunfish (although I did not see them). I did have a chance to make a few videos to send to my son Aiden’s 3rd grade teacher back in NY. It did not work out as well as I had hoped, but considering we are out in the middle of the ocean, I really can’t complain about spotty wi-fi.
Once we started the night shift, we really had a good night. We completed work at 5 stations – which takes a lot of time. We saw a LOT of biodiversity last night – easily doubling if not tripling our juvenile rockfish count. We also saw a huge variety of other juvenile fish and invertebrates over the course of the night. We finally wrapped up at 6:30 AM, what a night!
Tuesday, June 6th
We found out today that we will need to dock the ship prematurely. There is a mechanical issue that needs attention. We are en route straight through to San Diego, so no fishing tonight. However, our timing will not allow us to reach port during the day, so we will get a chance to sample the southernmost stations Wednesday night. Thus is life at sea. The science crew is staying on schedule as we, hopefully, will be back on the water this weekend.
Wednesday, June 7th
After a day travelling to San Diego, we stopped at the stations near San Clemente to collect samples. Being much farther south than before, we saw some new species – red crabs, sardines and A LOT of anchovies. Closer to shore, these counts dropped significantly and krill showed up in numbers not seen in the deeper trawl. Again, I am amazed by the differences we see in only a short distance.
More from our anchovy haul- the bucket contains the entire catch from our second trawl, the tray shows how we analyzed a subset. Also on the tray you find Red Crab, Salps, Mexican Lanternfish and Krill.
I am on the day schedule which is from noon to midnight. Between stations tonight is a long steam so I took the opportunity with this down time to visit the bridge where the ship is commanded. The NOAA Corps officers supplied a brief history of the corp and showed me several of the instrument panels which showed the mapping of the ocean floor.
“The National Oceanic and Atmospheric Administration Commissioned Officer Corps, known informally as the NOAA Corps, is one of seven federal uniformed services of the United States, and operates under the National Oceanic and Atmospheric Administration, a scientific agency within the Office of Commerce.
“The NOAA Corps is part of NOAA’s Office of Marine and Aviation Operations (OMAO) and traces its roots to the former U.S. Coast and Geodetic Survey, which dates back to 1807 and President Thomas Jefferson.”(1)
During the Civil War, many surveyors of the US Coast and Geodetic Survey stayed on as surveyors to either join with the Union Army where they were enlisted into the Army, or with the Union Navy, where they remained as civilians, in which case they could be executed as spies if captured. With the approach of World War I, President Woodrow Wilson, to avoid the situation where surveyors working with the armed forces might be captured as spies, established the U.S. Coast and Geodetic Survey Corps.
During WWI and World War II, the Corps abandoned their peacetime activities to support the war effort with their technical skills. In 1965 the Survey Corps was transferred to the United States Environmental Science Services Administration and in 1979, (ESSA) and in 1970 the ESSA was redesignated as the National Oceanic and Atmospheric Administration and so became the NOAA Corps.
“Corps officers operate NOAA’s ships, fly aircraft, manage research projects, conduct diving operations, and serve in staff positions throughout NOAA.” (1)
“The combination of commissioned service with scientific and operational expertise allows the NOAA Corps to provide a unique and indispensable service to the nation. NOAA Corps officers enable NOAA to fulfill mission requirements, meet changing environmental concerns, take advantage of emerging technologies, and serve as environmental first responders.” (1)
There are presently 321 officers, 16 ships, and 10 aircraft.
We are steaming on a course that has been previously mapped which should allow us to drop the net in a safe area when we reach the next station.
The ship’s sonar is “painting” the ocean floor’s depth. The dark blue is the deepest depth. The path of the ship is highlighted. The circles are the stations to drop the nets for a sample of the fish at that location. This monitor shows the depth mapped against time. This monitor also showing the depth. A view inside the bridge at dusk. The full moon rising behind the ship ( and a bit of cloud )
What can you do ?
When I asked “What can I tell my students who have an interest in NOAA ?”
If you have an interest in climate, weather, oceans, and coasts you might begin with investigating a Cooperative Observer Program, NOAA’s National Weather Service.
“More than 8,700 volunteers take observations on farms, in urban and suburban areas, National Parks, seashores, and mountaintops. The data are truly representative of where people live, work and play”.(2)
Did you know:
The NOAA Corps celebrates it 100 Year Anniversary this May 22, 2017!
Cute catch:
Bobtail Squid
This bobtail squid displays beautiful colors! (3 cm)
Research vessels do not just work during the day. It is a 24/7 operation. Tonight I checked in with the night shift to learn more about the sonar mapping that has been done in the dark ever since I boarded NOAA Ship Pisces.
Algebra I level math in action!
The first thing I noticed entering the dry lab was a pad of paper with math all over it. Todd, the survey technician I interviewed earlier, had noticed the the picture the ship’s sonar was producing had a curved mustache-like error in the image. Details like temperature need to be taken into account because water has different properties in different conditions that affect how sound waves and light waves move through it. He used the SOH-CAH-TOA law to find the speed of sound where the face of the transducer head was orientated. He found a six meter difference between the laser angle and what the computer was calculating. Simple trigonometry on a pad of paper was able to check what an advanced computer system was not.
NOAA Ship Pisces is also equipped with an advanced multibeam sonar. (Sonar stands for SOund NAvigation and Ranging.) In fact, there are only eight like it in the world. One of Todd’s goals before he retires from NOAA is to tweak it and write about it so other people know more about operating it. Since they are so few and you need to go to them, there are fewer publications about it.
Another mapping device is the side scan sonar. It is towed behind the vessel and creates a 300 meter picture with a 50 meter blind spot in the center, which is what is underneath the device. Hydrographic vessels have more sonars to compensate for this blind spot. The purpose of the mapping is to identify new habitat areas, therefore expanding the sampling universe of the SEAMAP Reef Fish Surveys.
This slideshow requires JavaScript.
Up on the bridge looks much different. The lights are off and monitors are covered with red film to not ruin the crew’s night vision. Everything is black or red, with a little green coming from the radar displays. This is to see boats trying to cross too close in front of NOAA Ship Pisces or boats with their lights off.Lieutenant Noblitt and Ensign Brendel are manning the ship.
Ensign Brendel noted to me that, “We have all of this fancy equipment, but the most important equipment are these here binoculars.” They are always keeping a lookout. The technology on board is built for redundancy. There are two of most everything and the ship’s location is also marked on paper charts in case the modern equipment has problems.
There are international rules on the water, just like the rules of the road. The difference is there are no signs out here and it is even less likely you know who is following them. Each boat or ship has a series of lights that color codes who they are or what they are doing. Since NOAA Ship Pisces is restricted in maneuverability at night due to mapping, they have the right of way in most cases. It is also true that it takes longer for larger vessels to get out of the way of a smaller vessel, especially in those instances that the smaller one tries to pass a little too close. This did happen the night before. It reminds me of lifeguarding. It is mostly watching, punctuated with moments of serious activity where training on how to remain calm, collected, and smart is key.
Personal Log
It has been a privilege seeing and touching many species I have not witnessed before. Adding to the list of caught species is bonito (Sarda sarda) and red porgy (Pagrus pagrus). I always think it is funny when the genus and species is the same name. We have also seen Atlantic spotted dolphins (Stenella frontalis) jumping around. There are 21 species of marine mammals indigenous to the Gulf of Mexico, most in deep water off of the continental shelf. I also learned that there are no seals down here.
One of the neatest experiences this trip was interacting with a sharksucker (Echeneis naucrates). It has a pad that looks like a shoe’s sole that grips to create a suction that sticks them to their species of choice. The one we caught prefers hosts like sharks, turtles…and sometimes science teachers.
This slideshow requires JavaScript.
Did You Know?
Fishing boats use colored lights to indicate what kind of fishing they are doing, as the old proverb goes red over white fishing at night, green over white trawling tonight. Vessels also use international maritime signal flags for communication during the day.