


NOAA Teacher at Sea
Lisa Carlson
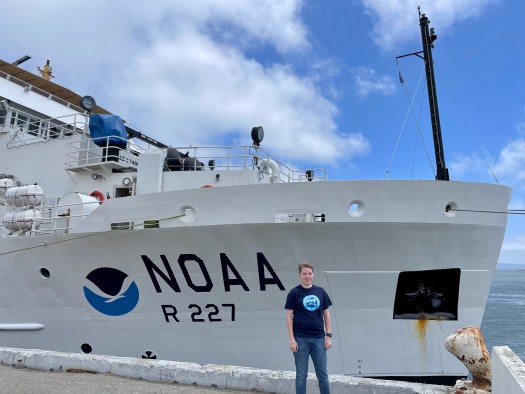
NOAA Ship Bell M. Shimada
July 5, 2023 – July 19, 2023
Mission: Fisheries: Pacific Hake Survey (More info here)
Geographic Region: Pacific Ocean, off the coast of California
Date: July 6, 2023
Weather Data from the Bridge:
— July 5 Departure
(1800 PT, 2100 EST)
Location: 37° 44.9’N, 122° 39.2’W
Docked at Pier 30/32
San Francisco, CA
Visibility: 10 nautical miles
Sky condition: Overcast
Wind: 17 knots from NW 300°
Barometer: 1012.8 mbar
Sea wave height: 1-2 feet
Swell: 2-4 ft from W 270°
Sea temperature: 14.2°C (57.6°F)
Air temperature: 14.7°C (58.5°F)
Course Over Ground: (COG): N/A
Speed Over Ground (SOG): N/A

— July 6 (1200 PT, 1500 EST)
Location: 35° 38.2’ N, 121° 18.9’ W
16nm (18mi) West of San Simeon, CA
Visibility: 10nm
Wind: 6 knots from 330°
Barometer: 1013.9
Sea wave height: 1-2ft
Swell: 2-4ft from 280°
Sea wave temperature: 14.4°C (57.9°F)
Air temperature: 14.9°C (58.8°F)
Course Over Ground: (COG): W 270°
Speed Over Ground (SOG): 10 knots
– – ⚓ – –
Science and Technology Log
On July 6, our first full day at sea, we gathered in the acoustics lab to observe and keep watch on data from various screens. Data includes our current course plotted on a digital chart, a camera showing current sea state, measurements of the wind speed and direction, and displays of the multiple frequencies at which the Simrad EK80 transmitter emits sound. The EK80 is used while traveling on numbered longitudinal east-west lines called transects. NOAA Ship Bell M. Shimada navigates on these lines while collecting acoustic data along the west coast of the U.S. and into Canada, in hopes of finding schools of Hake to collect for surveying.

(We hope to survey transects 8-35 by Cape Mendocino, CA before traveling north to dock in Newport, OR.)
“For acoustic surveys, the ship uses a multibeam echo sounder (MBES) that projects a fan-shaped beam of sound that bounces back to the ship. The ship’s MBES—one of only three systems of its type worldwide—acquires data from both the water column and the sea floor.”
NOAA Office of Marine and Aviation Operations (OMAO): “Bell M. Shimada”
The Simrad EK80 emits sound waves from the hull of the vessel down to the sea floor. The process is very similar to a dolphin or bat using echolocation to find prey. Any object the signal hits that has a different density and reflectivity than the surrounding water will cause the waves to bounce back to the ship. An image, called an echo gram, is pieced together each time this occurs and the acoustics team is able to use this information to determine if there are enough return signals that suggest fish are present to attempt a trawl.


“The sound pulses travel down into the water column, illustrated by the white cones here, and bounce back when encountering resistance.”
NOAA Fisheries: “Acoustic Hake Survey Methods on the West Coast”
Fish that have swim bladders, like bony fish, reflect or echo the sound wave back to the vessel very strongly. Other marine life such as myctophids and zooplankton also have a different density than the sea water, and reflect sound, although not as strongly as fish with air-filled swim bladders. The sea floor itself also reflects sound very strongly, because of the density difference between water and rocks, sand, and mud.
Marine life that have swim bladders (represented in blue) reflect or echo the sound wave back to the vessel. Examples of such marine life include bony fish, myctophids, and zooplankton, as well as the sea floor itself, which has a different density than the sea water.
Image: Cross section example of a Black Sea Bass to show a swim bladder.

If the acoustics team determines there is enough marine life (that they are interested in surveying) to attempt a haul, they will notify the bridge deck and officers that they would like to have the fishing net deployed.
Before an attempted haul, the science team conducts a marine mammal watch for ten minutes. In this time window, several pairs of eyes are observing from the bridge deck and stern for any signs of dolphins, whales, sea lions, seals, and any other marine mammals that are within 500 meters of the vessel. If any marine mammals are spotted within the ten minute observation, we will stand down and wait ten minutes before restarting the marine mammal watch. Net deployment cannot occur until the full observation window has completed.
First haul July 6:
1422-1432 Mammal watch, no marine mammals spotted.
The net deployment started, at which time the vessel continues forward at two knots. Vessel speed increases to three knots when the net is fully deployed with doors and weights in the water, which assist in opening the conical shaped net outwards linearly and laterally. During this time the science team watches displays of the EK80 frequencies and observe the linear width and depth of the net. Scientists can compare these displays to determine if the net is in the correct position to have the best chance of collecting fish.


Hauling back the net occurs after several minutes, at which time the vessel returns to a speed of two knots, and we estimate how many fish were collected. The amount of time in which the net is submerged depends on the depth of the water and acoustic information about the size of the school of fish the net is (hopefully) sampling. After recovery, the haul is deposited into a hopper which feeds onto a conveyor belt in the wet lab, then into large baskets and the wet lab team takes over.
During the first attempt, two sea lions were spotted which required the haul attempt to be paused. We restarted the ten minute marine mammal watch from 1500-1510, the deck department retrieved and reset the net, and the vessel was turned around to return to the start of the noted longitudinal transect. With no marine mammals spotted during the observation period, the second attempt was successful and resulted in:
– 1604-1634: 30 minute haul at 350m depth.
– 11 baskets of Hake collected.
– 4 sample baskets kept at random.
– 541 Hake counted and studied in the wet lab.
Photo: Two deck department members about to open the net to allow the sample to drop into a large collection basket.

– – ⚓ – –
Personal Log
On July 4 I arrived to pier 30/32 in San Francisco, CA to board NOAA Ship Bell M. Shimada. Although I grew up volunteering on the 441’ WWII Liberty Ship SS John W. Brown in Baltimore, MD, seeing a new ship still resulted in a mix of emotions, nervousness, adrenaline, excitement, and everything in between. After five and a half years, finally seeing the 208’ vessel that would become my home for the next two weeks was a core memory and feeling I will always remember.

Once onboard, I met Chief Scientist Steve de Blois and Wet Lab Lead Ethan Beyer. I was given a tour of the acoustic, chem, and wet labs and shown to my cabin. After dinner ashore, I joined some of the crew on the flying bridge to watch the July 4th fireworks. I met additional science team members and enjoyed a long night’s rest.
In the morning on July 5, we had a welcome aboard meeting, various trainings, a safety meeting and orientation, fire and abandon ship drills, and a science team meeting. We introduced ourselves, took an official team photo, and soon departed pier 30/32 for our 14 day mission. After passing under the Golden Gate Bridge and heading to the Pacific Ocean, our cold hands were warmed by a wonderful hot dinner of chicken, steak, fresh veggies, salad, and desserts from our galley crew. After dinner, we settled in for our first night at sea, waiting with anticipation for our first trawl on July 6.


Back: Maddie, Ethan, Toby, Jamie, Beth
Front: Myself, Steve, Abi


– – ⚓ – –
Did You Know?

– Hake can be cannibalistic!
– Some larger Hake we have collected have had a smaller Hake in their mouth, throat, or stomach!
– Their very sharp teeth often stick to our thick rubber gloves.
– – ⚓ – –
New Terms/Phrases:
“Salp: Barrel-shaped, planktonic tunicate in the family Salpidae. It moves by contracting, thereby pumping water through its gelatinous body.”
Wikipedia: “Salp”
“Myctophid: Lanternfish (or myctophids, from the Greek μυκτήρ myktḗr, “nose” and ophis, “serpent”) are small mesopelagic fish (…) Lanternfishes are aptly named after their conspicuous use of bioluminescence.”
Wikipedia: “Myctophid”
Simrad EK80: Multibeam Echo Sounder (MBES) transducer that emits sound waves from the hull of the vessel down to the sea floor. It allows scientists to observe and study returned sound wave signals that may suggest marine life is present.
Transect: Set and numbered longitudinal east-west lines NOAA Ship Bell M. Shimada navigates on while collecting acoustic data.


