NOAA Teacher at Sea
Beth Carter
Onboard NOAA Ship Rainier
June 25 – July 7, 2007
Mission: Hydrographic Survey
Geographical Area: Gulf of Esquibel, Alaska
Date: June 29, 2007
Weather Data from the Bridge
Visibility: 8 miles
Wind Direction: Light
Wind Speed: Aires
Sea Wave Height: None
Swell Wave Height: None
Seawater Temperature: 12.8 C
Dry bulb Temperature: 13.3 C, Wet Bulb Temperature: 12.2 C
Sea level Pressure: 1009.4 mb
Cloud Cover: Cloudy, light rain, 8/8
Depth: 31 fathoms

Personal Log (Just have to tell you about the whale first!)
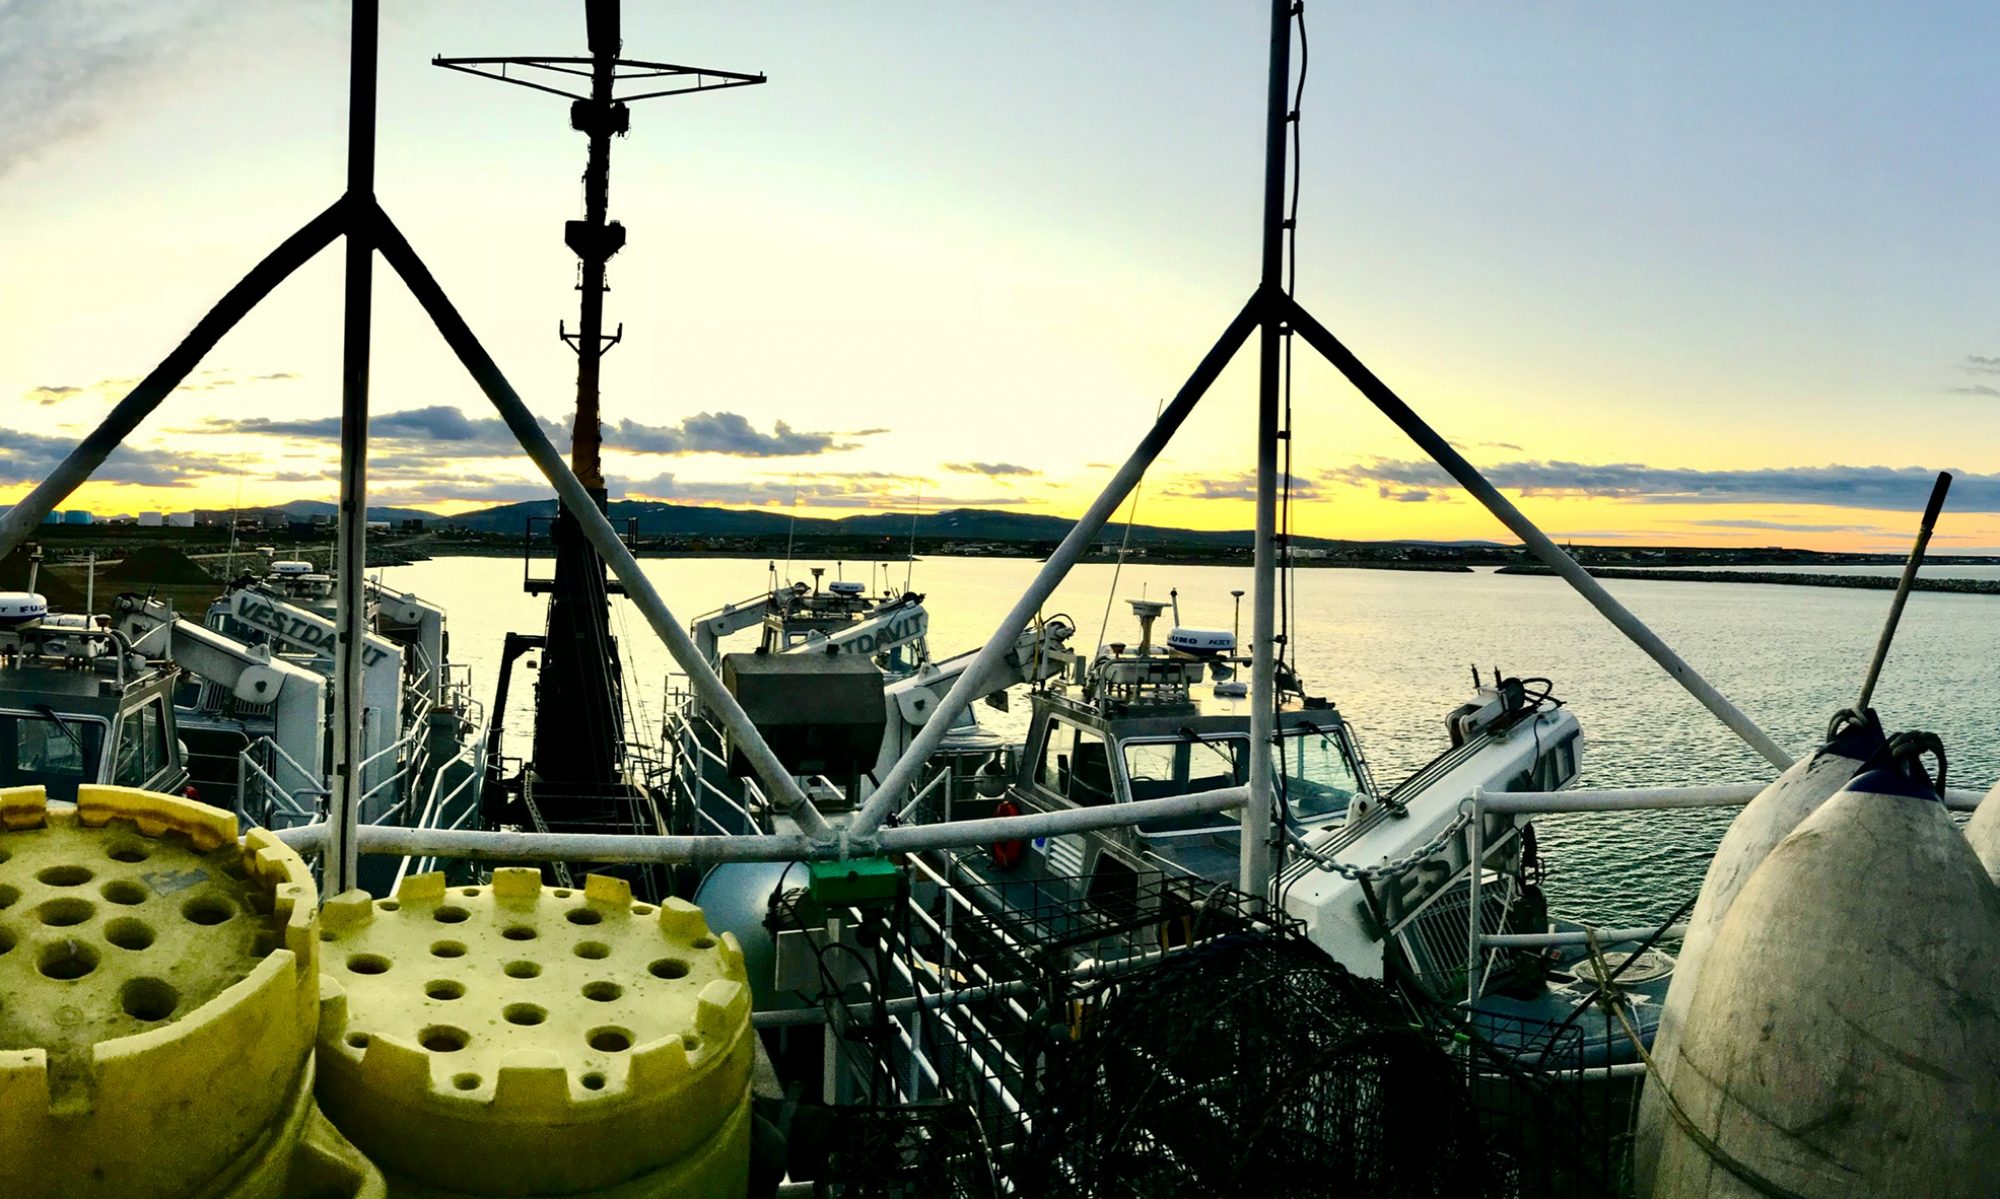
On Thursday, Aug. 28, I went out on the #4 launch from the RAINIER. When the hydrographic team goes out, they go out for the whole day…8:15 until 4:30 p.m. It was sunny and clear, our first sunny day! I went out with ENS Meghan McGovern, Elishau Dotson, Assistant Survey Tech, and our pilot, Jodie Edmond, Able Bodied Seaman – an all female boat crew! First, I have to focus on the wildlife that we saw – it was totally incredible! We saw several sea otters floating on their backs, whiskery and cute! We saw a doe leading her two fawns on the shore of an island. Eagles soared overhead all throughout the day, and one dove to catch a fish (missed), but later, he grabbed one in his talons. We got a quick glimpse of a mother harbor porpoise and her calf feeding near the shore.
The highlight of the day, though, was seeing a humpback whale breaching near the boat – to say that I was totally enthralled is not adequate. I don’t think the dictionary has any words that truly fit! First, I saw a silver/gray shape under the water near the stern, and thought it was a stingray, a common sight on the East Coast. Then, I heard a gasp/blow as the whale surfaced to breathe. The sound was like the “grunt” that Monica Seles makes as she serves up a tennis ball, only lower and longer. We saw the whale surface a few more times, and then his great leap. I was trying to videotape, and of course, I missed it. But it will stay in my memory forever, if not on a memory card.
Science and Technology Log

Now, to focus upon the hydrographic mission! Before beginning the surveying, the crew lowers a CTD to the sea floor to collect a reading on the Conductivity, Temperature, and Depth of the water. The way that the sonar “pings” travel through water is affected by all three factors. The higher the percentage of salinity, the greater is the ability of the water to conduct sound waves. Higher temperatures also increase sound conductivity in water, and deeper water also conducts sound waves better than shallow water. For example, if the launch is surveying the sea floor in an area near where a freshwater creek is flowing in, the conductivity of the water would decrease; therefore, the survey tech crew that does the night processing of the data would be able to correct the resulting data taking into account the lower conductivity. Number 4 launch has a multibeam sonar transducer mounted on the hull. The transducer produces a broad band of sound “pings” that bounce off the sea floor and return to the launch to be recorded by a sophisticated computer with four screens. The operator of the sonar equipment can see a digital display of the depth, and a real-time three-dimensional picture of the sea floor beneath and around the launch. The boat driver is constantly aware of the depth, so as not to run the launch aground on rock formations.

The driver steers the boat along a pre-set grid of lines that are programmed into the ship’s computer the night before. Jodie said it is rather like “mowing the grass,” on the surface of the water. You “mow” the water in neat rows until you’ve mowed over every line on the chart established by the hydrographers. After all the lines were run, we returned to the ship, and then, other hydrographic scientists began to run a correction program on the data we gathered. In this way, they clean out errors that are caused by extraneous noises, kelp, echoes, and other obstacles. In the afternoon, we were “snagged” by a gigantic clump of kelp that got wrapped around the transducer. There was so much kelp, the launch could not maneuver effectively. ENS McGovern stabbed the kelp with a boat hook, and Jodie reversed the engines until we shook the kelp loose. Learn more about seafloor mapping here.
Questions of the Day

These questions are particularly for Ms. Southgate’s oceanography students at Hoggard High School in Wilmington, N.C. (and any other curious people!)
- I’m learning that salinity affects conductivity of sound waves. Why does a high concentration of salt in water make sound travel faster? Does electricity travel faster or slower through fresh and salt water? Why?
- As we drove different lines yesterday, we took three different CTD readings? Why do you think the hydrographers felt we should collect data three times?
- The islands here are very craggy and steep, and made up largely of granite and limestone rock. Much of the sea floor is also rock. Why is the coast of Alaska so vastly different to America’s Eastern coast?
- The islands here drop very sharply off into deep water. For example, just 3-4 meters from shore, the depth can drop to 20 meters. Why is this common here? How much is 20 meters measured in feet? In fathoms?

