Mission: Hydrographic Survey – Approaches to Houston
Geographic Area of Cruise: Gulf of Mexico
Date: July 5, 2018
Personal Introduction: Greetings! My name is David Tourtellot, and in just a few days I will be joining the crew of NOAA Ship Thomas Jefferson as part of the Teacher At Sea program. I feel very fortunate having been chosen for this opportunity, and I couldn’t be more excited!
I received a degree in Music Education from the Conservatory of Music and Dance at the University of Missouri – Kansas City, and I just finished my fifth year teaching 5th and 6th grade orchestra classes at 4 elementary schools in Lee’s Summit, Missouri. We had a great year making music together!
David Tourtellot
I have long been fascinated by the field of acoustics, and I share that with my students. Not only do they learn the fundamentals of playing music, we also discuss how their instruments make sound, the properties that make one instrument sound different from another, and why our ensemble sounds different performing in one room than we do in another. Currently, NOAA Ship Thomas Jefferson is doing a hydrographic survey and is using sonar (which operates using sound waves) to detect what is underwater. I am very much looking forward to learning more about this, and helping my students to make deeper connections between science and the arts.
At the National Weather Service Forecast Office in Pleasant Hill, Missouri
I’m also looking forward to spending time on the ship. I’ve lived my entire life in the Midwest, and can count the number of boats I’ve been on on one hand. This will certainly be a new experience!
NOAA and the University of New Hampshire Center for Coastal and Ocean Mapping/Joint Hydrographic Center have partnered up to test out an Autonomous Surface Vehicle (ASV), a programmable robotic survey boat. In two weeks, they will be deploying the ASV in the Arctic, in the Point Hope vicinity, where NOAA Ship Fairweather has been tasked to map the ocean.
There are many benefits to using the ASV for ocean mapping. First, it is able to survey in shallower waters than the launch boats, especially along coastlines. This data will be helpful to those who work on predicting storm surges and flooding for coastal communities. Second, the ASV can survey in potentially dangerous areas the launches would not be able to gain access to, such as in rocky areas or areas where there may be sandbars, that data will be helpful for smaller boats who use the area. Third, it can provide additional survey capacity in conjunction with the launches. For example, 4 launch boats could be sent out and an ASV to get an area surveyed, cutting down on the time required to accomplish missions. And lastly, if trained personnel are not available to drive or survey in a launch, this gives an additional option to the crew to accomplish the survey.
While those benefits are the goal of using ASV’s in the future, this summer’s mission with the ASV is to allow people to get acquainted with the robot, work out issues with software and the robot itself, and see how effective this tool is. The crew will practice deploying and recovering the robot. While robots can make jobs easier and possibly even safer for humans, until it is tested, you are never sure if they will actually be helpful. Robots in general tend to be finicky, have no sense of danger, and are not be able to work when waves are too high. Additionally, sometimes how we presume something will work in theory plays out differently in practice. I see this in my classroom all the time when the first and fourth graders are working with their robots and inventions, so trial and error is important, especially with a new tool. However, with any luck, this will serve as an excellent resource for the future of ocean hydrography.
How do you keep spirits high in Alaska, on a research vessel?
The crew on NOAA Ship Fairweather seems to have the right idea when it comes to keeping moral high. As I have said before, living and working in the same smallish space can have it challenges. Yet this ship has been doing scientific hydrographic research for 50 years, and has people on board who love their job and this small community. So how do they do it? I have learned a few of their ways.
They are a super welcoming community. They accept each other, and the different perspectives people bring to the job, and make each other feel appreciated. This welcoming attitude plays well for those who visit, as well.
They have Carrie, a chef who makes three delicious meals a day with her fellow stewards. She uses quality foods, remembers everyone’s likes and dislikes, and cheerfully greets everyone as the come into the mess line. Everyone on board looks forward to meals and especially her desserts! From cookies, carrot cake, puddings to even cheese cake; she is keeping everyone a bit spoiled- especially me!
They have a gym on board. There are machines, weights, group challenges and goal setting going on. Working out helps people have an outlet for their stress and any pent up energy. Also, it can help you feel better after having a bit too much dessert one night!
Workout machines
Treadmill
There is a ship store, which stocks essentials, candy, people’s favorite sodas, and some ship memorabilia. And let’s be honest, sometimes you need a Diet Coke, M&M’s, or a Zip Fizz to help you get 41,000% of your daily B12! All profits go into the staff’s moral fund. This can get used for the staff to have extra snacks, excursions and community evenings on the boat.
They have a Moral, Wellness and Recreation committee (MWR). This group of 5 individuals plan and put on community events some evenings while at sea, excursions while in port and support other community gathering events.
General community gatherings take place regularly. While I have been on board, there have been movie and TV show nights where people gather in the lounge and watch together. A board game evening where those interested gathered to battle each other at Settlers of Catan. A Rock Band evening where even I found myself singing and playing guitar with officers, visitors and the CO and XO of the ship.
Rockband
There is a Finer Things Club where people listen to classical music, light fake candles, share candies, cheeses and other items not on the ships menu with one another. And just have some nice, classy relaxation time with one another.
They have access to a huge collection of movies; both old and brand new. This creates much excitement and joy for many. In addition to that, there is an extensive board game collection, model planes that can be built and puzzles for those who prefer quieter evenings.
They celebrate holiday and maritime events in a big way! The MWR club decorates the ships common areas for such events, and works overtime to make sure everyone knows what’s going on. From drawing decorative hand turkeys for Thanksgiving, carving pumpkins for Halloween and making red white and blue rag tapestries for Independence Day; even though they are at sea, they are not missing out!
Everyone helps out when one department needs it. This helps create unity among the staff and for everyone to get to know each other better. Those in Survey help out the Deck Department for docking and launching, and if someone gets sick or a department is low in personnel, they sign up to help out that department.
Personal Log
Today is my last full day on the ship, so I will be posting one more blog when I return home. My experience has been so enlightening about NOAA, hydrography, Alaska, and life on a ship! I can not wait to share this with all of you, my students! For those of you still reading along this summer, this is the path we have taken from Juneau to Nome, AK. I unfortunately will not be continuing on with NOAA Ship Fairweather as they venture farther north, but am so impressed with their dedication and skill in making our coastlines safe for both the mariners in the area and the environment.
Mission: Hydrographic Survey- Approaches to Houston
Geographic Area of Cruise: Gulf of Mexico
Date: July 5, 2018
Weather Data from the Bridge
Latitude: 28° 53.4’ N
Longitude: 093° 44.6’ W
Visibility: 10+ NM
Sky Condition: 3/8 (Reminder: 3 out of 8 parts of the sky are covered with clouds.)
Wind: 6 kts
Temperature:
Sea Water: 29.1° C
Air: 27° C
Science and Technology Log
It is fitting to add a section on weather because tonight we are seeing a lightning storm! I can even hear the fog horn. During Bridge Watch, weather data is logged every hour around the clock. Every four hours, it is entered into a computer system. On most days, we are fortunate to get a weather report in various character voices over the intercom from ENS Krabiel.
This is the hourly weather log from June 26, 2018.
My favorite tools are the wind wheel, alidade, and relative humidity thermometers.
A somewhat complicated process allows one to find the true direction (opposed to relative) of the wind. Since the ship is not always traveling North, it is important to be able to calculate true wind direction. Officers typically use a reading on the computer to find true wind direction, but I thought it was a neat tool to try.The alidade is located outside of the Bridge. It is a sighting device used for measuring angles. It has been helpful with measuring the swell direction. ENS Krabiel mentioned that it is also useful for checking bearings when a ship is anchored. For example, a bearing (like to an oil platform in the Gulf of Mexico) will change if the ship is drifting and/or dragging anchor.On the Weather Log, there is a place for “dry bulb” and “wet bulb.” This information is collected using two thermometers outside of the Bridge. The dry bulb is a typical thermometer, while the wet bulb has a small sock-like covering wicking up water from a tray. The closer the two temperature values, the higher relative humidity.
I have also sat in on a number of data processing evenings with the Survey Team. In one evening, roughly 50 GB of data from multibeam sonar only was processed. It is estimated that a total of 11 TB has been processed since April. Data processing begins around 7:30 pm and the survey team analyzes all information collected during the hours of 7am- 7pm. Staying on top of processing is important because of the massive amounts that accumulate, especially from side scan sonar.
Julia Wallace, physical scientist, showed me one aspect of processing multibeam sonar. She takes a file of data and runs a “flier finder” with a parameter of 0.5 meters (appropriate for the depth of sonar.) Essentially, the flier finder is marking any outliers that fall outside of this range. Julia then manually goes through and “hides” these points so that they do not contribute to the data set. This is important because when this data is used to mark bathymetry (sea floor depth) on nautical charts, it will somewhat randomly “grab” these false sounding set numbers and could land on one of the outliers, resulting in a false depth.
Every dot in this picture of raw data is a sonar ping returning to the multibeam echosounder. The number of pings depends on the sonar sounding frequency. For example, one could expect 300 pings per second when operating at a sounding frequency of 300 hz.
From what I have witnessed and gathered through multiple conversations with the team, the data collected by the Thomas Jefferson for NOAA charts is extremely accurate. For example, every pixel (or node) on the multibeam sonar grid represents no coarser than 1 square meter of the sea floor. This has changed from about 30 years ago where the ratio was 1 nodel: 5 square meters. In addition, many processes are doubled-up as a check for validity. This includes crosslines for checking main scheme data and operating two multibeam frequencies at the same time.
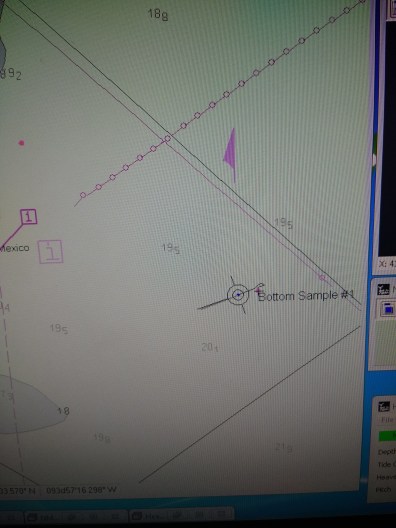
One of the benefits to running two frequencies of multibeam is the ability to create an overlapped average of the two backscatter signals (with a false color scheme.) This information helped inform Lt. Anthony Klemm and survey technician Kevin Brown determine eight unique sites varying in backscatter intensity for bottom sampling. (Remember: intensity is a measure of how strong the sonar ping returns, depicting varying sea floor substrate.
The use of this technology paid off! All eight sites sampled varied in texture and sediment size. Using this process of selectively choosing sites of interest based on “multispectral” backscatter intensity has replaced taking numerous random bottom samples using a grid. Again, this is a highly accurate and time-saving process. It was also interesting seeing the actual sea floor that we are mapping.
In the bottom right corner, Bottom Sample #1 site is selected.
CHST Allison Stone manages the crane while Lt. Charles Wisotzsky directs the bottom sample claw and ENS Taylor Krabiel performs various substrate tests.
ENS Krabiel gives me a tutorial on bottom sampling. Krabiel enjoys creating short “Rock Hunting” clips for entertainment. His enthusiasm has made this trip a lot of fun.All of the eight bottom sample sites had a different composition. One in particular had a lot of rocks and shells. The rock in the upper right appears to have remnant tunicate casings.Notes from survey sheet H13044, BS# 001 (Bottom Sample #1) state the grain size: silt, muddy, coarse, and some shell fragments.
A GoPro is located in a cage on the bottom sample claw. Video footage of the sea floor enables hydrographers to view the substrate and current ripples in the sand. ENS Krabiel wears the control on his wrist to activate the camera.
Personal Log
I have enjoyed hearing the back-stories of the crew. For example, Allison Stone, Chief Survey Technician knew she wanted to be a part of NOAA when she was in 6th grade- the same age as my students. She remembers going to a parent career night at school and speaking with a presenter from NOAA. The presenter was enthusiastic about their job which inspired Allison to pursue a placement with NOAA. Although she envisioned counting marine animals and snorkeling daily, she is still passionate about her work in hydrography geoscience and speaks highly of NOAA outreach.
Field Operations Officer, Lt. Anthony Klemm started out wanting to do a public service and became a teacher. Later, he joined the NOAA Corps and after completing basic training got a job at the Marine Chart Division in Washington DC. It was during this time that he was given a lot of flexibility and time to create and test his own ideas and experiments. In his words, some of them flopped. However, one idea that has recently captured attention is the idea of “crowdsourcing” bathymetry. Collecting, processing, and submitting data for the official approval and update of NOAA nautical charts is a long process. It can take months for charts to be updated and available to the public. Crowdsourcing bathymetry is a way for the general public to gather and submit sonar data using simple devices like a “fish finder” that one might find on a recreational boat. These could serve as interim bathymetry data until the areas can officially be surveyed and charted. It’s also simple (users select a setting), and free.
This photo and thee above are snapshots of data collected using “crowdsourced” bathymetry.
Peaks
+ Participated in a simultaneous medical/fire drill.
“This is a drill, this is a drill. There has been a medical emergency on the starboard stairway of the bridge…” The person in this picture is only acting and not actually injured. The bridge had also simulated a fire which interfered with steering and communications.A debrief was held in the Mess after the drills.This was a day for drills. The FRB (Fast Rescue Boat) was manually unloaded using a hand brake to simulate loss of power. Earlier in the day, the launch boat was manually loaded back onto the ship. Passengers (including myself) boarded the ship using a rope ladder.
Geographic Area of Cruise: Seattle, Washington to Sitka, Alaska
Date: 6/20/18
Weather Data from the Bridge
Latitude and Longitude: 57°52.9’ N, 133 °38.7’ W, Sky Condition: Broken, Visibility: 10+ nautical miles, Wind Speed: Light Variable, Sea Level Pressure: 1013.5 millibars, Sea Water Temperature: 3.9°C, Air Temperature: Dry bulb: 17.8°C, Wet bulb: 14°C
Science and Technology Log
After the morning meeting of hearing everyone’s risk assessment before getting on the launches, I was part of the four person crew on launch RA-6. Our task for the day was to clean up the data, or collect data in places within the Tracy Arm polygon that weren’t already surveyed. We had to fill in the gaps in L and M polygons on the East point. The entire area of Tracy Arm needed to be surveyed because there are several cruise ships that are coming into this area now that Sawyer Glacier is receding and the area has not been surveyed since the late nineties. Navigation charts must be updated to ensure that the safety of the people that are visiting the area.
Launch going out to survey
Once on the launch, the bright orange POS MV, or Positioning Orientation System Marine Vessel, must be powered to start the survey process. The new acquisition log was created as an excel spreadsheet to record the different casts along with the latitude and longitude, the maximum depth and the sound speed of the water at about approximately one meter. With all of the valuable data recorded, it is important to have a consistent system for managing all of the data so that it can be accessed and managed efficiently.
The EM-2040 Konsberg Sonar S.I.S., Seafloor Information System, program was powered on next. The EM processing unit, which is connected to the multi-beam sonar, has three lines of information when properly communicating with sonar. The right hand monitor in the launch displays the information from the sonar. Creating the file name is another crucial way of ensuring that the data can be managed properly. It is from this computer that you can manually adjust the angle of the beam swath with the sound pings.
Sonar Computer Systems
Once the computers were started and communicating with each other, we completed a C.T.D. cast to obtain the sound speed profile of the water. There is also a device that measures this right on the multibeam sonar, but it is important that two devices have a similar sound speed profile to ensure data accuracy. If there is a large discrepancy between the two values, then another cast must be taken. Initially, the measuring sound speed profile at the interface was 1437.2 and the C.T.D. sound speed was 1437.8. The final algorithm that determines the depth of the water will take this information into account. Since we were somewhat close to a waterfall, the fresh water input most likely affected the sound profile of the water.
Preparing the CTD
After viewing the data acquired in the sheet, or the assigned area of Tracy Arm to survey, Greg found areas where there were holes. He put a target on the map on the monitor on the left hand side computer. This HYSWEEP interface for multibeam and side scan sonar (which is a subset of HYPAC which is the multibeam software) screen shows a chart of the area with depths in fathoms and any rocks or shoals that would impede driving ability along with a red boat image of the vessel. This display is what the coxswain driving above also sees so that he or she is aware of what direction to travel. Once logging data, this screen also displays the beam so that you can ensure that all necessary data is being acquired. Previous surveys are depicted in a more subdued color so that you can see that the missing data is being collected. From the monitor, the survey technician must control the view of the map to be sure that it includes the targeted area, along with the path of the boat so that future obstructions can be avoided.
Multi-beam Sonar Work Station
Since we were avoiding icebergs in the initial part of the clean up, we were going at about two knots. This slow pace allows for an increase in returns, nodes and soundings that increase the data density. Shallow waters take much longer to survey due to the smaller swath width. It is important to have accurate, high resolution data for shorelines since this is the area where many vessels will be traveling. When a sonar pings, every swath, or fan-shaped area of soundings, returns five hundred soundings. Five hundred soundings times a rate of seven pings per second means there are thirty five hundred soundings per second total. This data density enhances the resolution of the maps that will be generated once the data has been processed.
Since there are sometimes safety hazards when surveying there are several different approaches that can be used to ensure the entire area is surveyed in a safe manner. Half stepping included going back over previous coverage far enough away from the hazard. Scalloping is another method which involves turning right before the rock or obstruction. This sends the beam swath near the rock without putting the vessel in danger. Some areas that were too close to icebergs could not be surveyed since it was not safe. But, this hydrographic survey was able to acquire data closer to the Sawyer Glacier than ever before. Being a part of this data collection was gratifying on many levels!
Personal Log
Seeing a white mountain goat amongst some of the most beautiful geological features that I have ever laid eyes on was another benefit of being out on the launch for the day. When a grizzly bear cub ran by a waterfall I continued to appreciate a day on the launch. Seals perched on icebergs were always a fun sight to see. And, the endless pieces of ice drifting by in the sea during our surveying never ceased to amaze me.
Seals on an Iceberg
After a day of surveying, kayaking to a waterfall in William’s Cove and exploring proved to be another fun adventure.
Waterfall in William’s Cove
Growing Muscle like Growing Character
The other day as I ran on the treadmill, I had a realization. While looking at the lifting weights, I realized that in order to build muscle, one must tear old muscles and rebuild new strands of protein. When these new fibers build on top of each other, muscles grow. I realized that new officers go through a similar process of developing skills and character. Junior officers come in with a two year responsibility where they learn an incredible amount. They are constantly put into new and challenging learning experiences where they tear their muscles. As they acclimate to these experiences, they build character, or muscle. The cycle repeats with subsequent occurrences.
Junior Officer ENS Airlie Pickett has a small triangle tattooed on her inner left bicep. When I asked her the significance of it, she said that the only way that you can truly understand something is to observe how it changes. In math, integrals and derivatives explain this change.
As I appreciated her tattoo, I considered that she must learn quite a lot about herself as a junior officer constantly learning new things. I’ve appreciated the opportunity to experience and observe myself in an unfamiliar surrounding on Rainier. It’s humbling to not understand the nautical terms, endless acronyms of surveying and NOAA Corps structure of life. I appreciated that all hands on Rainier made me feel welcomed, and were patient with explaining new concepts to me. I am grateful for the opportunity to experience the Inside Passage while learning about hydrographic surveying. Living on a ship, learning about navigation and meeting all of the hard working people on Rainier has been an unique experience.Overall, this has been an incredible opportunity. Mahalo nui loa! (Thank you very much). A hui hou Rainier! (Until we meet again)!
Did You Know?
Barometers measure atmospheric pressure in millimeters of mercury or atmospheres. An atmosphere is the amount of air wrapped around the Earth and one atmosphere, atm, is the amount of pressure at sea level at fifteen degrees Celsius. As altitude increases, the amount of pressure decreases since the density of the air decreases and less pressure is exerted. A decrease in altitude increases the amount of pressure exerted and the density of the air increases.
Changes in pressure can signify weather patterns. A drop in barometric pressure means a low pressure system is coming in and there is not enough force to blow away the weather. Weather indicative of this includes windy, cloudy and/or rainy weather. An increase in barometric pressure means a high pressure system is coming in and cool, dry air pushes out the weather resulting in clear skies.
The last two days have been surveying days. With the MVP (described in the last blog) deployed, the survey team got to work. This ship uses multibeam sonar which is affixed below the ship. Since surveying can be done at all times of day, 3 teams were created to do Survey Watch; each team worked two 4 hour blocks during the day to make sure the data was collected correctly. I was luckily placed on one of the teams, working the 3:30-7:30pm shift and the 3:30-7:30am shift. While these may not be the most normal of work day times, especially the latter, I was excited to be included and experience how work gets done on this ship.
This image, courtesy of NOAA, depicts a MBSS beam below the ship and the mapped results off the stern.Ali Johnson monitoring 5 screens to make sure the sonar mapping is done correctly.
I was teamed up with two amazing female scientists and surveyors on Survey Watch, Megan Shapiro and Ali Johnson.
Megan is from Maryland and got her undergraduate degree from UNC Wilmington in Marine Biology Conservation
Megan is from Maryland and got her undergraduate degree from UNC Wilmington in Marine Biology Conservation. She has a love for whales and that is what brought her to Alaska, as she used to work in Seward, Alaska as a deck hand and naturalist on whale watching excursions. To NOAA’s luck, this is where Megan learned about NOAA Ship Fairweather and its hydrographic mission. Megan joined the ship about three month ago and has gotten tons of on the job training to help her learn how to map the sea floor.
Ali Johnson is from Iowa, and got her undergraduate degree in Environmental Studies, with a dual minor in Biology and Coastal Management from Eckerd College.
Ali Johnson is from Iowa, and got her undergraduate degree in Environmental Studies, with a dual minor in Biology and Coastal Management from Eckerd College. She learned about NOAA and its work with sonar while she was volunteering at Gray’s Reef National Marine Sanctuary in Georgia. NOAA was actually using sonar in the preserve to help learn about diurnal fish migrations and predator prey relationships in the area.
While on Survey Watch, Megan and Ali monitor the ships sonar readings along the sea floor, deploy the MVP continuously throughout the trek to gather up to date data, and make sure the information is being recorded correctly. They work along side the officers to monitor the ship’s course to make a full coverage map of the area, which means having the ship go back and forth, like a lawn mower might do in your yard, until all pieces of an area are mapped. And then once all the sonar soundings are in, weeks of processing that data starts. They use correctors for the data, such as: tides, roll and pitch of the boat, sound speed, and position, to then help create the most accurate representation of the sea floor.
I wanted to know more about these amazing scientists. NOAA Ship Fairweather is a fairly large ship which can hold approximately 50 people, Megan and Ali are two of the only five women who work onboard.
What is the most rewarding part of this job?
Megan: Probably knowing that the work I am doing is going to be making the nautical charts used by mariners all over the world, it’s cool to know I am taking part in that.
Ali: I like the high quality and accuracy of data we provide, it allows for others to use the data in other applications, such as tsunami and hurricane planning, hazard mitigation and in other facets of NOAA.
What are some of the perks working for NOAA and on NOAA Ship Fairweather?
Megan: Getting to travel to new places and getting to meet a lot of new people, many of which are like minded.
Ali: We get to travel and gain access to remote areas of the world which are stunning. I like being out on the water as well. Additionally, we get access to new release movies before they hit stores, so that’s pretty nice, too!
What are some of the challenges to this type of work?
Megan: It’s hard staying in touch with friends and family since the ship is normally out of cell service range and the wifi can be slow. Additionally, I miss cooking! While the ship offers us great cooked meals, I sometimes miss cooking for myself.
Ali: One of the biggest challenges is just being away from cities. If we wanted to go to the east coast, or home for a long weekend, its kind of hard. It is a 17 hour trip, from Juneau, with all the connections.
What have been some of the coolest or most memorable moments on the job?
Megan: While processing the data for an area known as Tracy Arm, my coworker and I discovered a previously unknown underwater trench! When we were looking at the area during processing, the area looked like it had a cut or dip in the surface. Once it was 3-d imaged you could see the trench. It was pretty cool.
Ali: Last year, a fishing/crabbing vessel, F/V Destination, went down in February with six on board. NOAA Ship Fairweather was passing through the area in June, and it had yet to be found. Since we were in the last known area of the vessel the Coast Guard asked us if we could spend a day or two in the area and use our sonar to see if we could help find it. We had only planned on spending one day looking since we were on our way to the Arctic, but when that day was done we decided to do one last pass and on the 26th hour the sonar ended up finding it. It was nice to be able to provide the families with closure.
What did you want to be when you were growing up?
Megan: I wanted to be a zoo keeper! Or really anything with animals, I thought about being a teacher, too.
Ali: I knew I wanted to do something with the oceans. Originally I wanted to work with ocean animals, possibly mammals or cephalopods.
Where do you see yourself in 20 years?
Megan: Hopefully, having a farm by the ocean where I can have lots of dogs. I would love to have an Irish Wolf Hound, Collie and a Borzio in particular. Maybe get my masters in Marine Biology and continue studying whales.
Ali: Maybe I’ll be retire from NOAA by then and look into starting a nonprofit for the ocean. I’ll probably live somewhere warm and tropical; maybe lead a dive school to get others interested in the ocean, as well. And I’ll have some dogs, too!
Personal Log
I keep finding myself outside the ship to view the Alaskan coastline or to scope for animals. It is truly beautiful here. So far I have been lucky enough to see quite a few whales, sea lions, porpoises and sea birds including albatross. It is a bit cold, so I can only be outside for a little bit, but I find the time completely worth it. Soon my time will be up and I want to be able to remember this experience and the Alaskan beauty I am in.