Susan Smith, June 8, 2009

NOAA Teacher at Sea
Susan Smith
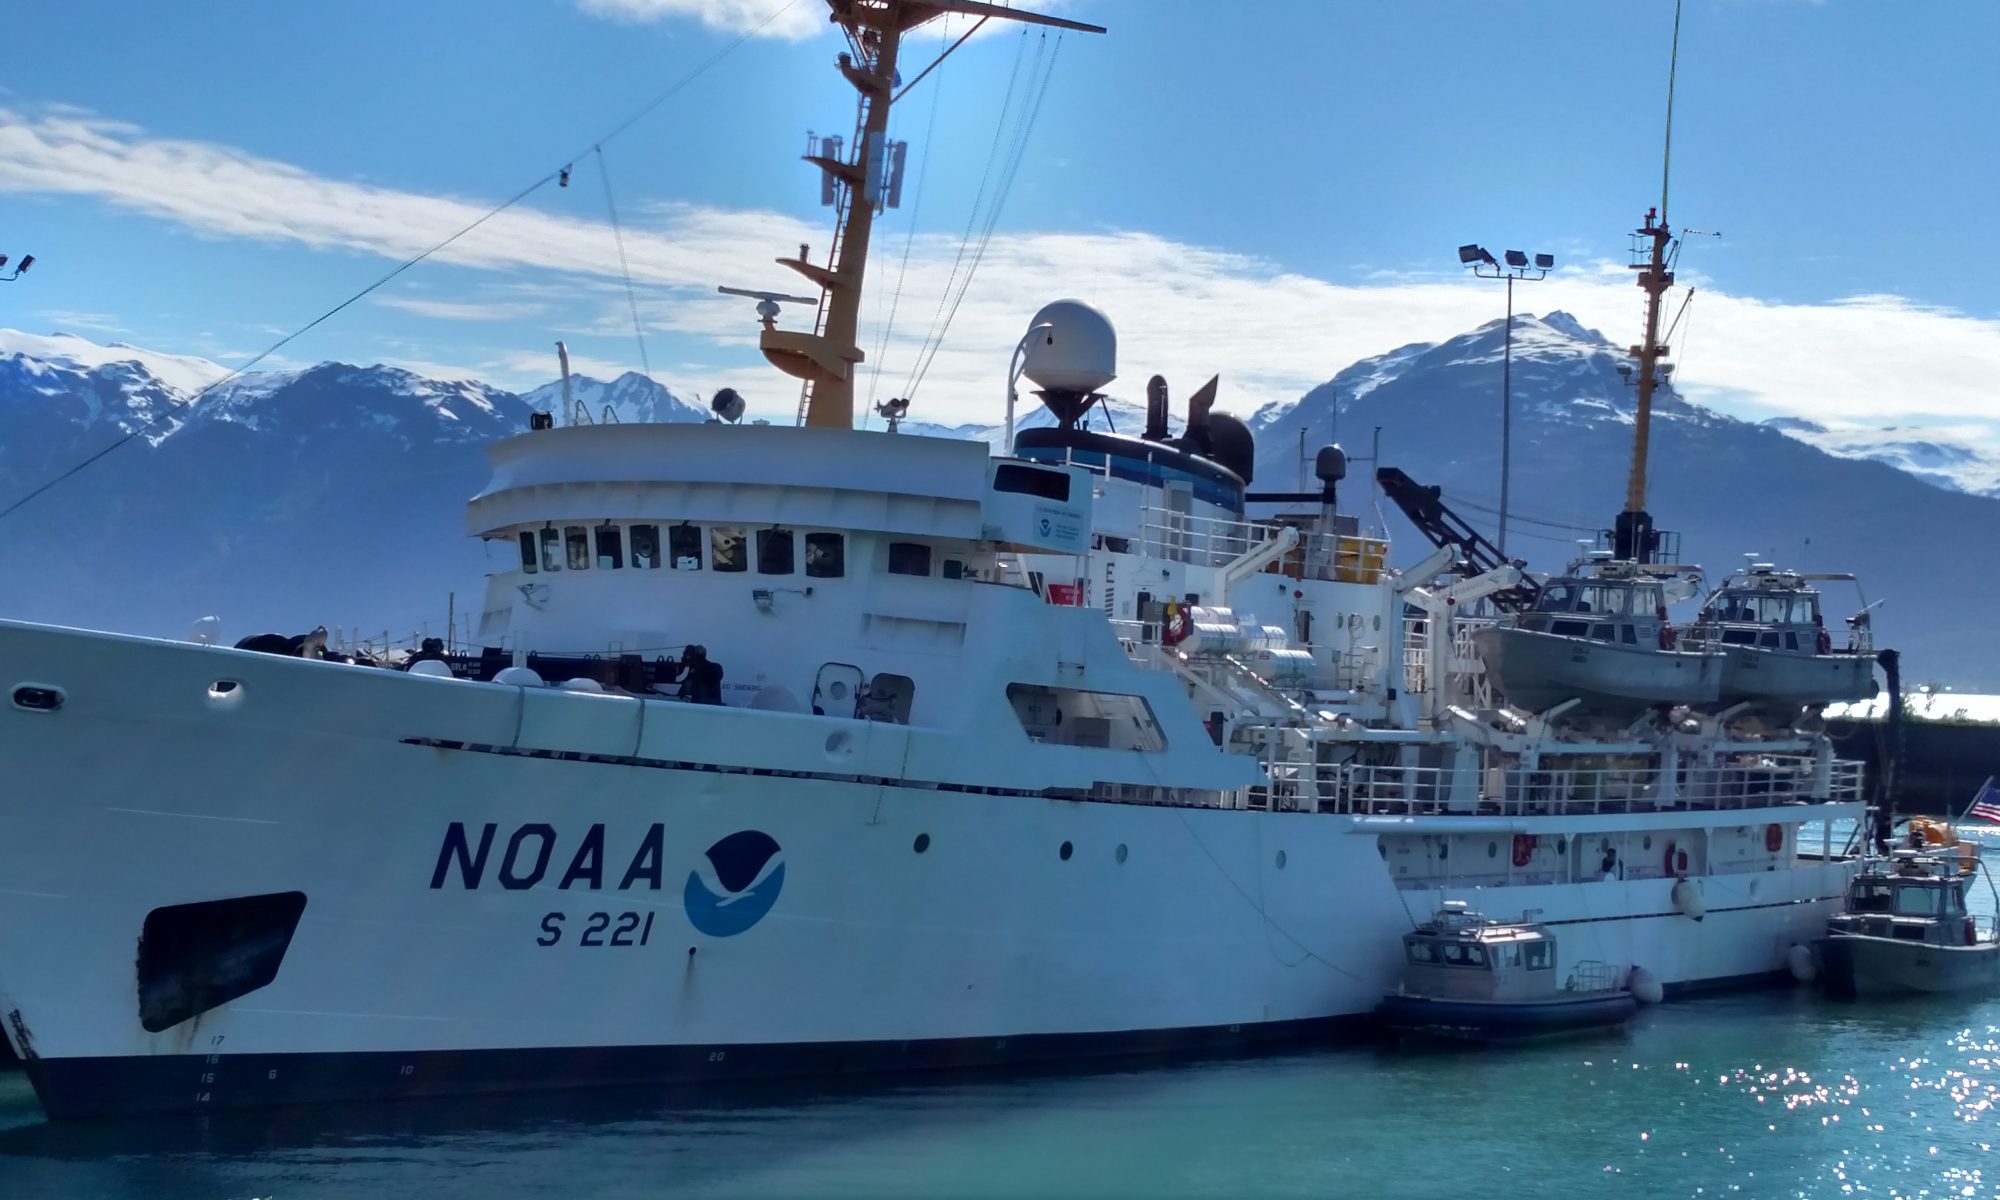
Onboard NOAA Ship Rainier
June 1-12, 2009 

Mission: Hydrographic survey
Geographical area of cruise: Trocadero Bay, Alaska; 55°20.990’ N, 33°00.677’ W
Date: June 8, 2009

Weather Data from the Bridge 
Temperature: Dry Bulb:  13.9°C (57°F); Wet Bulb: 12.2C (54°F)
Cloudcover: Overcast 8/8
Wave Height: 0-1
Visibility: 10 nautical miles
Wind: 325, 4 kts.
Sea Wave Height: 0-1
Sea water temperature: 12.2°C (54°F)

Tide Gauge
Tide Gauge

Science and Technology Log 

Before I explain the science we did today, I will answer the question posed on log number 3: What is a patch test and why is it run? A patch test is used to find offsets in sonar setup (continuous errors) and timing errors. It is done whenever physical alterations occur with the sonar. Such problems can occur when it is mounted skewed, or not in perfect line with the ship.

 Staff positioned in the water
Staff positioned in the water

The Patch Test checks pitch, roll, and yaw. The ship is run out from the shore and back into shore, along the same line. The computer has all offsets set to zero. A swath is sliced at the edge so the computer is looking at the outer beams from the side. With a roll offset it must be changed from an X pattern to a single, flat line. With a pitch offset, a nadir view is taken, the angle is adjusted until the two lines (one out from shore, one into shore) form a single straight line.  Yaw also has two lines offset so they must be combined to one line configured identical to the two lines. The Patch Test takes approximately one to two hours to complete.

Susan with level rod

Today I was involved in obtaining data relevant to tides. We used a tide gauge, levels, GPS, and a staff placed in the water, with a nitrogen being pumped under it. The tide gauge measures the unit of pressure it takes for a nitrogen bubble to be squeezed out. The greater the amount of water covering it the greater pressure is required to release a bubble. To get water depth, someone reads the staff water level and continually records this information for three hours. This will enable us to know the difference in the pressure gauge readings and the staff water level. A Global Positioning System (GPS) is used to determine where the staff is by getting a good constellation (satellites in orbit) reading.

Benchmark set in concrete

It was my job to hold a level rod on the primary benchmark location while someone else recorded measurements using the surveyor’s level (The level rod is measured in centimeters). The surveyor’s level has three lines, or stadia, inside the level. These lines are read as upper, middle, and lower. I placed a smaller bubble level against the rod to make sure it was straight up and down. Once my location was recorded a second person, also holding a level rod, placed hers on a staff (a triangular wood structure) set in the water. The surveyor’s level was disturbed, then a second reading was taken at the staff, and a second reading was taken at my benchmark. If the numbers did not match within a certain range, or historical data, the measurements had to be repeated.


Rainier pulling into dry dock

We went through this process for five benchmarks. These benchmarks were placed in specific locations based on elevation and stability of the ground above high tide level.  This procedure is completed to ensure the benchmarks and the staff have not been moved, by either human disturbance or a natural occurrence, such as an earthquake. As a side note, in some locations these benchmark rods have had to be drilled down 125 feet. In the Arctic they may be drilled 25 feet into the permafrost. When drilling the holes for the benchmarks care must be given to ensure the surface is smooth, not skewed, or at an unusual angle.

Sometimes a temporary benchmark, called a turtle, must be used. This is a small, heavy, circular piece of equipment, which can be placed anywhere solid. The person holding the staff can turn all the way around it to allow for different measurements. All data collected in this activity are sent to NOAA’s tides office. 

Personal Log 

After viewing the ship’s photography server I have become interested in what actually goes on in the dry dock. The dry dock is in Seattle where the ship goes for repairs, restoration, and refitting. After the launches and other things are removed from the ship it goes to the dry dock. Gates close off the ends. On the floor of the dock are blocks for the ships hull to sit on, placed exactly in line for this particular ship. Divers go down to check for precise placement before the water is drained. The ship is tied to the dock to stabilize it (prevent it from tilting or falling off the blocks) and if you are not off the ship before it goes into dry dock you are not getting off anytime soon! On the hull are numbers used to identify the ship’s sections. When it is being retrofitted the workers must know where each section came from so the ship can be put back together correctly.

Rainier pulling into dry dock
Night welding goes on very late
Compare the truck size to the ship
Tape where the symbol and number were painted
Underside of ship on the blocks; the black hole is on for anchor storage
Water filled dock so ship can depart

Dry dock operations can take from two months to over a year, depending on the work needing to be done. Crew stays on board as long as possible. When berths are being refurbished they stay in local hotels. Other personnel either work on other NOAA ships or go to other project sites. (All dry dock photographs courtesy of Rainier picture server)

For more information visit these sites:

http://www.osha.gov/SLTC/shipbuildingrepair/drydocking.html http://en.wikipedia.org/wiki/Dry_dock (has history of ancient dry docks) 
Susan Smith, June 7, 2009

NOAA Teacher at Sea
Susan Smith
Onboard NOAA Ship Rainier
June 1-12, 2009 

Mission: Hydrographic survey
Geographical area of cruise: Trocadero Bay, Alaska; 55°20.990’ N, 33°00.677’ W
Date: June 7, 2009

Sending the CTD to the bottom

Weather Data from the Bridge 
Temperature: Dry Bulb 12.8° C (55°F)
Wet Bulb 11.7°C (53°F)
Cloudcover: Overcast 8/8
Visibility: 4 nautical miles
Wind: VRB, light speed
Sea Wave Height: 0-1
Sea water temperature: 9.4°C (49°F)

Science and Technology Log 

Today we left Craig to finish our grids in Trocadero Bay, Alaska. It was a time to clean up or capture data from isolated locations which had either been missed or not completely surveyed. For the first few hours we spent our time surveying areas very close to the shoreline and areas very difficult in which to maneuver.

Bringing the CTD back up

We did our first cast with the CTD (Conductivity, Temperature, Depth) equipment and I finally asked if I could run it. Ian, the survey technician, happily obliged. The CTD calculates speed of sound through water. I have finally gotten the gist of sonar settings. The following information will help you understand why it is all necessary for getting accurate data to the surveyor and coxswain. 

Range- How long it takes for the sonar beam to go to the bottom and return, or in layman’s terms, tells the sonar when to ping and listen.

Pulse length– Pulse length sets how long the sonar transmits, thus allowing more power to be put out bythe sonar, but it results in decreased resolution. The longer the length of the pulse the lower the resolution, so shorter is optimal. For instance, when going through kelp it should be set at low so the kelp isn’t all being picked up by the sonar beam.

I really enjoyed driving the launch today.

Sonar Beams- There are 512 beams at high frequency (400khz). Low frequency (200 khz) equals 256 beams.  There are two yellow gates on the screen which  surveyors utilize. One is positioned above the shallow water, one is positioned beneath the deepest water measurement. When in shallow water most surveyors disable them. When in deep water, if the top gate is positioned too low, you lose valuable data on the outer limits. If the lower gate is positioned too low it records too much noise. However, if it is set too high the outer beams are missing and no data is recorded. Surveyors must constantly watch this screen when these gates are active to ensure all data they want is being captured.

The airplane indicates the launch position and the color is the area which has been logged.

The surveyor must ensure the data is placed in appropriate folders, enter data in spreadsheets, and basically keep things running smoothly for the entire time data is being logged. So, in essence the surveyor must watch the sonar screen, set the polygons on the screen for him/herself and the coxswain, continually check the settings, remember to log on for data retrieval  and log off when the swath is completed, set the CTD for casts every four hours, and monitor as many as ten folders at one time.

The rule of safety: Never shall safety for life or property be compromised for data acquisition.

The coxswain’s job is to drive the launch into areas to be charted, based on the POD, the Plan of the Day, grids. When data is being recorded he/she drives approximately four to eight knots, depending on the wave action. High swells require slower forward progress. The coxswain has two computer screens-one showing the grid being logged or charted, and another displays depth of water in feet, meters, and fathoms and several other pertinent pieces of data. He or she is ultimately responsible for making decisions about when to enter dicey locations and determining when to stay out of a risky situation.

Seals swimming in kelp

When traveling in either extremely shallow water or water full of kelp and known rocky locations, a bow watch will stand on the bow and give visuals for the coxswain to avoid. Obviously, this person must wear a safety jacket and hold a rope around an arm or wrist, due to the precarious position he or she is in. High swells could cause serious accidents in a second.

Did you know when backing up a launch, sonar cannot penetrate the bubbles formed when the water is getting stirred? The readings inside the launch show the color red, or dangerous zones, because the sonar thinks the boat is at the bottom. As the surveyors and coxswains say, “No worries! We know where we are.”

Question of the day: What is a patch test and why is it run?

Humpback whale photo courtesy of Ian Colvert

Personal Log

Now that I felt much more comfortable with understanding the sonar I was able to relax more on the launch today. Perfect timing, as this was such a great day for biological observations. Five different humpback whales were sighted in the bay with us; in one location two were in position as forward observers on either side of our launch. The last whale we spotted surfaced fairly close to our launch so we had to stop, mainly because the regulations state you must stay 100 yards from humpback whales. This whale went under the launch and surfaced about 50 meters from us. Off and on during the day they would surface in the areas we were surveying so we had to just wait until they moved along.

I also observed at least eight bald eagles either sitting in trees, flying over the water, or harassing the whales. One eagle flew down close to the water and looked as though it was taunting the whale! Then it quickly flew back up to a tree top and perched on a branch. Several eagles would fly off together, separate, then come back together before landing on a tree. Early in the morning we ran into a group of seals swimming around in kelp. They poked their heads out and just stared at us as we drove by. Luckily we saw them in time to slow down, so as to not disturb them anymore than necessary. 

Patricia Donahue, August 21, 2008

NOAA Teacher at Sea
Patricia Donahue
Onboard NOAA Ship Rainier 
August 19-23, 2008

Mission: Hydrographic Survey of Bear Cove, AK
Geographical Area: Kachemak Bay, Alaska, 59.43.7 N, 151.02.9 W
Date
: August 21, 2008

Weather Data from the Bridge at 1000 hours 
Broken clouds (7/8)
Visibility 11 to 27 nautical miles
Winds calm
Seas 0-1 ft (light breeze) at 9.4˚C
Air pressure 1001.5 millibars and rising slightly
Dry Bulb 12.2˚C, Wet Bulb 11.1˚C
Cumulus clouds between 3000 and 5000 feet

The lines circled in red are the track that the boat follows back and forth in order scan the bottom of the sea. It’s a lot like mowing a lawn!
The track that the boat follows back and forth in order scan the bottom of the sea. It’s a lot like mowing a lawn!

Science and Technology Log 

We are anchored in Halibut Cove near a large lagoon too shallow even for the small boats to enter. The nearby mountains have attracted my attention. According to the chart for this area, the two seen off the bow are both 3600 feet high. They have some patches of snow on them. A taller mountain, 4200 feet high, is barely visible in the distance. Nearer the shore some cliffs show evidence of an interesting geological history. Once upon a time, marine sediments collected at the bottom of the sea. The layers built steadily one atop the other, creating organic and clastic sedimentary rocks. The rocks were uplifted to nearly vertical and have eroded. The lighter colored section appears to be limestone but it’s difficult to tell from afar. Due to intense tectonic activity in the area, some of the rock was heated and crushed, causing metamorphism. The section next to what I think is limestone looks to be either a metamorphosed limestone or a batholith. I’m hopeful that someone on board knows more geology than I do!

One of these scans shows a school of fish and the other shows a mound on the sea floor.  Can you guess which is which? (Answer: the scan on the left is a mound on the sea floor and the scan on the right is a school of fish.)
One of these scans shows a school of fish and the other shows a mound on the sea floor. Can you guess which is which?

Today I went out on one of the small vessels conducting single beam sonar scanning to determine the depth and shape of the bay bottom. The boat moves across the surface of the sea in straight, parallel lines much like the ones made when cutting the grass with a lawn mower. The lines in the first picture are the rows that the boat “mows.” The sonar pings go down from the bottom of the boat at a rate of 100 per second! The equipment on board measures how much time passes until the ping returns from the bottom. The longer it takes for the sound signal to bounce back, the deeper the water is in that location. The boat also has another scanner similar to what fishermen use to find schools of fish. Look at these two photographs from the scanner. Which is a school of fish and which is a 27 foot high mound on the ocean floor? The depth of the water is in large numbers in the lower left. The numbers farthest to the right are the ocean temperatures. Why is the water colder where the bottom is deeper?

This is a sea otter feasting on a clam! The tiny white spec on its belly is the clam

Personal Log 

The screen above with the “mowing the lawn” lines on it clearly shows an airplane making its way back and forth. Of course I had to ask, “Why an airplane icon”? I thought they’d tell me that it was for laughs but no, there is a good reason. The airplane icon’s nose keeps in sync with the GPS and the lines better than the ship icon! The surveyors find it easier to know their position.

Animals Seen Today 

  • Many sea otters – Look closely at the picture to the left. The otter in the picture is eating clam. A shell is balanced on its belly!
  • Schools of fish under the boat “seen” by the radar
  • Several types of birds too far away to identify

Vocabulary of the Day 

While inputting the weather this morning, I noticed several screens that we did not add data to and rather than skip them, I decided to see what they were about. They were about ice conditions that a ship might encounter and include in a weather report. Here are two new words I didn’t have for ice. A bergy bit is a large piece of floating glacier ice between 100 and 300 square meters in area and showing less than 5 meters but more than 1 meter above sea level. A growler is smaller than a bergy bit. It is larger than 20 square meters in area but less than 1 meter is above the sea surface. Growlers can be transparent, green, or even black in appearance. Since its summer in Alaska, I won’t be seeing any bergy bits or growlers! I also learned that the term iceberg has a precise definition. An iceberg is a piece of ice afloat or aground that shows more than 5 meters above the sea surface. They are described more specifically by their shape.

Challenge Yourself 

Kachemak Bay receives a lot of glacial melt water. Surveyors have a difficult time with the radar equipment when they encounter freshwater because the sound waves travel at a different speed through fresh water than they do through salt water. In which type of water, salt or fresh, does sound travel faster? Why?

Patricia Donahue, August 19, 2008

NOAA Teacher at Sea
Patricia Donahue
Onboard NOAA Ship Rainier 
August 19-23, 2008

Mission: Hydrographic Survey of Bear Cove, AK
Geographical Area: Kachemak Bay, Alaska, 59.43.7 N, 151.02.9 W
Date
: August 19, 2008

Weather Data from the Bridge at 1600 hours 
Broken clouds (5/8)
Visibility 11 to 27 nautical miles
Winds 230˚ at 6 knots
Seas 0-1 ft (light breeze) at 8.3˚C
Air pressure 1003.5 millibars and falling slightly
Dry Bulb 13.1˚C, Wet Bulb 12˚C
Cumulus and cirrus clouds between 2000 and 3300 feet

Science and Technology Log 

Today I recorded the temperature twice, once in the morning and once in the afternoon. The data is written on a sheet and then entered into a specialized computer program. Once saved, the floppy containing the data is placed in a transmitter for delivery via satellite to the National Weather Service. There are few weather stations in the area so the ship is acting as one! The information will then show up on maps as a station model such as the one shown above. My students learn how to code and decode these models and it was awesome to see where the data comes from and how it is delivered.

This is a weather map symbol that shows wind direction (the arm extending from the circle) from the southwest; wind speed (the smaller arm) at 6 knots; temperature at 13.1˚C; dew point and 12˚C; pressure at 1003.5 mb; and cloud cover which is indicated by the shaded circle and shows broken clouds, meaning partly cloudy.

Yesterday and today I also made note of true north and magnetic north. The difference between them was 17 degrees yesterday and 16 degrees today. In Texas a few weeks ago this difference was about 12 degrees. The officer on the bridge told me that there is a lot of interference that accounts for the larger difference here. I was reminded of what I’ve recently learned about the polarity reversals the Earth has undergone throughout its history. According to scientists, the planet is entering a period in which true north and magnetic north will deviate more and more from one another. I read a book I found in the wardroom about the geology of Alaska and discovered that the area we’re in now is mainly sedimentary rock. Through the “big eyes” on the flying bridge I can see a lot of stratification in the rocks. 

NOAA Ship Rainier
NOAA Ship Rainier

One of the engineers showed me the engine room. I was able to see the freshwater generator system that makes potable water for the ship. Salt water is “flashed” to its boiling point but not 100 degrees Celsius! This evaporation is done at a very low pressure by creating a vacuum of more than 90% so the boiling point of the water is much lower. This saves energy. The water evaporates, leaving behind the salts and other minerals dissolved in it. The water vapor is condensed and stored in a tank for use by the crew. One of the evaporators can make about 130 gallons of water in an hour and the ship has two of them. (If the water intake is not as salty, such as where we are now due to the glacial melt water, then more water can be generated.) There are also two storage tanks, each holding 8,400 gallons for a total of nearly 17,000 gallons.

The ship uses between 2000 and 3000 gallons per day so the amount stored could last for 5 days if necessary. There are only 53 people aboard. I did the math and realized that the crew is using a lot less water than I thought. Generally, an estimate of water use is 150 gallons per person per day. Not only is the crew careful about water use, some salt water replaces freshwater. For example, the toilets use salt water. Another interesting thing about the evaporators is that they use titanium plates. Titanium is very, very expensive! Back home people are stealing catalytic converters out of cars to recover the titanium in them! Since I teach the gas laws, distillation, and the periodic table, I plan to include a lesson about the evaporators.

Personal Log 

Today’s big events were a fire drill and an abandon ship drill. Fortunately I’ve gotten to know the ship fairly well and I was able to get to my assigned muster station in a timely fashion. The newly arrived personnel, myself included, also watched survival videos. Extra survival equipment had to be put away and I volunteered to help. I was able to climb down through hatches into the area where dry goods are stored. I wonder if they’ll let me climb the mast? My fears about seasickness have not been realized due to the fact that we are in very calm water. The bay seems more like a lake! From the ship I can see the Dixon Glacier and the Portlock Glacier. I’m sure they are a lot farther away than they appear! The survey team that went out today reported difficulties in the areas where the glacial runoff enters the bay. I hope I get to go out tomorrow.

Animals Seen Today 

Bald Eagle, Otter

Question of the Day 

How much fresh water is each person aboard the Rainier using in one day?

Challenge Yourself 

Use the internet to find out how many people are aboard a large cruise ship or a large naval vessel. Calculate how many gallons of water they would use. How many freshwater generators would the ship need? How much water would the cruise ship have to store to last for 5 days? Using the station model above, can you determine the relative humidity?