NOAA Teacher at Sea Alexandra Keenan Onboard NOAA Ship Henry B. Bigelow June 18 – June 29, 2012
Mission: Cetacean Biology Geographical area of the cruise: Gulf of Maine
Date: June 23, 2012
Weather Data from the Bridge: Air temperature: 14.4° C
Sea temperature: 13.3° C
Wind speed: 10.5 knots
Wind direction: from the SW
Science and Technology Log:
Whales are social creatures with a remarkable ability to communicate with one another over long distances using sounds. Male humpback whales, for example, can sing for days on end over mating grounds to attract the ladies, or over feeding grounds such as the ones on Georges Bank (where we are!) The acoustic behavior of sperm whales may even provide for distinct cultures within the species.
Given these vocalizations, it is possible to monitor the distribution and behavior of acoustically active marine animals using special recording units called “marine autonomous recording units” (MARUs). For the past few days, we have been zig-zagging and loopty-looping around Georges Bank to retrieve several of these MARUs (track our ship’s course here).
MARUs are little buoys designed to sit on the ocean floor and record all sounds within a certain range of frequencies. The MARUs we retrieved during this cruise have been on Georges Bank since the March cruise on the Delaware II (see Chief Scientist Allison Henry’s blog post).
To retrieve a buoy:
1. An acoustic signal (a sound) is sent out from a speaker lowered into the water that basically says to the buoy, “Hello! Are you there?” Listen: Signal used to contact buoy
Bioacoustician Denise Risch sends a signal to the MARU.
2. The buoy can then respond with another acoustic signal, “Yup!”
Research analyst Genevieve Davis and intern Julia Luthringer listen for a response from the MARU.
3. Upon hearing confirmation that the buoy is indeed in the area, the bioacoustician can send another signal to the buoy telling it to burn the wire anchoring it to the sandbags on the ocean floor.
4. The buoy is free! It floats to the sea surface and is retrieved from the side of the ship.
Denise Risch, Genevieve Davis, and Julia Luthringer wait for the ship to approach the MARU (small yellow dot in ocean).
5. Data is retrieved from flash memory on the buoy for further analysis.
MARU ready for data retrieval.
What will these MARUs be able to tell bioacousticians (scientists that study sounds produced by living organisms)?
Lots! Using passive acoustic monitoring (recording the sounds that marine mammals make), scientists can study the distribution of acoustically active mammals and can couple distribution data with environmental measurements of the area to identify relationships between conditions on the ocean and acoustic activity. Scientists can also distinguish whale species based on their sounds, so certain species of whale can be monitored.
Physics break: Why do you think whales have evolved to use sound rather than sight or smell to communicate underwater?
Personal Log:
I have been amazed by the amount of maintenance being done while we are underway. Even with a relatively new ship like the Bigelow, there is always something to be done, whether it be grinding away at the deck for subsequent repainting or fixing a malfunctioning pump.
Deck crew member Tony repaints the deck after grinding off the old paint while we are underway.
We spend most of our days out on the fly bridge watching for whales, and mostly we see whales.
Equipment used for watching for whales from the flybridge.
However, once in a while a shark, turtle, or mola mola floats by. I really get a kick out of the mola molas. They look like they could be the subject of a Pokemon trading card– a big flat fish head with fins sticking out. They eat jelly fish and have few natural predators. Adults weigh an average of 2200 lbs!
The other-worldly mola mola.
A short video of one in action below:
Finally, I wanted to introduce everyone on the science team for this cruise:
From left to right: Me, Scientist Pete Duley, Bioacoustician Denise Risch, Chief Scientist Allison Henry, Scientist Jen Gatzke, Research Analyst Genevieve Davis, and Intern Julia Luthringer (photo courtesy CO Zegowitz)
NOAA Teacher at Sea
Lindsay Knippenberg
Aboard NOAA Ship Oscar Dyson
September 4 – 16, 2011
Mission: Bering-Aleutian Salmon International Survey (BASIS) Geographical Area: Bering Sea Date: September 13, 2011
Weather Data from the Bridge Latitude: 56.91 N Longitude: -169.08 W Wind Speed: 10.07 kts Wave Height: 4 – 6 ft Surface Water Temperature: 6.5 C Air Temperature: 7.5 C
Science and Technology Log
The Oscar Dyson uses several different types of sonar to get the best image of what is beneath the ship.
Today I learned about acoustics with Paul. The Oscar Dyson is one of NOAA’s newer ships and has a hull-mounted sonar system which uses sound waves to “see” what is underneath the ship. The Oscar Dyson was also built to have a low acoustic signature and be “quiet” in the water. This is helpful to the scientists using acoustics to study fish onboard the Dyson because the fish don’t hear the ship and swim away. On our cruise the acoustics data is used to get a picture of where there is life in the entire water column. For the most part we have just been trawling on the surface, but the ocean is much deeper and there could be a lot more life underneath our nets that we will never catch. If we get very few fish in our nets, it could mean that the fish are just at a deeper depth and not that there are not any fish in that area. Since the scientists are getting a better picture of what is really going in that ecosystem, they can make more accurate stock assessments. All throughout the cruise I have been curious about the images displayed on the screens in the acoustics room and on the bridge. Today I would finally learn what they were all about.
Since the sonar is attached to the bottom of the boat, the top 14 meters aren't seen in the images. To solve that problem, a sonar transducer is lowered over the side to get the top 14 meters when we at station.
Basically how acoustics work is that a sound or ping is sent from the ship and it travels through the water. When it hits something in the water column or the bottom of the ocean it bounces back and the ship’s echosounder records the length of time that it took for the sound wave to travel there and back. Depending on the temperature and depth of the water, the pings are sent at different time intervals and pulses. The pings can also be sent at different frequencies to “see” different types of organisms. For instance zooplankton can be viewed best at one frequency and jellyfish can be viewed best at another frequency. As the sound waves are returning to the vessel, the computer translates the returning sound waves into images for the scientists to analyze.
A sonar image at dawn. The dark red line at the bottom of the screen is the ocean floor. Notice all the greens and blues at the top of the water column. Those are pollock.
On our cruise Paul is comparing the sonar signatures produced by the different organisms under the boat to what we are actually catching in the nets. The use of acoustics technologies for stock assessments is fairly new and individual species can’t be recognized by the sonar images, but Paul can use the images to detect if an area will have a greater density of organisms. We are also selecting several locations between stations to do mid-water trawls. Paul selects areas that have a high density of organisms underneath the depth that our surface trawl nets reach and we do a mid-water trawl. He then compares what we find in the trawl to the sonar signatures that he saw in the images to see if he can find any patterns between specific species and sonar signatures. It will be amazing if some day fisheries biologists will be able to assess the stock of fisheries by using sonar instead of net trawls which are a lot more work and often result in the death of the fish.
Personal Log
Today's weather after the two low pressure systems had entered the area. The weather was pretty crappy the last two days, but today it is beautiful.
We have had several lo- pressure systems blow through during our cruise and so far we have had two gale warnings. The first one occurred when we had only been out to sea for a day so it was easy to head back in to Dutch Harbor. The last one occurred a couple of days ago and we were too far out into the Bering Sea to turn back. We had no choice but to ride it out. Two low-pressure systems were colliding and the Bering Sea turned into a washing machine. There were consistent 10 – 13 ft waves coming from one direction, large 20ft swells coming from another direction, and the occasional 8 – 10 ft wave coming from a different direction. The ship just kind of bobbed from side to side and up and down and we were all along for the ride. Thank goodness I didn’t get sick, but I definitely didn’t sleep well.
Face to face with some angry seas.
I was also amused by how life went on for everyone onboard the ship. Dinner was hilarious as everyone held onto their dishes and your chair moved from side to side with the waves. Walking around was pretty funny too. There was no way that you could walk in a straight line. I would choose something to grab onto, walk another couple of steps, and then grab onto something else. As I tried to sleep at night I could hear the things that we had thought we had secured roll around the room. Who knew that a roll of paper towels could make so much noise? The curtain on my bed was making me crack up because it would roll open with one wave and close shut with another. It just kept opening and closing all night and there was nothing that I could do about it but laugh. Thankfully by today the seas had calmed down significantly and the sun is actually out.
Francesco was a lost shorebird who found his way to our ship in the middle of the Bering Sea.
There was one casualty though, and that was Francesco. Francesco was a shorebird, an American Pipit, that was blown way off course during the storm. He ended up cold and hungry on our back deck last night. We were able to catch him and we put him in a warm box with some dead flies, water, and crackers. He managed to eat and drink, but he was a juvenile and had very little body fat. He was pretty much skin and bones. He lasted until this afternoon and when we went to check on him, he was dead. We gave him a burial at sea and were reminded that the Bering Sea is a harsh, harsh environment.
NOAA TEACHER AT SEA CATHRINE PRENOT FOX ONBOARD NOAA SHIP OSCAR DYSON JULY 24 – AUGUST 14, 2011
Mission: Walleye Pollock Survey
Location: Kodiak, Alaska
Date: August 11, 2011
Weather Data from the Bridge
Latitude: 57deg 22.630N, Longitude: 152.02° W
Air Temperature: 13.6° C
Water temperature: 9.0° C
Wind Speed/Direction: 12kn/240°
Barometric Pressure: 1020.1
Partly cloudy (5%) and sun
Science Log:
Stern of the Oscar Dyson
Somewhere back in my family history there must have been a fishmonger, because I’ve been channeling something or someone. The entire process of watching the acoustic footprint of the ocean under the ship, deciding where to physically sample (trawl) populations, and then seeing and processing the fish that live 100 meters or more below us? Fascinating. Add to this camera drops to get snapshots of the ocean floor (more amazing footage this morning), and interesting ‘Methot’ plankton tows to sample what is available for the fish to eat and give a more accurate and complete picture? How many adjectives can I use?
Before we dive too far into the depths, let me explain/refresh what plankton are. Plankton are any drifting organisms that inhabit the water columns of bodies of water. In fact, their name derives from the Greek for “wanderer,” and it would be helpful if you thought of them as drifters in the current…from deep in the ocean to up on the surface. They are generally broken down into plant-like-photosynthesizing plankton (phytoplankton) and animal-like plankton (zooplankton).
Phytoplankton are “photosynthesizing microscopic organisms that inhabit the upper sunlit layer of almost alloceans and bodies of water” (wikipedia). If you have taken biology or forensics with me, I have described some of them ad nauseam: diatoms? Those organisms that are in every body of water on the planet? Ah, yes. I can see it all coming back to you.
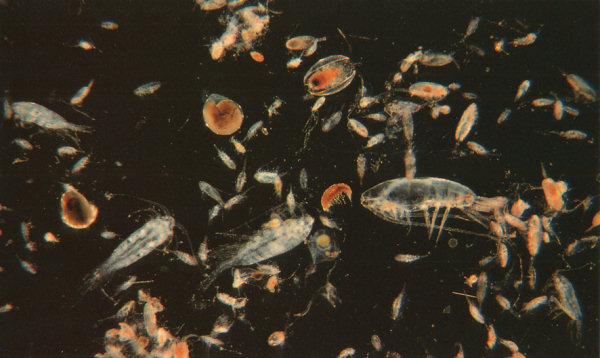
Zooplankton encompass a diverse range of macro and microscopic animals. They generally eat the phytoplankton or one another. Examples include krill, copepods, jellyfish, and amphipods.
In the great food web of life, other organisms eat the zooplankton. Among them was a pod of 50+ Humpback whales in the Barnabas Trough off of Kodiak Island. They were exciting enough that I went from being sound asleep to dressed and on the bridge in less than five minutes. Issue 12, Humpback Whales: Better than any alarm clock I have ever known delves into these organisms (Cartoon citations 1, 2, 3 and 4).
Our chief survey technician, Kathy Hough, took a lot of photos the following day as we traveled from Barnabas Trough to Alitak Bay. The three photos that follow and descriptions are courtesy of Kathy.
Adventures in a Blue World, Issue 12
Whale tail: Individual humpback whales can be identified by the black/white pattern on the ventral side of the fluke (tail). The pattern is like a human’s fingerprint, unique to one animal.There is evidence of three whales in the photo above: the closest whale’s rostrum (blow hole) is visible. The second whale is diving and you can see the peduncle (the stocky part of the tail before the fluke). The glassy area in the back of the photo is evidence of a recent dive and is called a “footprint.”This Humpback was last seen in this area in 2004, and has not been seen since. The white marks on its fluke are from a killer whale attack! Kathy emailled photos of the whales to observers, and they were able to identify individuals!All hands on deck… 100+ Humpback Whales. Darin and Staci.
Our team of scientists sample plankton using a Methot net, which is fine mesh and captures macroscopic organisms. We sample plankton for the same reason that we physically trawl for fish: we need to make certain what we are “hearing” is what is down there, with a focus on the types and sizes of the plankton. Additionally, knowledge about what and where plankton populations are will help with modeling the entire ecosystem. If you know where the food lives, its abundance and composition, by extension you have a much greater understanding of the predators, both pollock and whale.
(If you get a chance, check out this video about how whales hunt with bubble nets; fascinating!)
Personal Log
Bowditch
I try to spend time on the bridge every morning before breakfast. I bring up a cup of tea and watch the horizon lighten until the sun pushes its way up above the lingering clouds. This morning, I saw the green flash for the first time. The green flash is not a superhero. It is not a myth. It is not a sailor’s fish tail. It is real. Furthermore, if you still don’t believe me, the green flash is in the “bible” of maritime studies, The American Practical Navigator (Bowditch, if you are on a first name basis). I was told by Ensign David Rodziewiczthat “if it is in Bowditch, it must be true.” So there.
The green flash appears on the horizon just after the sun sets or just before it rises. For one moment on that spot the sky looks as if someone broke a green glow stick and smeared a distant florescent mark. As fast as it was there, it is gone. The name is appropriate: green flash. It occurs because light is bent slightly as it passes through the atmosphere (refraction); this bending is greatest on the horizon. Since light is made up of different colors with different wavelengths, the bending causes the colors to be seen separately. Bowditch says it is like offset color printing (nice metaphor, eh?). The red end of the spectrum is first to rise. The blue end of the spectrum is scattered the most by the atmosphere, leaving behind the momentary and memorable second of green.
Evidently, to see the green flash is considered very good luck. I already feel very lucky. I am in one of the most beautiful places in the world, on a ship with interesting and intelligent people, driving around the Gulf of Alaska learning about science and occasionally checking out whales. If I can get luckier than this… well… wow.
Tomorrow is the last day of our cruise, but I have a few more cartoons up my sleeves, so keep checking back. In the meantime, thank you to the incredible staff of the Oscar Dyson, the scientists of MACE, my rockin’ cohort Staci, and the NOAA Teacher at Sea program.
Until our next adventure,
Cat
p.s. Whales have the worst morning breath I have ever smelled. I know it isn’t really their fault–imagine having 270-400 baleen sheets on either side of your mouth that you could get krill stuck in…
NOAA Teacher at Sea
Caitlin Thompson Aboard NOAA Ship Bell M. Shimada August 1 — 14, 2011
Mission: Pacific Hake Survey Geographical Area: Pacific Ocean off the Oregon and Washington Coasts Date: August 7, 2011
Weather Data from the Bridge Lat. 47 degrees, 00.8N
Long. 124 degrees, 29.8W
Present weather: Cldy 8/8
Visibility: 10 n.m.
Wind direction: 323
Wind speed: 08 kts
Sea wave height: 1 feet
Swell waves – direction: —
Swell waves – height: —
Sea water temperature: 13.7 degrees C
Sea level pressure: 1018.8 mb
Temperature – dry bulb: 15.8 degrees C
Temperature – wet bulb: 14.7 degrees C
Science and Technology Log
On the fish deck in my work clothes
The Shimada conducts research around the clock, with crew members working twelve-hour shifts. So far, I have worked with the acoustics team studying hake during the day, when the hake school together and are easy to fish. Last night I branched out, staying up with Steve Pierce, the oceanographer studying ocean currents, Jennifer Fisher, a faculty assistant at Oregon State University (OSU) who is studying zooplankton, and her intern, Angie Johnson, a graduate student at OSU. All the different research on this trip complements each other, and I learned more about the acoustic team’s work from the night people.
Gray's Harbor Transects
The map at right shows the transects we follow and the stations that the night team takes samples, which Steve chooses. Just like the acoustics team, he only chooses sites on the east-west transects. The night team usually works one transect ahead of the day team, and must have the ship back where they started by sun-up. Steve is mapping small currents because, he says, surprisingly little is known about ocean currents, even though they have a tremendous impact on ocean life.
He is especially interested in the polar undercurrent that brings nutrient-rich water from the south up along the west coast. A small current, it is nonetheless important because of the nutrients it carries, which come to the surface through upwelling. He uses an acoustic device, the Acoustic Doppler Current Profile (ADCP), to find the velocity of the water at various depths. The data from the ADCP is skewed by many factors, especially the velocity of the ship. Later, Steve will use trigonometry to calculate the true velocity. He also uses the Conductivity, Temperature, Depth (CTD) meter, lowered into the water at every station during the night. The CTD gives much more information than its name would suggest, including salinity, density, and oxygen. It is deployed with a high-speed camera and holds bottles to capture water samples. I was impressed by the amount of work – and math! – that Steve does in between cruises. When he has down time on this cruise, he told me, he is calculating work from two years ago.
Jennifer divides a sample in the Folsom plankton splitter
Jennifer and Angie are studying plankton, the organisms at the very bottom of the food web. Immediately, I recognized euphausiids, or krill, from the contents of hake stomachs. Actually I recognized their small black eyes, which always reminded me of poppy seeds when I saw them in hake stomachs. Jennifer is conducting this work through her group Northwest Fisheries Science Center, which, as she describes it, gives her a wonderful freedom to research different projects related to ocean conditions, especially salmon returns. In this project, they measuring phytoplankton, tiny, photosynthetic organisms, by measuring chlorophyll and nutrients. They are also looking at zooplankton, like euphausiids, salps, and crab larvae, which we examined other the microscope. To help the acoustics team refine their ability to use sonar to identify zooplankton, Jennifer and Angie record certain species. The acoustics team will match up the acoustics data that is continuously generated on this ship with the samples.
Angie takes water samples from the CTD.
Today, the second catch of the day was aborted because of whales too close to the ship. However, the NOAA’s Pacific Marine Environmental Laboratory (PMEL), had asked the Shimada to investigate its waveglider. A waveglider is type of robot called an autonomous underwater vehicle (AUV). Programmed to travel and record data, it does not need an operator. The PMEL folks were concerned, however, that its AUV might have a problem.The bridge set the course for the AUV, described as a yellow surfboard, and I headed up to the flying deck, the highest deck and an ideal spot for observation, to watch for it. Immediately we saw a humpback whale, just starboard of the ship, spout and roll through the water, its tail raised in the air. Soon the AUV appeared. We saw nothing wrong with it but communicated our observations, photographs, and video tape of it to PMEL. The PMEL’s system of wavegliders monitor carbon dioxide levels and use the kinetic energy of ocean waves to recharge the batteries. The acoustics team hopes to get their own waveglider next year to collect acoustic data in between transects. As I was peering over the edge of the boat, examining the surfboard-like robot below, I heard a loud splash. A bout ten Dall’s porpoises were playing around the bow of our boat, rippling in and out of the water. Dall’s porpoises are tremendously playful creatures, and will often play around ships. But our ship was barely moving, and the porpoises soon lost interest and swam away.
Wave Glider, seen from above
Personal Log
I’m getting a little of everything on this cruise. I would have stayed up two nights ago for the deploymentof the CTD and zooplankton samples, but the propeller developed a loud enough whamming sound to suspend all operations indefinitely. I woke up at 4:00 AM yesterday because the boat was swaying back and forth violently. (Violently by my standards, that is; more experienced mariners insist the swell is nothing.) Since our bunks go port to starboard, I could feel my weight sliding from hip to head to hip to head as I was rocked back and forth in bed. Meanwhile a discarded lightbulb in a metal shelf was rolling back and forth steadily – rattle-rattle-WACK! rattle-rattle-WACK! – until Shelby Herber, a student at Western University and my roommate, got up, found the culprit, and wrapped it in a shirt. When I woke again, it was eleven hours after the discovery of the problem with the prop and well past breakfast, and I started to get up until Shelby told me we were off transect, headed to shore because of the propeller.
Wave Glider from beneath the water, taken from PMEL's website
So we took our time getting up. But when I finally arrived in the acoustics lab, Rebecca was running up the hall, saying, “Caitlin, I was looking for you! There’s a great big shark outside, and we’re pulling up the ROV!” The ROV is the remotely controlled vehicle, a robot like the AUV, but one that requires an operator to make it move. Unfortunately, out on the fish deck, the ROV was being put away and the shark gone off on his fishy business. To console me, John had the videotaped footage from the ROV and the dorsal fin of the shark, and showed me both. The ROV revealed no damage and I was invited down to the winch room, where the bang-bang-bang coming from the propeller was unnerving.
Puzzled birds approach the ROV
Everyone was in an uproar trying to decide what to do, an uproar made all the more dramatic by the steady lurching and swaying of the ship, which throughout the day has sent most of the scientists to their room for at least a few hours and most of the deck hands to tell stories of unhappy tourists who couldn’t find their sea legs. Finally, the engine guys decided the warped propeller would not prevent us from getting to Port Angeles, and Rebecca decided it would not interfere with the acoustics, and we got back on transect.
ROV
I’m getting a little bit of everything on this cruise. I’ve seen sharks and marines mammals, calm seas and rockier seas, an impressively well-functioning ship and a number of technological problems. I’ve interviewed scientists, NOAA Corps officers who command the ship, and crew members who recount endless adventures at sea. I’m even signed up for the cribbage tournament, which I’m not entirely thrilled about since I don’t know how to play bridge. I’ve been impressed by how much time and information everyone seems to have for me. I am constantly thinking how I can bring this experience back to my students. Some ideas are to have a science and math career day, collect weather data like the data the bridge collects, dissect hake, and examine zooplankton under a microscope. Various people on board have volunteered to help with all my ideas.
NOAA Teacher at Sea
Caitlin Thompson Aboard NOAA Ship Bell M. Shimada August 1 — 14, 2011
Mission: Pacific Hake Survey Geographical Area: Pacific Ocean off the Oregon and Washington Coasts Date: August 4, 2011
Weather Data from the Bridge Lat. 46 degrees 22.4 N
Long. 124 degrees 41.1
Present weather: cloudy
Visibility: 10 n.m.
Wind direction: 330
Speed 11 kts
Sea wave height: 2-3 feet
Swell waves – direction: 310
Swell waves – height: 3-4 feet
Sea level pressure: 197.3 mb
Temperature – dry bulb: 17.0 degrees C
Temperature – wet bulb: 15.0 degrees C
Science and Technology Log
Me in front of the Shimada.
Yesterday, I saw, sexed, and measured my first hake. And my second hake, and hundredth hake, and two hundredth hake. Most of the time, the scientists on the acoustics team watch computer monitors that show acoustic data as colors to represent life under the ship. Twice today, however, they identified large populations of hake and decided to fish for them in order to get more accurate data.
The pressure housing, held together by electrical tape and sponges, holds the battery and data storage for the light, lasers, and camera attached to the net.
Both times, the ship went into immediate action. Upstairs in the bridge, or command room, the NOAA officers slowed and repositioned the ship. Two scientists watched for marine mammals. If mammals were too close, we would have to abort the operation entirely. On the fish deck, John Pohl, on the acoustics team, taught me to assemble the pressure housing and attach it to the net. Objects attached to the net include the video camera, which will film anything passing by the mouth of the net, a four-beam laser to judge the length of the images that are filmed, a light to illuminate the water, batteries for power, and another camera for storing the data. The crew began lowering the net.
Josh Gunter, survey technician, operates a hatch to let hake onto the flow cale, which will find the mass of the whole haul.
For me, the real excitement began once the fish began pouring onto a conveyor belt into the fish lab. First, we sorted the fish by species. In the first haul, the fish were mostly hake, as intended, but we also caught three yellow-tail rockfish and three eulachons, a type of smelt. In the second haul, there was largely yellow-tail rockfish and hake, with several Pacific Ocean perch and widow rockfish. The rockfish were difficult to sort: they have dangerous spines and fight hard. Alicia Billings, a fisheries biologist on the acoustics team, taught me how to pick them up with one hand over their eyes and the other firmly grasping their tails. Even so, we both had a few close calls. We threw most of the fish right back into the ocean but kept about three hundred hake to sex and scale. With another fifty hake, we put then stomachs in individual bags so that the lab on shore can determine what the hake were eating. We also stored the otolith, or ear bones, in order to determine the age of the hake. Just like the rings of a tree, otoliths show growth rings every year.
In the wet lab, the acoustics team prepares for the next batch of hake. From left Alicia Billings, Steven de Blois, and Dr. Rebecca Thomas
Finally, we cleaned up and settled back in the acoustics lab to watch for the next batch of fish.
The monitors use echosounders, which are exactly how they sound: Signals (sound waves) are emitted from beneath the ship and echo back once they hit something. The computer records the distance of an object by how long it takes for the signal to return. For example, suppose a fish were right at the surface. The signal would hit it and return in very little time.
The monitor shows the depth of the ocean floor, sea surface, and objects in between.
On the other hand, in deep water the signal would take much longer to hit the bottom of the ocean and return. See the thick red line on the graph to the left? That’s the ocean floor. Notice how it curves down on the right at the edge of the continental shelf. The flat line at the top of the graph is the surface of the ocean. The scattered dots in between are most likely fish. The scientists can guess the kind of fish and the number of fish by the pattern and color of dots. All the color below the ocean floor is meaningless noise. Look to the upper left-hand corner of the graph to find the frequency of the signal, measured in kilohertz (KHz). The lower frequencies (20 kHz and 38 kHz) tend to measure larger objects and to go deeper in the water. These frequencies are perfect for finding hake. The higher frequencies (120 kHz and 200 kHz) measure smaller objects. For example, shortly before we started the first haul, we saw a large number of plankton, which showed up bright blue on the 120 kHz and 200 kHz frequencies but barely showed at all on the lower frequencies.
You can follow the progress of the Shimada at shiptracker. We’re headed for Port Angeles on August 14, making East-West transects along the way.
Chief Scientist Larry Hufnagle in the acoustics room
Personal Log
I am so happy to be at sea. The journey was delayed an entire day because of a problem with a valve, and we finally set sail yesterday. The skies are blue and the ocean calm, and I am constantly learning new stuff. I’ve had to learn to lift my feet when stepping through a doorway (I forgot once and went sprawling!) and to memorize the complicated series of halls and ladders to get from the fly deck to the bridge to the mess room to my stateroom. I’ve had to memorize thirty-some names. The scientists have been incredibly patient, explaining each part of their work while I take copious notes. Working in the fish lab is my favorite part so far. It’s fascinating and satisfying work.
I am impressed by the sense of camaraderie on this ship. The scientists on the acoustics team – also known as the hake people – keep up a constant, teasing banter, which only turns serious when discussing science. With science, they all have a different opinions. Before fishing today, Chief Scientist Larry Hufnagle worried that there were too few fish shown on the monitor. He said, “I don’t even know how you would fish on this stuff.” Dr. Rebecca Thomas, a research fishery biologist on the acoustics team, seemed to think there were plenty of fish, but suggested leaving the net in for a longer amount of time for a larger sample. After much more discussion, the team decided on a strategy and put in the net. I’m impressed how often they disagree and how carefully they listen to one another’s ideas.