Brandy Hill: What Lies Beneath the Surface, July 1, 2018

NOAA Teacher at Sea

Brandy Hill

Aboard NOAA ship Thomas Jefferson

June 25, 2018 –  July 6, 2018


Mission: Hydrographic Survey- Approaches to Houston

Geographic Area of Cruise: Gulf of Mexico

Date: July 1, 2018


Weather Data from the Bridge

Latitude: 29° 10.1’ N

Longitude: 093° 54.5’ W

Visibility: 10+ NM

Sky Condition: 3/8

Wind: 16 kts

Temperature:

Sea Water: 29.4° C

Air: 27° C


Science and Technology Log

At this point I have been able to understand more of the sonar technology taking place during the survey aboard the Thomas Jefferson. The ship uses two types of sonar: multibeam and side scan. Both work together transmitting and receiving sound pulses to and from the ocean floor. This provides a multispectral analysis.

Julia Wallace, a physical scientist, works at the sonar acquisition station. This requires a large amount of multitasking as she communicates with the bridge (ship steering deck), watches the safety cameras, and makes sure both sonar devices are working correctly.

Multibeam sonar is located underneath the hull of the ship. Multibeam is used to detect bathymetry (the depth of the ocean floor). Multibeam backscatter (reflected wave energy) gives a reading of the surface intensity. For example, a strong signal would mean a harder surface like rock or pipeline. With multibeam sonar, you can also adjust the sound wave frequency. For example, high frequency (primarily used during this survey in the Gulf of Mexico) is used for shallower waters allowing for higher resolution images. Images from multibeam have a color gradient to allow for clear vision of contours and depth differences. One way surveyors aboard the TJ may use backscatter images is to determine areas where bottom sampling might be applicable.

A NOAA ship using mulitbeam sonar. (Courtesy of NOAA)
Bathymetry acquired using multibeam echosounder layered over a nautical chart.  Blue and green wave lengths penetrate further in water, so the coloring corresponds to this observation. This poster is from a previous Thomas Jefferson hydrographic survey near Savannah, Georgia. (Prepared by CHST Allison Stone)
3D bathymetry imagery from the Okeanos Explorer. (NOAA)
A close-up view of multibeam data. The third window down shows multibeam backscatter.

The side scan sonar is used alongside multibeam to provide black and white scans of images. Like multibeam backscatter, side scan measures the intensity of the sound returning from the sea floor. For example, a side scan return with high intensity could indicate a difference in material like pipeline or a wreck. A low intensity value could mean that the side scan sonar waves have reached a muddy substrate. Julia used the analogy of a tennis ball being bounced against a wall of different materials. For example, the tennis ball hitting a concrete wall would bounce back with higher intensity than one being bounced against a soft wall. Side scan sonar is very effective at detecting features that protrude off the sea floor, and for shallow water surveys, typically can see farther and cover a greater area the sea floor than multibeam echosounders alone.

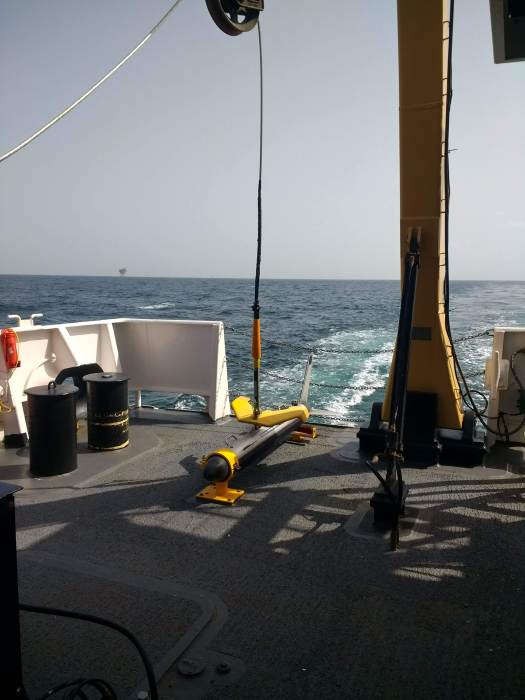
The side scan sonar sensor is located on a torpedo-shaped “towfish” and pulled behind the boat. When viewing side scan images, surveyors typically look for the acoustic shadow cast by a feature protruding off the sea floor. By measuring the length of the acoustic shadow, hydrographers can determine whether the feature requires additional investigation. For example, the outline of a shipwreck, bicycle, or pipeline. However, it can also detect mammals like dolphins or schools of fish.

Diagram of side scan sonar. (Courtesy of thunder bay 2001, Institute for Exploration, NOAA-OER)
The Thomas Jefferson sidescan sonar on deck.
In the early morning, the sidescan sonar picked up the image of an incorrectly charted shipwreck. Height is estimated using the "shadow" of the wreck.
In the early morning, the sidescan sonar picked up the image of an incorrectly charted shipwreck. Height is estimated using the “shadow” of the wreck.
Sidescan sonar imagery layered on a nautical chart. It is important to remember that sidescan data does not account for depth, it is a measure of differences in sea floor substrate.
Look closely and you can see arc lines in the sidescan imagery. Lt. Anthony Klemm explains that these arcs are from ships dragging anchor and stirring up the sea floor.

While this is happening, surveyors are also towing a MVP or Moving Vessel Profiler to capture information about the water column. This is important because multiple factors in the water column need to be corrected in order for accurate sonar calculations. For example, the speed of sound in salt water is roughly 1500 m/s but may change while the ship is traveling over different parts of the sea floor or passing through a thermocline (steep temperature gradient) or halocline (steep salinity gradient). The MVP is similar to the CTD used on the launch boat (see previous post), but the MVP allows the ship to continue moving at about 10 knots (average survey speed), while the CTD must be cast when the ship is stationary.

Information from the Moving Vessel Profiler. From left to right, the MVP tracks sound speed, temperature, and salinity in relation to depth.

For more information on multispectral analysis and sonar, see these resources:

https://oceanexplorer.noaa.gov/explorations/09bermuda/background/multibeam/multibeam.html

https://oceanservice.noaa.gov/education/seafloor-mapping/how_sidescansonar.html

Personal Log

One of my goals in the classroom is to teach students to be comfortable making and learning from mistakes. Making mistakes in math and science is common and welcome because they lead to great discussion and future change. Often, my sixth graders get discouraged or so caught up in failure that they become paralyzed in making further attempts. While aboard the Thomas Jefferson, I have witnessed several aspects not go according to plan. I think these experiences are important to share because they provide real-life examples of professionals coming together, learning from mistakes, and moving forward.

Around 4:00 am, the towfish side scan sonar became entangled with the MVP. This was a horrendous disaster. The crew spent about 16 hours contemplating the issue and collecting data using the multibeam only, which is less than ideal.  One of XO LCDR McGovern’s many roles aboard the ship is to serve as the investigator. She reviewed tapes of the early morning, talked with the crew, and later held a debrief with all involved. When something like this happens, the ship must write a clear incident report to send to shore. There were many questions about why and how this happened as well how to best proceed. In the end, the towfish and MVP were untangled with no damage present to the sensor. Within the same day, both were cast out and back in use.

I find this to be an astounding example of perseverance and teamwork. Despite being disappointed and upset that a critical tool for collecting accurate data was in dire shape, the crew came up with a plan of action and executed. Part of the engineering and scientific processes include evaluation and redesign. Elements of the sea and a center drift of the side scan lead to a documented new plan and refiguring the process so that this is unlikely to happen again.

Lt. Charles Wisotzsky's sketch of the complications with launching both the sidescan sonar (which tends to centerline) and MVP towfish with a current coming from port side.
Lt. Charles Wisotzsky’s sketch of the complications with launching both the sidescan sonar (which tends to centerline) and MVP towfish with a current coming from port side.
This camera image captures the entanglement of the sidescan sonar and MVP.

Peaks

+Saw a tuna eat a flying fish

Flying Fish. (www.ocean.si.edu)

+There is a large sense of purpose on the ship. Despite complex sleep schedules to enable 24 hour operations with a smaller crew, people are generally happy and working hard.

+ There seems to be an unlimited supply of ice cream in the ice cream freezer. Junior Officer, ENS Garrison Grant introduced me to a new desert- vanilla ice cream, a scoop of crunchy peanut butter, and chocolate syrup. I also found the rainbow sprinkles.

Eric Koser: Hydrography 101 – and the Tools to Make it Happen, June 28, 2018

NOAA Teacher at Sea

Eric Koser

Aboard NOAA Ship Rainier

June 22 – July 9, 2018

Mission: Lisianski Strait Survey

Geographic Area: Southeast Alaska

Date: June 28, 2018: 0900 HRS

Weather Data From the Bridge
Lat: 57°52.59′ Long: 133°38.7′
Skies: Broken
Wind 1 kt at variable
Visibility 10+ miles
Seas: calm
Water temp: 5.6°C

Science and Technology Log

Long Line Boat
A typical longline fishing boat. The fishing lines get spread out behind the boat from the large booms on either side.

The ultimate focus of Rainier is to assure accurate navigational charts are available to all mariners. This task is critical to the safety of many industries. About 80% of all the overseas trade in the US (by weight) is moved over water. Here in SE Alaska, it appears the largest industry is commercial fishing. Many boats fish both with nets and long lines to catch halibut, rockfish, cod, and several varieties of salmon.

Another major industry here is certainly tourism. As we conduct our work, we often see very large cruise ships. It’s an interesting juxtaposition to be in a narrow inlet surrounded by mountains, ice, and wildlife and then come across a large ship.  We passed the brand new ship Norwegian Bliss around 11 PM on our transit to Tracy Arm. This ship is 1,082 feet long, carries a crew of 2,100 people and has a guest capacity of 4,004 people! The safe navigation of all of these vessels depends upon the accuracy of charts produced by NOAA.

Norwegian Bliss
The cruise ship Norwegian Bliss as we passed her port to port in the evening.

The freely available charts offered by NOAA are created with three essential steps. First, the bulk of the depth data in this area is measured with MBES (Multi-Beam Echo Sounder). This creates a three-dimensional digital image of the bottom.

Secondly, important features to navigation that are shallow are best identified by our launches which travel along the shorelines and inspect for rocks, ledges, and other potential dangers. The locations of features are identified by GPS location and charted digitally by hydrographers on each launch.

Thirdly, bottom samples are collected by launch crews to confirm the type of material present on the bottom.

The MBES systems aboard Rainier and the launches come from Kongsberg Maritime. Two transducers (devices that transmit and receive) work in tandem. The transducer that is oriented front to back sends out an array of sound signals in a wide beam. The width of the beam on the sea floor depends directly on the depth – deeper water allows the beam to spread farther before reflecting. The transducer that is oriented side to side in the water receives a narrow swath of the ‘pings’ of sound that were transmitted. The time it takes any ping to get to the bottom and reflect back to the ship is recorded. The greater the time, the larger the depth.

MBES on a launch
This shows the position of the MBES on the bottom of one of several launches.
MBES transducers
This is the pair of MBES transducers on a launch, looking from the bow towards the stern.
Hydro Sonar
This image, courtesy of NOAA, depicts an MBSS beam below the ship and the mapped results off the stern.

A couple of issues provide challenges to this technique. One, the speed of sound in water depends on several factors. The salinity (concentration of salt in the water),  the conductivity (how easily electricity passes through the water), and the temperature each fluctuate as the depth changes and affect the speed of the sound waves. As hydrographers receive data, the system has to account for these changes in speed to produce an accurate depth measurement. One way to do this is with a static CTD sensor. This device is lowered from the launches all the way to the bottom as it measures the speed of sound in the water.  It provides a set of three charts as the depth changes which are used to adjust the time data from the MBES accordingly. There is also a version of the CTD, called a MVP (Moving Vehicle Profiler or ‘fish’), that can be pulled behind Rainier as we are moving and take dynamic data.

Here is a NOAA article on hydrographic surveying.  Here is further explanation of MBSS.

Deploying Depth Profiler
Here the crew lowers the profiler “fish” into the water.
Speed Profiler Data
These three plots represent the speed of sound, temperature, and salinity (from left to right) vs. depth (on the vertical axis).

A second issue is GPS signal drift. Over time, the location information can shift slightly. To account for this potential problem, the scientists place a HORCON (Horizontal Control) station onshore in the area where they are mapping. I described this tool in my previous post.

Another interesting technology that is currently being developed is called “backscatter” mapping. Here scientists look not only at the time it takes the sound waves to bounce back to the transducer, but also at the quality of the return signal. Different materials on the seafloor reflect the sound differently – hard surfaces like rocks have a sound signature that is much different than soft surfaces like silt or plants. NOAA is continually improving the tools they use to learn!

Here is an example of the chart that we are updating in Tracy Arm.

Personal Log

I had a chance to take the helm yesterday! It’s interesting how sensitive the steering on this large vessel really is. The rudders are able to turn from “amidships” or their center position, up to about 35° to either side. But while traveling at about 8 knots, we tend to use a maximum of about 5° of rudder to alter the ship’s direction. While at the helm, we keep close track of the heading (compass bearing) of the ship as indicated by the gyro compass and magnetic compass on board. Then we provide steering input to hold the ship to the course ordered by the CONN. I had the chance to help steer around several icebergs as we transited into Tracy Arm. Careful attention to detail – and willingness to promptly follow commands make for success!

Helm
My opportunity to take the helm of Rainier.

I also took an opportunity to head out in a kayak from the ship where we are anchored! Two of my new colleagues and I paddled across this bay and had a great chance to look very closely at pieces of ice. The ice is really beautiful and forms many interesting shapes. The quiet of the bay – hearing only the distant waterfalls, birds, and our paddling was beautiful!

Iceberg
This piece of ice drifted through Tracy Arm from the glacier. It was temporarily ‘grounded’ on the bottom by the receding tide.

It’s crazy to consider the ice we were seeing may have been formed thousands of years ago in the glacier – and it just now melting as it floats away.

Did You Know?

President Thomas Jefferson signed a mandate in 1807 ordering a survey of the nation’s coasts. This fundamental task is always ongoing, with 95,000 miles of US Coastline.

About 90% of any floating piece of ice will be submerged below the salt water.  Because the density of frozen fresh water just slightly less than salt water, the ice floats very low in the water!  Read more here!

Who is Onboard?

I’d like you to meet HST (Hydrographic Survey Technician), Amanda Finn! Ms. Finn has been with NOAA since last September – and started working aboard NOAA Ship Rainier in October of 2017. As an HST, Amanda works with the team of hydrographers to collect MBES data from either the ship or any of the launches. Amanda graduated from the University of Connecticut in 2016 with a bachelor of science degree in GeoSciences and a minor in Oceanography. At the end of her college experience, she knew that seafloor mapping was her passion but wasn’t sure how to make that into a job. But it all came together when she found NOAA through a friend of a friend!

HST Amanda Finn
HST Amanda Finn with recently acquired depth data for Lisinaski Inlet!

Amanda was performing at her first harp concert (another skill!) when she met a relation of a hydrographer who works on a NOAA ship! Based on her experience, her advice to students is: “When things don’t seem to be going the way you want, take time to focus on something else you like instead. In good time, things will work out!”

One positive challenge Amanda shares working here on a hydro ship is developing an understanding of systems integration. Many different pieces must come together to create the finished charts. The people aboard Rainier make the experience very positive!  The passion for seeking the unknown is the drive to continue!


Lacee Sherman: Teacher Running Out of Witty Blog Titles June 27, 2018

NOAA Teacher at Sea

Lacee Sherman

Aboard NOAA Ship Oscar Dyson

June 6, 2018 – June 28, 2018


Mission: Eastern Bering Sea Pollock Acoustic Trawl Survey

Geographic Area of Cruise: Eastern Bering Sea

Date:  June 27, 2018

Snailfish!!!
TAS Lacee Sherman with an Okhotsk Snailfish

Weather Data from the Bridge at 15:00 on 6/27/18

Latitude: 56° 32.03 N

Longitude: 168° 08.15 W

Sea Wave Height: 2 ft

Wind Speed: 9 knots

Wind Direction: 229° (SW)

Visibility: 8 nautical miles

Air Temperature: 9.8° C

Water Temperature: 8.5° C

Sky:  Broken cloud cover

Water and cloud cover
Water and cloud cover on 6/27/18 @ 15:00

Science and Technology Log

Sometimes the pursuit of scientific knowledge requires very precise scientific instruments, and sometimes it just requires a bucket, funnel, and a coffee filter.  During the CTD casts, a special bottle collects water samples from a specific depth.  The CTD can hold multiple water sample bottles, so a few days ago I was able to choose the location for an extra water sample to be taken.  The required water sample was taken near the ocean floor, and I requested one at about 15 meters below the surface.

On the EK60 we had noticed a lot of “munge” in the water near the surface and we wanted to know exactly what was in the water that was reflecting an acoustic signal back up to the transducers since it did not appear to be fish.  The upper part of the water column that had the munge was expected to have more small and microscopic organisms than the sample taken at a lower depth because of what had been seen on the EK60.

Water Collection Bottle
CTD water collection bottles

The CTD water bottles have flaps on the ends that can be triggered at specific depths.  When the two CTD bottles were brought back on the ship, they were opened to pour out the water samples.  Once the required 1 liter sample from the bottle taken near the ocean floor was put aside for another scientific study, the rest of the water was put into large white buckets to be sampled and inspected as we saw fit.  We had one large bucket filled with water from near the bottom which we labeled “deep” and the water from only 15 meters down, which we labeled “shallow”.

We used coffee filters placed in funnels to strain out any microscopic organisms from the water.  We had one set up for the “shallow” water sample, and another for the “deep” water sample.  When there was a tiny bit of water left in the filter, we used a pipette to suck up the slurry of microscopic organisms and a bit of water and place them in a glass dish.  From there, we took a few drops from each dish and put them under a dissecting microscope.

Filtering Ocean Water
Funnel and coffee filter straining the living organisms out of ocean water


Using the dissecting microscope we were able to identify a few things that we were seeing, and even take photos of them through a special part of the microscope where a camera could be attached.  We did not individually identify everything that we saw, but we did notice that there were diatoms, rotifers, crab larvae, and some type of egg.  There was a noticeable difference though between the quantity of organisms in the shallow and deep samples.  As predicted, the shallow water sample had many more microscopic organisms than the deep water sample.


Personal Log

Yesterday we did two trawls and one Methot sample.  I understand so much more now about exactly how all of the instruments work and how to operate some of them.  I finally feel like I was getting the hang of everything and able to be more helpful.  Each trawl takes about 3 hours plus processing time, so the days pass much quicker when we are fishing often.

Methot net being brought on deck
Methot net coming on deck after a haul

In our second trawl of the day we ended  up catching a really neat kind of snailfish that isn’t very common.  It’s always exciting to get something other than pollock in the nets, and it was really neat this time since no one else had ever seen one before either!  After spending a lot of time taking photos, looking at identifying features and using books and the internet to help, we finally were able to identify it as an Okhotsk Snailfish.

Today we are steaming back to Dutch Harbor, AK and I have to admit that I have mixed feelings about leaving life on the ship behind.  I will miss being a part of research and working with the MACE team.  I love being able to do research, and work closely with scientists and learn more about something that I really enjoy.  I will also definitely miss seeing the ocean every day.  I think it will probably be strange to walk on land now.  Since the ground won’t be moving anymore, hopefully that means that I can stop walking into walls!

All operations stopped on the ship last night so that we can have enough time to make it back to land before 09:00 on June 28, 2018.  Today I will be packing up my things, cleaning up my room for the next person, and then helping to clean and scrub the fish lab. Tomorrow I will return to life as a land dweller, although hopefully not forever.

Did You Know?

According to the Encyclopaedia Britannica, “The Bering Sea has more than 300 species of fish, including 50 deep-sea species, of which 25 are caught commercially. The most important among them are salmon, herring, cod, flounder, halibut, and pollock.”


Brandy Hill: Chat with Chief Engineer and My First Tuna Catch, June 28, 2018


NOAA Teacher at Sea

Brandy Hill

Aboard NOAA ship Thomas Jefferson

June 25, 2018 – July 6, 2018


Mission: Hydrographic Survey- Approaches to Houston

Geographic Area of Cruise: Gulf of Mexico

Date: June 28, 2018


Weather Data from the Bridge

Latitude: 28° 50.7’ N

Longitude: 093° 34.4’ W

Visibility: 10+ nm

Sky Condition: 4/8

Wind: 12 kts

Temperature:

Sea Water: 29.6° C

Air: 29.3° C


Science and Technology Log

This afternoon I spent an hour with Chief Marine Engineer, Thom Cleary. As promised, he gave me a tour of the Engine Room. Thom arrived on the Thomas Jefferson in 2011 and has worked not only on maintaining operations, but greatly improving them. When asked about his favorite ship mechanism, he responded with one that is not his favorite but of which he is most proud. The Thomas Jefferson, along with most other ships, typically used to rid greywater and sewage by offloading into the ocean. The EPA states that ships must be at least one nautical mile from land or people in the water and three nautical miles from aquaculture (2018). With hydrographic survey operations taking place in “no discharge” areas (close to shore), this could complicate and/or slow down the Thomas Jefferson’s progress.

Realizing the inefficiency and in an effort to improve, Thom investigated other options. It was decided that a fuel storage tank would be converted to hold more wastewater. After a long wait period, the new method was installed. Within the first season 38,000 gallons of sewage was stored and discharged to a shore treatment facility. Today, the tanks have gone almost two months without release into the Gulf of Mexico. This improvement has allowed hydrographic operations to continue without interruption, conserves fuel, and increases efficiency.

Renovations to the Thomas Jefferson did not stop there. Originally constructed in 1991, the ship has room for many other improvements. Thom and team advocated for all natural lubricants (rather than petroleum), switched all light fixtures to LEDs, and adjusted the ballast system. In 2016 the roughly 122,000 gallon ballast system changed from using sea to municipal water. This now allows the ship to move from multiple coastal waters without concern for carrying invasive species in the ballast tanks. In addition, the new waste water tank was strategically placed in the center of the ship to help with stability.

Ballast diagram
Ballast diagram showing invasive species risk. (CC)

Thom is an innovator and self-described incorrigible tinkerer. Many of these changes would not have been made without his (and team’s) desire and advocacy to make things better. When I asked if these upgrades were standard on ships, he mentioned that the Thomas Jefferson is a trailblazer.

Chief Engineer Thom Cleary
Chief Engineer Thom Cleary and the desalination/ reverse osmosis system. The RO typically operates at 650 psi (with 900psi maximum potential) and pushes sea water through a membrane creating potable water for the ship.


Personal Log

CO (Commanding Officer) authorized a launch on one of the boats. After some mishaps with a fuse, the crew performed multiple safety checks and we were cleared to go. Mission: collect survey data near a stationary platform. CO’s comfort level to obstructions with the main ship is a half-mile, so having the smaller launch boats is helpful when surveying areas like this.

Launch Boat Approach
The launch boat crew from left to right: Lt. Klemm, Kevin Brown, Pat Osborn, and Brandy Hill (below deck).


SurveyNearPlatform
Survey area near the stationary platform. The ship to the left is a supply vessel.

While cruising out to the survey area, I spoke with Pat Osborn, part of the Thomas Jefferson’s deck crew and our survey line driver for the day. Pat has two years of training and was explaining that he is still learning parts of his job. (Everyone on the ship wears multiple hats.) He spoke highly of his job and appreciated the multi-dimensional relationship between CO and the crew. Pat explained that CO is not expected to be an expert in all areas of the ship- there are safety checks (such as preparing for the launch) where the CO asks lead crew members to evaluate and sign-off prior to action. Every mission I’ve observed and attended has proceeded in this manner. It is a highly respectful and safe environment.

AllisonLaunchApproach
Chief Survey Technician, Allison Stone, awaiting launch boat arrival.
Launch Return to Ship
Patrick Osborn approaching ship Thomas Jefferson with the launch boat.
KevinDeployingCTD
Kevin Brown lowers the CTD while the boat is stationary. A CTD captures the salinity, temperature, depth, and concentration of particles in the water column. This information is used for analyzing the survey data. On the ship, this information is collected using an MVP which allows the ship to stay in motion.

As soon as we had the survey equipment set up and running, survey technician Kevin Brown brought out a fishing pole. I hadn’t realized that we could fish while out on the boat! We proceeded to catch and release about 10 tuna (likely False Albacore and Bonito). Kevin reeled in two, then passed the pole to me. I couldn’t believe how hard it was to real in a fish. I was reading that they can stay on the line and swim up to 40 mph!

Brandy reeling
Brandy Hill’s active line power stance.
False Albacore
Brandy Hill and her first fishing boat catch, False Albacore.

Peaks

 + Witnessed hard work and precision paying off- the launch boat survey data had an error of 0.0006 meters. The data is highly accurate!

+ Drove “the survey line” on the launch boat. (More of an explanation coming soon.)

+ Reeled in a beautiful, tough fish.

Note: After the seasickness subsided, I’ve decided to leave out the “Valleys” category. I’m having a great time.

Vickie Obenchain: Starting a Hydrographic Survey, June 28, 2018

NOAA Teacher at Sea

Victoria Obenchain

Aboard NOAA Ship Fairweather

June 26 – July 6, 2018


Mission: Arctic Access Hydrographic Survey

Geographic Area of Cruise: Northwest Alaska

Date: June 28th, 2018

Weather from the Bridge

  • Latitude: 54o 25.5’ N
  • Longitude: 134o 13.7’ W
  • Wind Speed: 13 Knots
  • Wind Direction: South, Southwest
  • Temperature: 12.2 oC
  • Visibility: 10 nautical miles
  • Wave Height: 1 foot
  • Current Sky Conditions: Overcast


Science and Technology Log

This morning I spent some time on the bridge with the officers. NOAA Ship Fairweather is manned day and night with men and women making sure we are safely on course. While the ship is equipped with GPS, the ship is also full of experienced mariners who plot our position on paper nautical charts to help guarantee the technology is working correctly and helps the officers orient themselves with the area.  Every 15 minutes, an officer plots our position either by using GPS coordinates, radar returns, or fixed land triangulation using an alidade. This last mode of determining our coordinates, at least to me, is the most difficult. You must use 3 fixed land points on either side of the ship, determine their direction using the compass on the alidade and then using sliding protractors plot our triangulated position on the chart. Both Executive Officer (XO) Michael Gonsalves and ENS Cabot Zucker have been incredibly helpful in teaching me these different plotting techniques.

plotting our course
XO Gonsalves in the foreground and ENS Zucker in the back plotting our course.

Today we are headed to the Queen Charlotte-Fairweather Fault System. This is a strike slip fault line extending 746 miles off shore of Vancouver Island to the Fairweather range in southeast Alaska.  USGS has partnered with NOAA Ship Fairweather to help to create part of a comprehensive map of one of the fastest moving underwater tectonic plates in the world, moving of a slip rate of 2 inches a year. Over the next 24 hours they will survey the area using multibeam sonar to help complete the mapping which as taken almost 4 years to complete.

To start this, the survey team had to deploy a Moving Vessel Profiler (MVP) into the water. The MVP follows behind the ship and by detecting water temperature and salinity of the water, the MVP can then determine the speed of sound in water needed to accurately detect the sea floor. With this knowledge the survey team can correctly calibrate their sonar to map the sea floor. Below you will see Sam Candio and Simon Swart of the survey team deploying the MVP.


Next blog will cover the amazing people working with the sonar, all times of day and night to make the sea floor maps! (Stay tuned!!)

______________________________________________________________________________

Another short term visitor on this ship is a college student from Loyola University Chicago, Paul Campion, who is on board doing an internship with NOAA. Each year NOAA accepts approximately 130 college sophomores into their two-year-long Hollings internship program to give students an opportunity to take part in research, gain job experience and see what NOAA does.  While on board, Paul has been working with the survey team to learn how they do their work, as well as create his own project.  Paul has been looking at the electronic navigational charts (ENC) used today by most mariners which show the depth of the sea floor. As NOAA Ship Fairweather surveys an area, these ENC’s can then be updated with more accurate and up to date data. While some areas may remain the same, some areas may show changes or even characteristics which may not have been mapped prior and need to be highlighted.  Paul has been working to help create an efficient way to show where the ENCs are different to the new NOAA Ship Fairweather data and may need to be altered or updated.

Paul Campion
Paul Campion pointing out a beautiful glacier!

Personal Log

Since we are out in the sea, and do not have neighboring island chains around us, the boat has been tossed around a bit more and is definitely rolling around in the waves. Luckily, I have not been sick… yet. I have been taking sea sickness pills, and making sure I get plenty of fresh air, but the boat is definitely more difficult to work in. You find yourself moving both with the boat’s inertia and then having to fight against it to move. Walking uses walls and railings, sitting requires holding on to the closest counter top or nailed down object and to get into rooms you need to shove doors away from you to open them, yet hold on so they don’t swing completely away from you and slam the opposite wall. It is kind of challenging and yet amusing.

After lunch today, I went to take a shower. I was given some good advice since I had not done this when the boat was in open water. These words of advice included: Use the walls, kind of squat down to lower your center of gravity, don’t take a razor with you (nothing good will come of that), and if the soap drops be especially careful! All things I took to heart and I am glad to report I am clean, unscratched and ready for another day.