Dana Chu: May 17, 2016

NOAA Teacher at Sea
Dana Chu
On Board NOAA Ship Bell M. Shimada
May 13 – 22, 2016

Mission: Applied California Current Ecosystem Studies (ACCESS) is a working partnership between Cordell Bank National Marine Sanctuary, Greater Farallones National Marine Sanctuary, and Point Blue Conservation Science to survey the oceanographic conditions that influence and drive the availability of prey species (i.e., krill) to predators (i.e., marine mammals and sea birds).

Geographic area of cruise: Greater Farallones, Cordell Bank, and Monterey Bay National Marine Sanctuaries

Date: Tuesday, May 17, 2016

Weather Data from the Bridge
Clear skies, light winds at 0600 increased to 18 knots at 0900, 6-8 feet swells

Science and Technology Log

Ahoy from the Bell Shimada! Today, I will explain three of the tools that are deployed from the side deck to obtain samples of the water and the ocean’s prey species.

First off we have the Harmful Algal Bloom Net, also known as the HAB Net, which is basically a 10-inch opening with a 39-inch fine mesh netting attached to a closed end canister. The HAB net is deployed manually by hand to the depth of 30 feet three consecutive times to obtain a water sample. The top fourth of the water collected is decanted and the remaining water (approximately 80ml) is transferred to a bottle which is then sealed and labeled with the location (latitude, longitude), date, time, vertical or horizontal position, and any particular comments. The samples will eventually be mailed off to California Department of Health Services lab for analysis for harmful toxins from algae that can affect shellfish consumers.

Next we have the hoop net, which is pretty much similar in design to the HAB net, except for a larger opening diameter of 3 feet (think hula hoop) and a net length of nine feet. The net tapers off into a closed container with open slits on the sides to allow for water drainage. The purpose of the hoop net to collect organisms that are found at the various depth levels of the deployment. The hoop net is attached to a cable held by the winch. The hoop net is lowered at a specific angle which when calculated with the speed of the vessel equates to a certain depth. The survey crew reports the wire angle sighting throughout the deployment.

Every time the hoop net is brought back up there is a sense of anticipation at what we will find once the canister is open. Coloring is a good indicator. Purple usually indicates a high concentration of doliolids, while a darker color may indicate a significant amount of krill. Phytoplankton usually have a brownish coloring. Many of the hoop net collections from today and yesterday include doliolids and colonial salps, neither are very nutrient dense. Yesterday we also found pyrosomes, which are transparent organisms that resemble a sea cucumber with little bumps and soft thorns along their body. The smallest pyrosome we came upon was two and a half inches with the largest over six inches long. A few small fish of less than one inch in length also showed up sporadically in these collections as well.

The Scientific team is looking for the presence of krill in the samples obtained. The Euphausia pacifica is one of the many species of krill found in these waters. Many tiny krill were found in the various hoop net deployments. On the last hoop net deployment for today and yesterday, larger sized krill of approximately 1 inch) were found. This is good news because krill is the dominant food source for marine mammals such as whales. Ideally it would be even better if the larger krill appeared more frequently in the hoop net samples.

Finally, we have the Tucker Trawl, which is the largest and most complex of the three nets discussed in today’s post. The Tucker Trawl consists of three separate nets, one for sampling at each depth: the top, middle, and bottom of the water column. Like the hoop net, the tucker trawl nets also have a canister with open slits along the side covered with mesh to allow water to drain. All three nets are mounted on the same frame attached to a wire cable held by the winch. As the Tucker Trawl is towed only one net is open at a time for a specific length of time. The net is closed by dropping a weight down along the tow. Once the weight reaches the net opening, it triggers the net to shut and sends a vibration signal up the cable line back to the surface which can be felt by the scientist holding the cable. The net is then towed at the next depth for ten minutes. Once the last net tow has been completed, the Tucker Trawl is brought back up to surface. Similar to the hoop net, the survey tech reads the wire angle throughout the deployment to determine the angle the cable needs to be at in order for the net to reach a certain depth. This is where all the Geometry comes in handy!

As mentioned already, with three nets, the Tucker Trawl yields three separate collections of the nutrients found within the top, middle and bottom of the water column. Once the nets are retrieved, each collection container is poured into a different bucket or tub, and then into a sieve before making it into a collection bottle. If there is a large quantity collected, a subsample is used to fill up a maximum of two bottles before the remainder is discarded back into the ocean. Once the samples are processed, an outside label is attached to the bottle and an interior label is dropped inside the bottle, formalin is added to preserve the sample organisms collected so that they can be analyzed later back in the lab.

Personal Log

It is so good to finally get my sea legs! I am glad I can be of use and actively participate. Cooperative teamwork is essential to getting everything to flow smoothly and on time. The Bell Shimada’s deck crew and NOAA team work hand in hand with the scientists to deploy and retrieve the various instruments and devices.

In the past two days I am getting a lot of hands on experience with deploying the HAB net to assisting with processing samples from the HOOP Net and Tucker Trawl. It’s always exciting to see what we might have collected. I can’t wait to see what the rest of the week may bring. I wonder what interesting finds we will get with the midnight Tucker Trawl samples.

Lesson Learned: Neatness and accuracy are imperative when labeling samples! Pre-planning and preparing labels ahead of time helps streamline the process once the samples are in hand.

Word of the Day:        Thermocline – This is the depth range where the temperature of the water drops steeply. The region above the thermocline has nutrient depleted waters and while the region below has nutrient rich waters.
 

Amanda Peretich: CTD and XBT – More Acronyms? July 8, 2012

NOAA Teacher at Sea
Amanda Peretich
Aboard Oscar Dyson
June 30 – July 18, 2012

Mission: Pollock Survey
Geographical area of cruise:
Bering Sea
Date:
July 8, 2012

Location Data
Latitude: 57ºN
Longitude: 172ºW
Ship speed: 11.2 knots (12.9 mph)

Weather Data from the Bridge
Air temperature: 6ºC (42.8ºF)
Surface water temperature: 7ºC (44.6ºF)
Wind speed: 2.5 knots (2.9 mph)
Wind direction: 156ºT
Barometric pressure: 1020 millibar (1.0 atm, 765 mmHg)

Science and Technology Log
Today’s post is going to be about two of the water profiling devices used on board the Oscar Dyson: the CTD and XBT.

CTD
CTD stands for Conductivity, Temperature, and Depth. It’s actually a device that is “dropped” over the starboard side of the ship at various points along the transect lines to take measurements of conductivity and temperature at various depths in the ocean. On this leg of the pollock survey, we will complete about 25-30 CTD drops by the end. The data can also be used to calculate salinity. Water samples are collected to measure dissolved oxygen (these samples are analyzed all together at the end of the cruise). Determining the amount of oxygen available in the water column can help provide information about not only the fish but also other phytoplankton and more. Although we are not doing it on this leg, fluorescence can also be measured to monitor chlorophyll levels.

CTD
From left to right: getting the CTD ready to deploy, the winch is used to put the CTD into the water, the CTD is lowered into the water – notice that the people are strapped in to the ship so they don’t fall overboard during deployment

DYK? (Did You Know?): What exactly are transect lines? Basically this is the path the ship is taking so they know what areas the ship has covered. Using NOAA’s Shiptracker, you can see in the photo where the Oscar Dyson has traveled on this pollock survey (both Leg 1 and Leg 2) up to this point in time.

Transect Lines
Using NOAA’s Shiptracker, you can see the transect lines that the Oscar Dyson has followed during the pollock cruise until July 8. The ship started in Dutch Harbor (DH), traveled to the point marked “Leg 1 start” and along the transect lines until “Leg 1 end” before returning to DH to exchange people. The ship then returned to the point marked “Leg 2 start” and followed transect lines to the current location. The Oscar Dyson will return to DH to exchange people before beginning Leg 3 of this survey and completing the transect lines.
Deploying the CTD
I was lucky enough to be able to operate the winch during a CTD deploy. The winch is basically what pulls in or lets out the cable attached to the CTD to raise and lower it in the water. Special thanks to the chief boatswain Willie for letting me do this!

The CTD can only be deployed when the ship is not moving, so if weather is nice, we should just stay mostly in one place. The officers on the bridge can also manually hold the ship steady. Or they can use DP, which is dynamic positioning. This computer system controls the rudder and propeller on the stern and the bowthruster at the front to maintain position.

Here is a video from a previous Teacher at Sea (TAS) about the CTD and showing its “drop” into the water: Story Miller – 2010. Another TAS also has a video on her blog showing the data being collected during a CTD drop: Kathleen Harrison – 2011.

XBT

Thermocline
The thermocline is the area where the upper isothermal (mixed) layer meets the deep water layer and there is a decline in temperature with increasing depth.

XBT is the acronym for the eXpendable Bathymetric Thermograph. It is used to quickly collect temperature data from the surface to the sea floor. A graph of depth (in meters) versus temperature (in ºC) is used to find the thermocline and determine the temperature on the sea floor.

DYK? Normally, temperature decreases as you go farther down in the sea because colder water is denser than warmer water so it sinks below. But this is not the case in polar regions such as the Bering Sea. Just below the surface is an isothermal layer caused by wind mixing and convective overturning where the temperature is approximately the same as on the surface. Below this layer is the thermocline where the temperature then rapidly decreases.

The MK-21IISA is a bathythermograph data acquisition system. This is a portable (moveable) system used to collect data including ocean temperature, conductivity, and sound velocity and various depths using expendable probes (ones you can lose overboard and not get back) that are launched from surface ships. The depth is determined using elapsed time from surface contact and a known sink rate.

There are three different probes that can be used with this data acquisition system:
1. XBT probe – this is the probe that is used on OD, which only measures water temperature at various depths
2. XSV probe – this probe can measure sound velocity versus depth
3. XCTD probe – this probe measures both temperature and conductivity versus depth

On the XBT probe, there is a thermistor (something used to measure temperature) that is connected to an insulated wire wound on two spools (one inside the probe and one outside the probe but inside the canister). The front, or nose, of the probe is a seawater electrode that is used to sense when the probe enters the water to begin data collection. There are different types of XBT probes depending on the maximum depth and vessel speed of the ship.

XBT Canister and Probe
This shows a sideview (left) and topview (middle) of the canister that houses the probe (right) released into the water during an XBT.

There are really four steps to launch the XBT probe using the LM-3A handheld launcher on board:
1. Raise contact lever.
2. Lay probe-containing canister into cradle (make sure to hold it upwards so the probe doesn’t fall out of the canister!).
3. Swing contact level down to lock in canister.
4. Pull release pin out of canister, aim into ocean, and drop probe.
Important: the wire should not come in contact with the ship!

Launching an XBT
“Launching” an XBT probe from starboard side on the Oscar Dyson. There is no actual trigger – you just make a little forward motion with the launcher to allow the probe to drop into the water.

Be sure to check out the video below, which shows what the data profile looks like as the probe is being dropped into the water. An XBT drop requires a minimum of two people, one at the computer inside and one outside launching the probe. I’ve been working with Scientist Bill and ENS Kevin to help out with the XBT launches, which also includes using the radios on board to mark the ship’s position when the probe hits the water.

Personal Log

Quickest Route?
We’ve been taught in school that the quickest way from point A to point B is a straight line, so you’d think that the red voyage would be the fastest way to get from Seattle, Washington across the Pacific Ocean to Japan. But it’s actually a path up through Alaska!

It’s been a little slow on the trawling during my shift recently, so I’ve had some extra time to wander around the ship and talk to various people amidst researching and writing more blog posts. I think one of my favorite parts so far has been all of the great information I’ve been learning up on the bridge from the field operations officer, LT Matt Davis.

DYK? When looking at the map, you’d think the quickest route from Seattle, Washington to Japan would be a straight line across the Pacific Ocean. But it’s not! Actually, ships will travel by way of Alaska and it is a shorter distance (and thus faster).

View from the Bow
View from the bow of the Oscar Dyson.

Vessels  use gnomonic ocean tracking charts to determine the shortest path. Basically a straight line drawn on the gnomonic projection corresponds to a great circle, or geodesic curve, that shows the minimum path from any two points on the surface of the Earth as a straight line. So on the way to Japan from Seattle, you would travel up through Alaskan waters, using computer software to help determine the proper pathway.

I’ve also had some time to explore a few other areas of the ship I hadn’t been to before. I’ve learned some new lingo (look for this in an upcoming post) and plenty of random facts. One of the places I checked out is the true bow of the ship where, if I was standing a bit higher (and wearing a PFD, or personal flotation device), I’d look like I was Rose Dawson in one of the scenes from Titanic.

Animal Love
All of the time I spend on the bridge also allows for those random mammal sightings and I was able to see a few whales from afar on July 7!

Whale Sighting
Whale sighting from the bridge! You have to look really closely to see their blow spouts in the middle of the photo.

Sue Oltman: Salinity and Seamount Sleuths, May 24, 2012

NOAA Teacher at Sea
Sue Oltman
Aboard R/V Melville
May 22 – June 6, 2012

Mission: STRATUS Mooring Maintenance
Geographical Area: Southeastern Pacific Ocean, off the coast of Chile and Ecuador
Date: May 24, 2012

Weather Data from the Bridge:
Air temperature: 18.3 C / 64.9 F
Humidity: 70.3%
Precipitation: 0
Barometric pressure: 1011 mB
Wind speed: 2.3 NNW
Sea temperature: 19.16 C

Personal Log

The weather has been terrific – clear, in the 60’s with a little wind, nice sailing with the current helping us along. We are in the trade winds region. The view from the bridge (Captain’s pilot house) is excellent.  Everyone is terrific and very patient in showing us the ropes. There’s plenty of time to get to know people.  I’m getting to practice my Spanish a bit with our 2 students from the University of Concepcion (Chile) and two more Spanish speakers, from Chile and Ecuador. The two others on watch with me are Seb Bigorre (WHOI) and Ursula Cifuentes, a grad student from Chile, so we speak some Spanish during the watches. Life on a ship is different, but some of the comforts of home are here, too. Thank goodness there is a laundry, otherwise I would have had to bring 3 weeks worth of clothes! The food has really been fantastic!

Mark serving up some great food
Mark is one of our friendly cooks who keeps everyone on the ship happy!
Mess deck
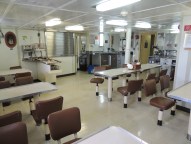
The mess deck is where we eat our meals, grab a snack, or sit to read or chat at off times.

The dinner tonight is carne asada (fajitas) and you can smell it cooking. Bob and Mark, our cooks, have also served us white bean chili, salads, cheeseburger sliders, roasted chicken, fish, pork roast and vegetables, seasoned hash browns, bacon and eggs, all kinds of fresh fruit, not to mention the desserts like blueberry cobbler and cinnamon rolls. 

With all this great food, I was thankful to find that the crew makes places on the ship to work out! Some do “laps” by walking the ship a few dozen times around. There is an exercise room with weights and bikes and more equipment can be found in other places around the ship.

Science and Technology Log

The Woods Hole UOP (Upper Ocean Processes group) and rest of the team is now in a rhythm of deploying probes and gathering data. Like super sleuths, we are tracking a cold, relatively fresh water mass which originates inValparaiso and moves northwest. This water mass lies under the warm, salty surface layer.  At 50 meters depth, there is a clear distinction in the water masses since we began deploying the UCTDs. Just like a detective matches fingerprints, we have a “fingerprint” of the cold, fresh water.  A seasonal thermocline has been identified! Nan Galbraith, a programmer from WHOI, is processing all of the numerical data into useful images.  The surface water layer (graph) has a temperature about 20º C and salinity > 35 ppt (parts per thousand). At 50 meters depth, the temperature abruptly drops to 17º C and falls to 7.5º C at 400 m which is the bottom depth we are testing; similarly the salinity drops to 34.1 ppt. Although we are traveling through water about 4,000 m deep, we are interested in tracking this water mass. I’m still having trouble remembering approximate Celsius to Fahrenheit conversions: here’s a link to help.

http://www.wbuf.noaa.gov/tempfc.htm

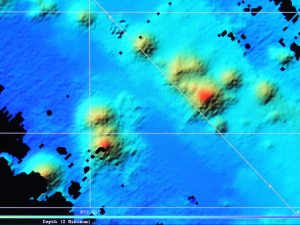
However, another factor has come into play which we must consider. We are nearing a tectonically active area – the Nazca Ridge, a fracture zone. There are many seamounts, some of which have not been previously mapped. Whoever is on watch must look at the ever-changing multi-beam sonar display to look for seamounts – we don’t want the instrument to slam into an underwater volcanic mountain! The closer we get to the Nazca Ridge, the higher the likelihood of seamounts.

Seamounts
We constantly monitor the multi beam sonar display for bathymetry and sea floor features. The red or yellow circular areas are seamounts.

All in all, we will cover about 2,268 miles until we reach the Galapagos, so the multibeam sonar is a critical piece of navigation equipment.

On the watches, as we deploy the UCTD probe, which looks like a 2 foot long bullet, weighing about 10 lbs., and good teamwork is the hallmark of a successful launch and recovery. Sometimes we are working in the dark with only the ship’s lights and a flashlight. I have learned how to make a splice in the line – the cord is only about 1 mm in diameter! This line and any splice must be strong enough to hold onto a 10 pound instrument being dragged though 400 m of water at 12 knots. Picture 3 people at 4 a.m. on a moving ship, using tiny instruments to sew a splice in a 1mm line, all while the line is attached to the winch. Like a surgical team, we are all focused and know what tool the splicer needs next. Sometimes quick thinking and a problem solving mindset is needed. There was a foam “bumper” that we had been attaching to the line to cover the probe when it got close to the boat. The probe is expensive and this was protection from it slamming into the steel fantail. When it was lost in the water, the team on watch used a nearby mop to protect the probe while reeling it in. On the next watch, Seb figured out a different solution.

Why does it smell like diapers in here?

Back in the lab a different bit of problem solving with the scientific method is going on! Often when buoys are recovered, they are fouled — covered with barnacles and all kinds of organisms, fishing line, etc. that get caught in them. Jeff Lord – mechanical whiz – has hypothesized that applying a better “anti-fouling” substance can keep these from affixing themselves to the equipment. He has liberally applied Desitin, a zinc oxide ointment, to the instruments. This is the same treatment for diaper rash on babies’ bottoms!  So therefore, the odor in the lab reminds us of diapers. It will be a year before we know if Jeff’s hypothesis is correct, because after the STRATUS 12 buoy is moored, it will be a year before it is recovered.  What do you think will happen?

Some of the science party was given a tour of the ships technical equipment behind the scenes. Bud Hale explained not only all of the monitors and ship terminology, but took us down into the equipment rooms where we encountered a gravimeter (measures gravity variations), modern gyros with optics and GPS (measures pitch, roll and heave).

Bud Hale
Bud is an expert on all things technical on the ship. He is more than happy to tell you how any of it works!

Tomorrow, we hope to see the desalination plant on the ship which gives us our fresh drinking water.

UCTD files
After each deployment of a UCTD, data is uploaded into the computer. I’m starting to get the hang of it!

Kathleen Harrison: CTD, XBT, Drop, July 18, 2011

NOAA Teacher at Sea
Kathleen Harrison
Aboard NOAA Ship  Oscar Dyson
July 4 — 22, 2011


Location:  Gulf of Alaska
Mission:  Walleye Pollock Survey
Date: July 18, 2011

Weather Data from the Bridge
True Wind Speed:  19.35 knots, True Wind Direction:  231.44°
Sea Temperature:  10.5° C, Air Temperature:  10.11° C
Air Pressure:  1010.53 mb
Latitude:  57.54° N, Longitude:  154.37° W
Ship speed:  12.4 knots, Ship heading:  134.5°
Fog on the horizon, overcast

Science and Technology Log

One thing that I have learned on this trip (don’t worry, I have learned more than one thing) is that the government, and scientists, like to use abbreviations for equipment, procedures, and groups of people.  For example,  did you know that MACE stands for Midwater Assessment Conservation Engineering?   Well, now you do. The NOAA scientists that are aboard the Oscar Dyson work for the Alaska Fisheries Science Center, which is part of MACE.  Three of the abbreviations that I have become familiar with are:  CTD (conductivity, temperature and depth), XBT (expendable bathythermograph), and Drop (Drop camera).  These are devices or procedures that the NOAA scientists use on board the Oscar Dyson to gather information that will help in determining the biomass of Pollock.

Conductivity, Temperature and depth device
The CTD measures conductivity, temperature and depth of sea water.

When I say “the CTD”, I am referring to a device, but the letters actually come from the procedures that the device performs.  It is lowered into the water on a cable, and its instruments measure the conductivity (how much electricity will pass through – an indirect way of measuring salinity) and  temperature of the sea water, and depth.  Niskin bottles may be attached to the CTD frame to collect sea water at selected depths.  This information gives scientists knowledge about sea water properties, and over time, will indicate changes in the environment.

Watch this video to see the data as it is being collected.

launching the XBT
A hard hat and flotation device are required on the weather deck (any deck open to the weather), even to launch the XBT.

Launching the XBT has been one of my jobs on the Oscar Dyson, at least during my shift.  This device measures temperature and depth of sea water.  It is basically thrown overboard out of a handheld launcher, which looks like a giant pistol thing, and remains attached to a very thin wire.  Data is sent through this thin wire until it reaches the ocean floor, then the wire is broken.  The device is not retrieved – hence the name – expendable.

thermocline

The data is graphed, and a beautiful thermocline is produced.  An XBT is launched 3 – 4 times a day, in different locations.

camera and light attached to frame
The Drop Camera is attached to a frame to protect it. The light is at the bottom of the frame.

The Drop Camera is an underwater camera that is lowered to the ocean floor.  The camera is pressure activated, so it starts recording at a certain depth.  It has a bright light that comes on when the camera is operating.  Extra line is fed out, because the ship is still moving, and the scientists do not want the camera to drag across the bottom.  It records for a few minutes, then it is hauled back to the boat, the memory card is retrieved, and the video is examined.  This information about the ocean floor is valuable to commercial fishermen, and future scientific missions.

sea stars and flat fish
The ocean floor close to Alaska's coast is home to a variety of sea stars, including brittle stars, as well as flat fish such as sole, flounder, and halibut. (NOAA Ocean Explorer)

New Species Seen  

Minke whale

Great Northern Diver (Loon)

Harbor Seal

Fin Whale

Humpback whale

4:30 am, Shelikof Strait
I was blessed to see this full moon about 4:30 am, with Mt. Douglas (elev. 7000 ft) in the background, in the Shelikof Strait.

Personal Log

Today was a fantastic day for wildlife and scenery viewing, as the sun was shining, the winds were calm, and it stays light until midnight here in the Shelikof Strait, west of Kodiak Island.  I started the day by going to the bridge around 4:30 am, and was delighted to see a bright full moon, and volcanoes of the Alaskan Peninsula.  The day only got better, as the sun rose around 5:30 am.

fin whale blow and dorsal fin
I have new respect for whale photographers, they are very hard to capture in a photo, here is my amateur attempt.

I spent a lot of time on the flying bridge, looking for whales, and finally took a photo of a spout and fin.  I was so excited!  You have to be looking at the right spot, at the right time.  Our transects take us close to Kodiak Island and its rocky cliffs, as well as the Alaskan Peninsula with its impressive glacier covered volcanoes.

bold and steep cliffs of Kodiak
The cliffs of Kodiak rise straight up out of the sea, bold and stunning.

We had a successful trawl today, and I spent several hours in the fish lab.  My head was kept warm by this pink knit hat that my sister made for me.  Thanks, Jan!

the fish lab is cold, need a hat
Thanks, Jan, for making this hat for me, I was nice and warm while processing fish today!

Steven Wilkie: June 26, 2011

NOAA TEACHER AT SEA
STEVEN WILKIE
ONBOARD NOAA SHIP OREGON II
JUNE 23 — JULY 4, 2011

Mission: Summer Groundfish Survey
Geographic Location: Northern Gulf of Mexico
Date: June 26, 2011

Ship Data:

Latitude 26.56
Longitude -96.41
Speed 10.00 kts
Course 6.00
Wind Speed 4.55 kts
Wind Dir. 150.72 º
Surf. Water Temp. 28.30 ºC
Surf. Water Sal. 24.88 PSU
Air Temperature 29.20 ºC
Relative Humidity 78.00 %
Barometric Pres. 1012.27 mb
Water Depth 115.20 m
Before getting down to work, it is important to learn all precautionary measures. Here I am suited up in a survival suit during an abandon ship drill.

Science and Technology Log

After two days of travel we are on site and beginning to work and I believe the entire crew is eager to get their hands busy, myself included.   As I mentioned in my previous post, it is difficult if not impossible to separate the abiotic factors from the biotic factors, and as a result it is important to monitor the abiotic factors prior to every trawl event.  The main piece of equipment involved in monitoring the water quality (an abiotic factor) is the C-T-D (Conductivity, Temperature and Depth) device.  This device uses sophisticated sensors to determine the conductivity of the water, which in turn, can be used to measure salinity (differing salinities will conduct electricity at different rates).   Salinity influences the density of the water: the saltier the water the more dense the water is.  Density measures the amount of mass in a specific volume, so if you dissolve salt in a glass of water you are adding more mass without much volume.  And since Density=Mass/Volume, the more salt you add, the denser the water will get.   Less dense objects tend to float higher in the water column than more dense objects, so as a result the ocean often has layers of differing salinities (less salty water on top of more salty water).  Often you encounter a boundary between the two layers known as a halocline (see the graph below for evidence of a halocline).

Temperature varies with depth in the ocean, however, because warm water is less dense than cold water. When liquids are cold, more molecules can fit into a space than when they are war; therefore there is more mass in that volume.   The warm water tends to remain towards the surface, while the cooler water remains at depth.  You may have experienced this if you swim in a local lake or river.  You dive down and all of a sudden the water goes from nice and warm to cool. This is known as a thermocline and is the result of the warm, less dense water sitting on top of the cool more dense water.

Here is the fancy piece of technology that makes measuring water quality so easy: the CTD.

Temperature also influences the amount of oxygen that water can hold. The cooler the temperature of the water the more oxygen can dissolve in it.  This is yet another reason why the hypoxic zones discussed in my last blog are more common in summer months than winter months: the warm water simply does not hold as much oxygen as it does in the winter.

The CTD is also capable of measuring chlorophyll.  Chlorophyll is a molecule that photosynthetic organisms use to capture light energy and then use to build complex organic molecules that they can in turn be used as energy to grow, reproduce etc.  The more chlorophyll in the water, the more photosynthetic phytoplankton there is in the water column.  This can be a good thing, since photosynthetic organisms are the foundation of the food chain, but as I mentioned in my earlier blog, too much phytoplankton can also lead to hypoxic zones.

Finally the CTD sensor is capable of measuring the water’s turbidity.  This measures how clear the water is.  Think of water around a coral reef — that water has a very low turbidity, so you can see quite a ways into the water (which is good for coral since they need access to sunlight to survive).  Water in estuaries or near shore is often quite turbid because of all of the run off coming from land.

This is a CTD data sample taken on June 26th at a depth of 94 meters. The pink line represents chlorophyll concentration, the green represents oxygen concentration, the blue is temperature and the red is salinity.

So, that is how we measure the abiotic factors, now let’s concentrate on how we measure the biotic!  After using the CTD (and it takes less time to use it than it does to describe it here) we are ready to pull our trawls.  There are three different trawls that the scientists rely on and they each focus on different “groups” of organisms.

The neuston net captures organisms living just at the water's surface.

The neuston net (named for the neuston zone, which is where the surface of the water interacts with the atmosphere) is pulled along the side of the ship and skims the surface of the water.  At the end of the net is a small “catch bottle” that will capture anything bigger than .947 microns.  The bongo nets are nets that are targeting organisms of a similar size, but instead of remaining at the surface these nets are lowered from the surface to the seafloor and back again, capturing a representative sample of organisms throughout the water column.   The neuston net is towed for approximately ten minutes, while the bongo nets tow times are dependent on depth.   Once the nets are brought in, the scientists, myself included, take the catch and preserve it for the scientists back in the lab to study.

The bongo nets will capture organisms from the surface all the way down to bottom.

The biggest and baddest nets on the boat are the actual trawl nets launched from the stern (back) of the boat.  These are the nets the scientists are relying on to target the bottom fish.  This trawl net is often referred to as an otter trawl because of the giant heavy doors used to pull the mouth of the net open once it reaches the bottom.  As the boat moves forward, a “tickler” chain spooks any of the organisms that might be lounging around on the bottom and the net follows behind to scoop them up.  This net is towed for thirty minutes, and then retrieved and we spend the next hour or so sorting, counting and measuring the catch.

Here you can see the otter trawl net extending off the starboard side of the Oregon II. When lowered into the water the doors will spread the mouth of the net.
Personal Log
I thought that adjusting to a 12 hour work schedule would be tough, but with a 5-month old son at home I feel I am more prepared than most might be for an extended day.  I might go as far as to say that I have more down time now than I did at home!  Although the ship’s crew actually manages the deployment of the majority of the nets and C-T-D, the science team is always involved and keeping busy allows the hours to tick away without much thought.  Before you know it you are on the stern deck of the ship staring at a gorgeous Gulf of Mexico sunset.

As we steam back East, the sun sets in our stern every day, and we have been treated to peaceful ones thus far on this trip.
The sun has long since set.  As I write this it is well after midnight and my bunk is calling.

Tammy Orilio, A Little Bit of Science…, June 18, 2011

NOAA Teacher at Sea: Tammy Orilio
NOAA Ship Oscar Dyson
Mission: Pollock Survey
Geographical Area of Cruise: Gulf of Alaska
Date: 18 June 2011

Weather Data from the Bridge:
Latitude: 52.34 N
Longitude: -167.51 W
Wind Speed: 7.25 knots
Surface Water Temp: 6.6 degrees C (~43.9 degrees F)
Water Depth: 63.53 m
Air Temp: 7.1 degrees C (~44.8 degrees F)
Relative Humidity: 101% (it’s very cloudy/foggy, but not raining)


Science & Technology Log:

The XBT Launcher mechanism.

Today I used the Expendable Bathythermograph (XBT) a few times. The WHAT??   The expendable part means we use it once and don’t recover it.  Let’s break down the second part into the two main roots:  bathy– which refers to depth, and thermo which refers to temperature.  This probe measures the temperature and depth of the water when it is dropped over the starboard (right) side of the ship.

“Dropping” isn’t exactly the correct phrase- we use a launcher that kind of resembles a gun.  The probe sits inside of the black tube, and after we uncap the end of the tube, we basically fling our arm out over the side of the ship to launch the probe into the water.  I can’t show you any pics of the probe, because if we take it out of the black tube, it’ll start recording data.  The probe is connected to a length of copper wire, which runs continuously as the probe falls through the water column, collecting data.  It’s important to launch the probe as far away from the ship as possible, because if the copper wire touches the metal on the ship, the data feed will be disrupted and we’d have to launch another probe.  Big waste of money and equipment! One of the survey technicians decides to cut the wire (or tells me to) when they’ve decided that a sufficient amount of data has been collected, and we can then look at a graph to see the relationship between temperature and depth.
The XBT is a quick and easy method of data collection, and can be run while the ship is in motion.  The ship does have another piece of equipment- the Conductivity, Temperature, and Depth meter (CTD)- to collect the same data, but the CTD is very big and bulky, and the ship must be stopped in order to deploy the CTD.  The CTD can also measure parameters such as dissolved oxygen concentration, current velocity, and other things (depending on the additional equipment on the meter).  The main advantage the XBT has is that it is quick and can be deployed as the ship is sailing.

from www.windows2universe.org
from http://www.windows2universe.org

Data Collected from an XBT probe today:
Latitude: 53.20 N
Longitude: -167.46 W
Water Temp at Surface: 6.7 degrees C
Water Temp at Bottom: 5.1 degrees C
Thermocline located from 0-25 meters depth

What is a thermocline, you ask?  Root word time!  We’ve already gone over thermo, and cline refers to a gradient, or where things change rapidly.  So, the thermocline is the area where you see the greatest change in temperature.  See the diagram as an example (it’s not our actual data).  Beneath the thermocline, the water temperature remains relatively constant.
Personal log:

Launching the XBT in full safety gear (minus the hardhat, it fell off)
Safety first, my friends.

Yesterday, as we were finally on our first transect of many, we needed to use the XBT to collect temperature and depth data.  A couple of the scientists told me that I could do it- yay, something for me to do!!  So I go to the lab room and see a ton of safety gear out- heavy coat, hardhat, gloves, soundproof earmuffs, goggles.  The survey tech tells me that I have to use all that protective gear because the XBT launcher is just like a gun- have I shot a gun before?  No!  So this is interesting.  I don the gear, and he explains what I need to do…which doesn’t seem that dangerous.  So now here I am, all geared up, and the rest of the scientists come trickling in to the lab to watch me.  That should’ve been a red light right there.  Why would they want to watch me do something so simple?  Turns out that it’s something that all the new people on the boat go through- we get all hyped up about shooting a loud gun, get loaded with gear, and then…not much.  So I basically got all dressed up in my protective gear for no other reason than the entertainment of the crew!!


QUESTION OF THE DAY:

Why is it important to know the temperature and/or depth of the water that we’re trawling in?

Rebecca Kimport, JUNE 30, 2010 part2

NOAA Teacher at Sea Rebecca Kimport
NOAA Ship Oscar Dyson
June 30, 2010 – July 19, 2010

Mission: Summer Pollock survey
Geograpical Area:Bering Sea, Alaska
Date: June 30,  2010

What’s in your water?

Now that we are at sea, I work a shift each day (as do all members of the crew and science team). I began my shift this morning at 0400 and reported to the Acoustics Lab to meet with chief scientist, Neal Williamson. In addition to Neal, my shift includes Abigail McCarthy, NOAA research fisheries biologist, Katie Wurtzell, awesome biologist and my fellow TAS, Michele Brustolon.We began the shift by observing our first CTD (Conductivity Temperature Depth) profiler which will be deployed at least 10 times throughout our trip. The CTD measures conductivity, temperature, and depth (used to calculate salinity) and gathers samples to measure dissolved oxygen. In other words, it measures many of the physical properties of the seawater mixture in a specific column of water. In addition, fluorescence is measured to monitor chlorophyll up to a 100 m from the surface.How it works: The CTD is lowered down to the ocean floor, collecting data on the way down. Then, on the way back up, the survey tech stops the CTD at specific depths to collect water for the samples. Upon its return, the water is collected and treated for future analysis.

Here is our CTD sensor before its launch

After our first CTD, we completed our first Methot trawl. A Methot trawl is named after the scientist who designed the net used. Here is a picture of the methot getting hauled back on deck (please note, it does actually get dark here. I woke up in the dead of night and had to wait two hours for sunrise. Sunrise is at the “normal” time of 6:30 am and I think that’s because we are on the western edge of the time zone)

Here Comes the Methot

A Methot net grabs the creatures and collects them into a codend (to make it easier for us to process) at 30-40 m below the surface – our Methot collected jellies and euphausiids (also known as krill). My first duty was to sort through the “catch” to pick out jellies. Next, we measured the weight of the krill before counting a small sample. We also preserved a couple samples for use in larger studies.

Launching the XBT

Following our Methot, I assisted with the completion of an XBT (eXpenable Bathymetric Thermograph). At left, you will see that I actually “launched” the XBT overboard. The XBT is used to collect quick temperature data from the surface to the sea floor. The data are graphed at depth vs. temperature to highlight the thermocline, that is where colder water meets water warmed by the sun. Here in the Bering Sea, the thermocline is not always noticeable as the water column is subject to mixing from heavy winds and shallow depths.

Lucky for us, it was a calm day on the water and we were able to see a distinct thermocline:

The thermocline
I think the CTDs and XBTs are really cool because they are pretty routine. Both processes are conducted all over the globe at consistent locations year after year. As you can see from the chart below, the CTDs and XBTs are marked out for the area the Oscar Dyson covers throughout the summer. (As I mentioned in my blog description, theOscar Dyson must travel the same route year after year for the pollock survey to ensure consistency in data collection).

XBT CTD locations

Beyond the Oscar Dyson, these data are collected on every NOAA cruise that I read about and that data can be used to measure how a body of water is doing in general as well as how the water column of a specific location has changed over time. For example, longitudinal data are needed to note climate change within the Bering Sea. Pretty cool huh?

Vocabulary Note: I tried to define all the new terms I used in my entry. Did you notice a term I didn’t define? Ask me about it in the comments and I will make sure to provide you with a definition.

Thought Question: In the XBT data graph, why is the X axis labeled on the top rather than the bottom? (think about your coordinate plane)

Michele Brustolon, June 30th, 2010

NOAA Teacher at Sea
Michele Brustolon
Onboard NOAA Oscar Dyson
June 28 – July, 2010

NOAA Ship Oscar Dyson
Mission: Pollock Survey  
Geographical area of cruise: Eastern Bering Sea (Dutch Harbor)  
Date: June 30th, 2010  

Weather Data from the Bridge

Time: 1600 hrs
Latitude: 57.16 N
Longitude: 169.09 W
Cloud Cover: Dense fog
Wind: 11.56 knots
Air Temperature: 5.30  C/ 420 F
Water Temperature: 5.090 C/ 410 F
Barometric Pressure: 1005.02 mb

Science and Technology Log

Time with Birds and Mammals
Once we finally left Dutch Harbor behind, I spent some time on the bow with birder, Nate Jones.

As I know very little about birds, I quizzed him on every flying specimen we encountered and used his binoculars to observe the birds up close. After a few sightings, I was able to identify the Fulmar by its unique wing movement (quick quick quick soar). We also saw tufted puffins and a black footed albatross. There are two birders on this leg who are responsible for scanning the horizon and counting and identifying the sea birds they observe from the bridge.  We were distracted from our bird watching by a call of orcas. I hustled up to the “flying bridge” to join the marine mammal observers. There are three “mammals” on this leg and they are constantly scanning the horizon with their “big eyes” to observe and identify cetaceans. I was able to observe two separate groups of orcas and heard that porpoises were also spotted.

Although I am technically on the fish shift, I hope to check in with the “birds” and “mammals” later in the cruise.

What’s in your water?
I began my shift this morning at 0400 and reported to the Acoustics Lab to meet with head scientist, Neal Williamson. In addition to Neal, my shift includes Abby McCarthy, a NOAA research fisheries biologist, Katie Wurtzell, awesome biologist and my fellow TAS Rebecca. We began the shift by observing our first CTD (Conductivity Temperature Depth)  profiler which will be deployed approximately 10 times throughout our trip. The CTD measures conductivity, temperature, and depth (used to calculate salinity) and gathers samples to measure dissolved oxygen. In addition, fluorescence is measured to monitor chlorophyll up to a 100 m from the surface.

The CTD – measures Conductivity, Temperature, and Depth

After our first CTD, we completed our first Methot trawl. A Methot trawl is named after the scientist who designed the net used. A Methot grabs the creatures and collects them into a codend (to make it easier for us to process) at 30-40 m below the surface – our Methot collected jellies and euphausiids (also known as krill). My first duty was to sort through the “catch” to pick out jellies. Next, we measured the weight of the krill before counting a small sample. We also preserved a couple samples for use in larger studies.

Following our Methot, I observed the deployment of an XBT (eXpenable Bathymetric Thermograph). The XBT is used to measure quick temperature data from the surface to the sea floor. The data are graphed at depth vs. temperature to highlight the thermocline, which is where colder water meets water warmed by the sun. Here in the Bering Sea, the thermocline is not always noticeable as the water column is subject to mixing from heavy winds and shallow depths.

Methot – graphing temperature vs. depth – shift in graph shows thermocline.

Personal Log

As I approached Dutch Harbor, I began taking photos from the plane. It sounds crazy, but the landscape is like nothing I have ever seen. Once I was off the plane, my smile grew because of the crisp air and the smell of saltwater. After two days of travel I had finally made it to Dutch Harbor and my luggage made it with me! I was brought to the boat to drop off my bags and then into town to catch up with others on Leg 2. The Oscar Dyson was having work done on its large generator so we didn’t leave port until June 29 at 1430 hours. It actually gave me time to get to know a good portion of the people on this leg (the crew, scientists, “birders,” mammalian observers, and the stewards). I was also able to explore Dutch Harbor, Unalaska (we tried to find wild horses…no luck!), and take some walks from the Oscar Dyson. Some of the most common flowers and birds seen are the lupines, orchids, and bald eagles EVERYWHERE! They are incredibly loud too! They remind me of seagulls and squirrels back home because there are so many! Wednesday, June 30 was the first day of our 0400- 1600 work shift so we won’t see everyone until we are transiting back because of the different shifts. The Oscar Dyson has 40 bunks and we are occupying 39 of them-talk about a full ship! For information about what happens during our shift, take a look in the science and technology log. I am truly enjoying my time and there are plenty of people to make me laugh which is the best medicine when you are a tyro!

Dutch Harbor at low tide from the dock of
the Oscar Dyson
Dutch Harbor during a typical day

Animals Seen in Dutch Harbor

Bald eagles
Ground Squirrel
Sea Urchin
Sea Stars
Sea Cucumber
Pigeon Guillemont
Oyster Catchers
Mussels
Chiton
Limpets
Hermit Crabs
Snails
(but no horses…)

A Bald Eagle named “Charlie” sitting outside the Unisea Restaurant

Animals Seen in Transit

Orcas
Fulmars
Black Footed Albatross
Tufted Puffin

Animals Seen on First Shift

Euphausiids
Jellies
Pollock!!!
Pacific Cod

Word of the Day

Tyro: a novice or beginner

New Vocabulary:

CTD: (Conductivity Temperature Depth) A device used to measure conductivity, temperature and depth at specific locations within the Bering Sea

Methot: A net used for shallow trawls, named after the scientist

XBT: eXpendable Bathymetric Thermograph

Thermocline: the point when the temperature drops

Scott Sperber, July 11-12, 2009

NOAA Teacher at Sea
Scott Sperber
Onboard Research Vessel Kilo Moana
July 9-17, 2009 

Mission:Woods Hole Oceanographic Institution Hawaii Ocean Time series Station; Albert J. Plueddemann, Chief Scientist
Geographical area of cruise: Central Pacific, north of O’ahu
Date: July 11-12, 2009

Weather Data from the Bridge 
Temperature: 24.2 C

Bringing in the SEABIRD CTD

Science and Technology Log 

Compared to yesterday today is a very slow scientific day.  After releasing the WHOTS buoy, things really calmed down.  Let me take this opportunity to tell you a bit about some of the instrumentation on the buoy itself.  The overall goal of the project is to collect data about the ocean and atmosphere over a long period of time.  These data will serve to help answer questions about such things as global warming and its impact in the tropics. On the buoy itself, pictured in a previous log, there are instruments that measure temperature, humidity, solar radiation, wind direction and speed. A GPS unit keeps track of the buoy’s location at all times. On the buoy there is also an antenna which transmits data to satellites. Each of the two buoys [explain why there are two in the ocean for this 4-day comparison period] in the water has enough slack in the lines to allow for an approximate 2-mile radius circle.

Profile of CTD on shallow casts

The weather balloon launching continues every four hours with teams of two or three taking each launch in shifts. Some CTD casts have been done with the small package SEABIRD CTD.  This is set over the side, lowered down by crane and yo-yoed up and down for about four hours.  During this time, data are sent directly to an onboard computer and collected by the scientists. These data include temperature and salinity. This is important information to assess changes going on in the crucial air/sea interface.

These particular locations, ones where temperature and salinity difference vary worldwide, the thermocline and halocline are dependent on variables such a currents and air temperature.  On the final assent collection bottles are closed to collect water samples for further analysis. With all of this sophisticated instrumentation onboard surface water temperature samples are still taken with the old fashioned method of lowering thermometers into the water several times to take an average reading. Some things never change. The information collected by both the oceanographic crew as well as the meteorological crew aboard is truly showing the links, the association between the interaction of the air and sky, in the crucial air/sea interface.

I found out today that the temperatures on the two thermometers on the WHOTS-6 buoy are not matching. They are off by about 0.4 degrees C; that is the level of precision necessary for this research.  The scientists are looking into which one is closest to the temperatures read on the ship before we move off to the old buoy’s location tomorrow. Apparently, this is not something that can be reconfigured so the scientists need to know which thermometer they can rely on for information. There are two of just about every instrument on the WHOTS buoys. This serves as a backup and a comparison for the same location and enables the greatest accuracy in the data.

Profile of weather balloon sonde

Personal Log 

I’d like to share a bit more about my onboard life. I have gotten acclimated finding my way around the ship (sort of). Well, at least I don’t get lost going to the mess hall anymore.  I am in a berth on an upper bunk with Jeffrey Snyder, one of the primary researchers from the University of Hawaii. The berth is quite comfortable as berths can go since it has been years since I was in a bunk bed. Various alarm clocks go off at anytime at night so the crew can go on their watch.  There is even a ghost alarm that goes off at 01:15 that Jeff and I cannot locate.  Food is not at a shortage. It seems that every time you turn around it is time to eat, and what great food it is too.  There is fresh salad lunch and dinner, fresh fruit, at least 3 entries to choose from each mea and desserts. LA Fitness here I come. I received what I consider a gift today from Fernando Santiago, one of the principle scientists, a DVD of the procedures that are used on the Hawaii Ocean Time-series Project.

July 12, 2009 

Had some down time today after setting off another weather balloon and a great fruit and yogurt breakfast. Took a 7 mile bike ride. You may ask where in the middle of the ocean you can take a 7 mile bike ride.  They have a nice little fitness room on board.

Words of the day: Mahimahi, calibration, dissolved oxygen, interface, thermocline, conductivity, temperature, depth.

Rachel Dane, May 2, 2005

NOAA Teacher at Sea
Rachel Dane
Onboard NOAA Ship Ka’imimoana
April 29 – May 10, 2005

Mission: Oceanographic Survey
Geographical Area: Puerto Ayora, Isla Santa Cruz, Galapagos
Date: May 2, 2005

Science and Technology Log

Today is the big day—my first day at sea! I am excited and nervous at the same time; with no experience sailing my main hope is that sea legs will develop quickly for me!  As Academy Bay receded behind us I was a bit wistful at having to leave the Galapagos with so much left unexplored, but I am phenomenally happy to have had the experience to travel here and truly hope to return someday.

Much of my afternoon was spent picking the brain of Patrick Rafter, our Ph.D. student from the Scripps Institution of Oceanography. Patrick boarded the KA in San Diego at the start of this cruise, and is amazingly knowledgeable about marine chemistry.  He is also super patient with all of my questions, and very fun to chat with! You rock, Patrick! I basically asked him for a crash course in oceanic interactions, and this is what he taught me—too cool!

Essentially, the ocean can be viewed as the shallow, warm “mixed layer” at the surface and the deep, cold ocean. The dividing line between these two is called the thermocline, and it is the level at which a rapid change in water temperature occurs. Think about it as a multi-layered cake, with each water layer maintaining a fairly unique and consistent salinity, density and water temperature.  Generally, the mixed layer at the surface is the warmest.  In the equatorial pacific this surface layer has a depth of about 100m, and it is this first layer of oceanic cake that NOAA is most interested in studying.  Normally, the thermocline that divides the high warm layer from the lower cold layer maintains a gradually increasing easterly slope.  Under normal conditions, there is also less convection occurring and less wind is present.  However, under El Nino conditions the dividing line between the two layers becomes more level, creating a deeper, warmer top layer. This increase in depth of the top layer affects marine interactions in several ways.  First, a much larger percentage of surface water is warmer.  Second, more convection is occurring due to the warmer water temperature, and third, more wind is present.  One of the major uncertainties that TAO project data is attempting to explain is the cause of this thermocline change.

Personal Log

After a long Monday and a fabulous shrimp dinner, I feel quite tired and ready to call it a day. Tomorrow, Joe will set up my ship email account; I am really looking forward to being in touch with friends and loved ones at home, and also communicating with my students! It pleases me to report that, surprisingly, my stomach feels more settled at sea then it did when we were anchored in the Bay!  I’m not feeling 100% yet, but definitely well enough to give the treadmill a try tomorrow—and maybe I can even skip the Dramamine… Until tomorrow!