Susan Smith, June 4, 2009

NOAA Teacher at Sea
Susan Smith
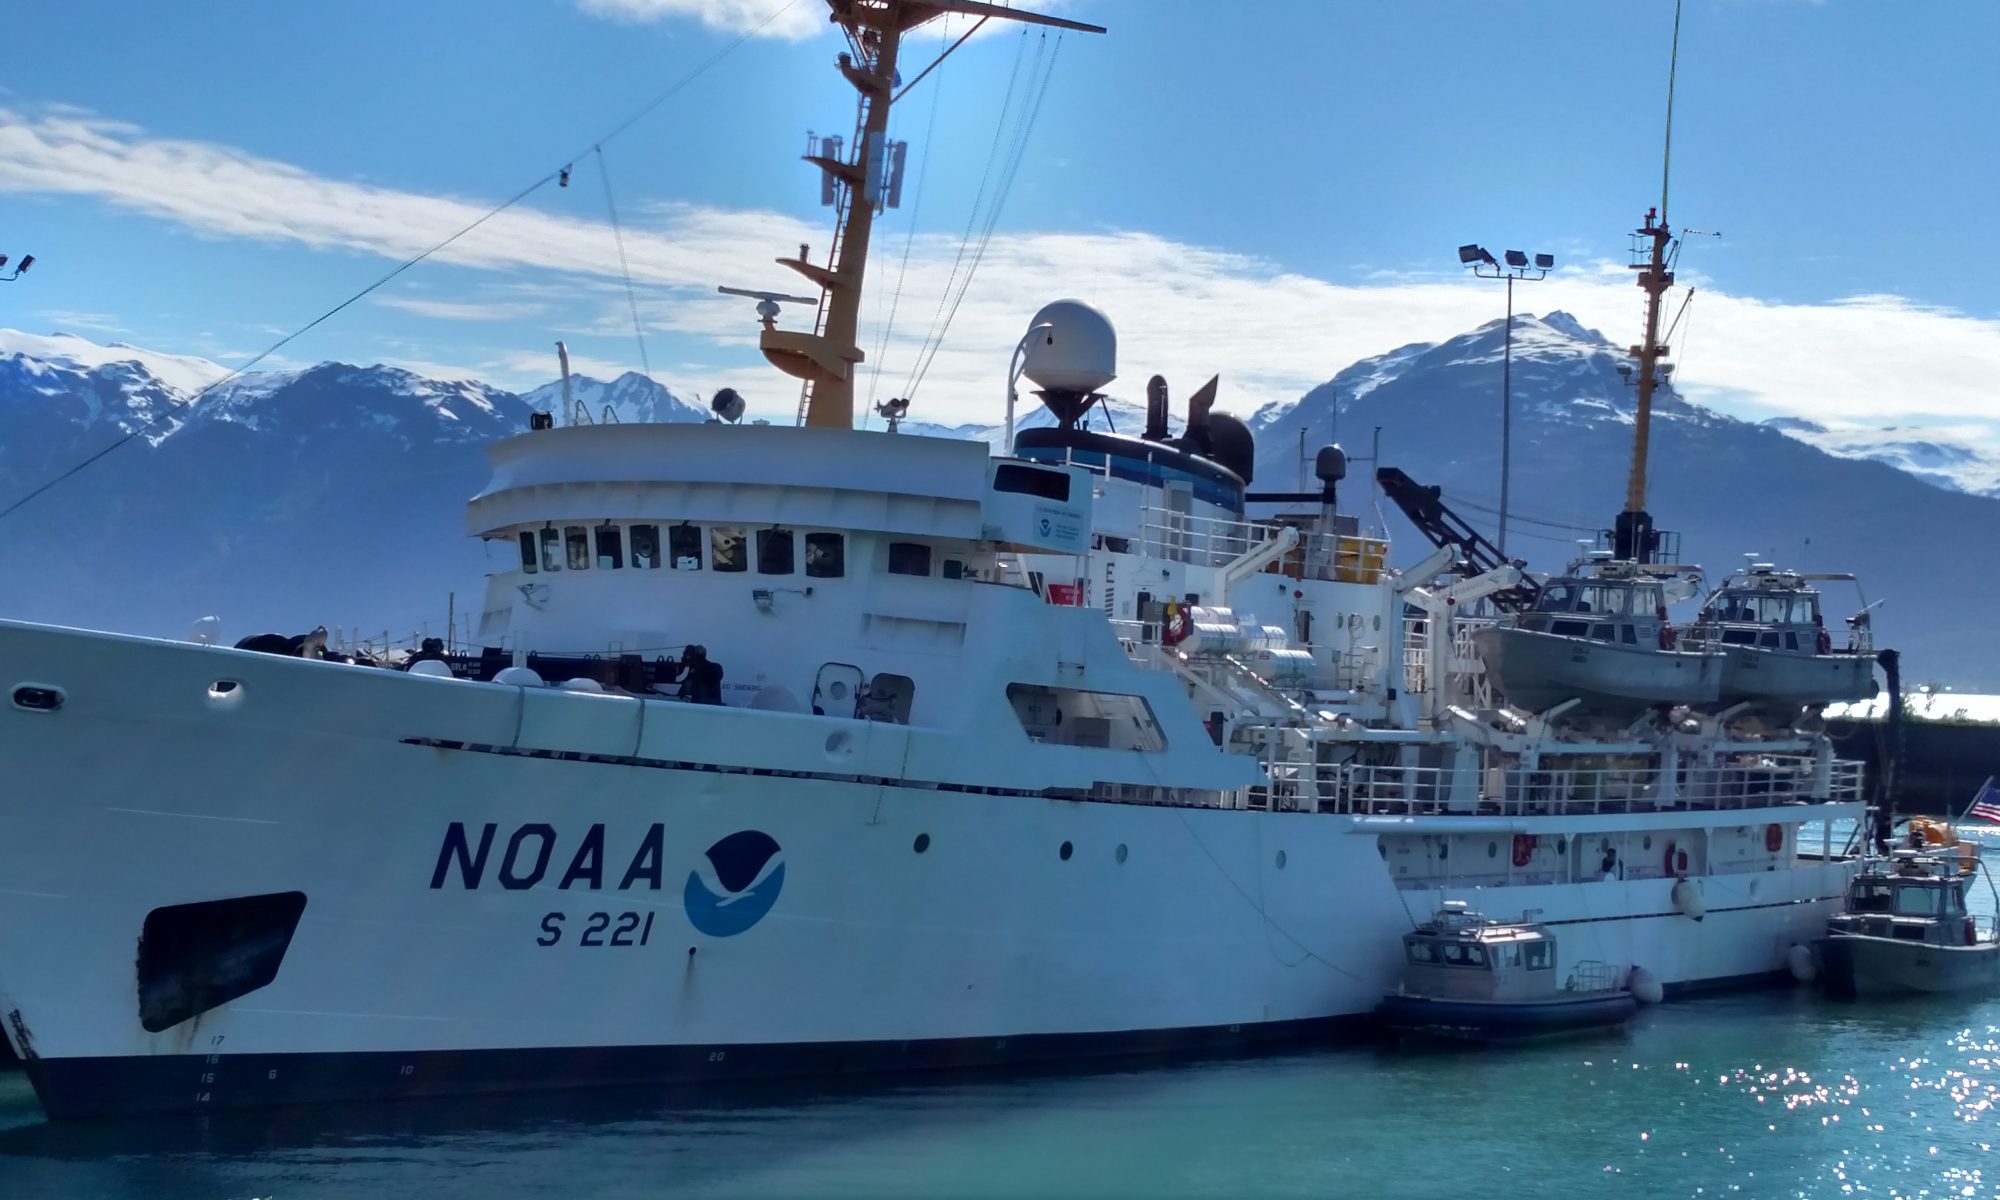
Onboard NOAA Ship Rainier
June 1-12, 2009 

Mission: Hydrographic survey
Geographical area of cruise: Trocadero Bay, Alaska; 55°20.990’ N, 33°00.677’ W
Date: June 4, 2009

Weather Data from the Bridge 
Visibility: 10 nautical miles
Wind: light
Temperature 11.1 C (52 F)
Cloud Cover: FEW 1/8-2/8

A nautical chart indicating underwater cables

Science and Technology Log: Bottom Sampling 

This morning I spent time in the Plot Room, and on the Fantail, involved in bottom sampling. The Plot Room has nine work stations with at least two screens per technician. The airplane symbol is the location of the Rainier and the colored dots show locations of bottom sampling areas. One purpose bottom sampling serves is to determine areas suitable for anchoring.

The clamp shell being retrieved

The chart to the right shows there is an underwater cable area (pink dotted lines) from which we cannot take samples, because it could accidently get damaged, thus rendering residents without power. The numbers shown on these When the ship takes bottom samples, from the Fantail, it uses a spring loaded clamp shell device. It is attached to an A frame and uses a winch to lower it into the sea by cable. The operator calls out the depth, using a cable counter, as it is lowered into the water and when it raised. This enables the plot room to know when a sample is coming and it verifies the information received remains accurate.  The numbers on these charts indicate water depth in fathoms (1 fathom=6 ft.). As you can see there are drastic dropoffs in some locations. 

Identifying the samples: small coarse pebbles

If the cable is not straight down, the ship must move around it, avoiding the screws (propellers) at all costs. When the clamp hits bottom it scoops up the debris under it immediately and is brought back to the surface. When the sample arrives at the top it is shaken to release a majority of the water. Then it must be dismantled to see the solid matter inside. This is a two person job, as it is heavy and impossible to control for just one person. One holds the spring loaded clamp shell, the other takes off the sample section by pulling on either side of the device.

Identification chart for the samples

Because safety is always an issue the clamp must be kept from swinging once the collection unit is removed. The items found in the sampler are placed on the chart (shown to the right) to make sure identification is accurate. The chart is divided into sand, gravel, and pebbles. Each type of rock found is divided further into fine, medium, and coarse. This information is relayed to the plot room where someone labels the survey chart in the appropriate location. In the first four samples green, sticky mud was identified near the coastline of Ladrones Island, Madre de Dios Island, and on the southwestern arm of the Prince of Wales Island. These were deep areas where people are not likely to anchor their boats. In the sixth sample we were in fairly shallow water and sampled gritty sand and small pebbles.

This sample was full of sand and some pebbles.

Sometimes the water arrives only with living things in the sampler. Samples eight through ten provided us with living things. Shells with little creatures inside were found in one sampling, and in another the only item was a black sea star. Finally after three such samples in the same location we moved on to the next location. This is a somewhat tedious process when the samples do not provide a great deal of useful data. However, that in itself gives sufficient information as to what is NOT in a location. Now imagine being charged with this assignment is an area where surveys have either never been done, or it has been decades since the previous survey. Remarkably the survey charts are fairly accurate, even from when lead weights and ropes were used to survey. NOAA certainly has a daunting task when it comes to surveying Alaska.

Personal Log 

This sample had only a little black sea star!

Yesterday, and today, allowed me the opportunity to see the technical aspects of the Rainier’s mission. Small sections of the oceans and bays are meticulously mapped and charted for use by recreational boaters, the fishing industry, large shipping companies, and the military. Without the information gleaned by the people and ships of the NOAA Corps our waters would continue to go uncharted, perhaps unused, and remain hazardous to all. I am amazed at the patience needed for this work, but it is well worth their efforts to provide the necessary tools to keep our waterways safe for everyone.

Jack on the bow
Jack on the bow

I was discussing interesting things I noticed on the Rainier with several of the officers. Did you know there are two flags we fly on the NOAA ships? There is the Jack, a flag with the 50 stars and blue field, and the Stars and Stripes, our nation’s flag. When it is flown on a ship it is called an Ensign. The Jack is flown on the Jackstaff (origin 1865-1895) located on the ship’s bow. The Ensign is flown on the fantail while in port or anchored at sea. I suppose I have now become a student of vexillology, the scholarly study of flags. 
Lollie Garay, May 18, 2009

NOAA Teacher at Sea
Lollie Garay
Onboard Research Vessel Hugh R. Sharp
May 9-20, 2009 

The camera is attached to the dredge

Mission: Sea scallop survey
Geographical Area: North Atlantic
Date: May 18, 2009

Weather Data from the Bridge 
Scattered showers, thunderstorms
Temp: 9.28˚ C
True wind: 13.4 KT

Science and Technology Log 

Today a video camera was attached to the dredge.  Using the camera they are able to see when the dredge is actually on the ground to determine the amount of bottom contact.  It is important to verify sensors like these anytime you work in science. The inclinometer records angle changes that we can interpret into a time on bottom which can be used to calculate a tow distance or bottom contact. This is compared to the tow distance calculated from the GPS recorded by FSCS.   Unfortunately, the inclinometer angle change is not abrupt enough to determine the start time, so the camera is used to determine the amount of time before we start recording tow distance with FSCS.

Looking for crabs in a pile of Starfish is harder than you think!

We have two days of sampling left and then we begin to clean and pack. The first dredge today brought up so many sand dollars that they had to shovel some away before they could even secure the dredge! By late afternoon we were back into starfish; in all the dredges the scallop count was comparatively small.

Personal Log 

Around 4PM the skies cleared and we had sunshine again! It was a welcome sight after days of fog, cloud cover, and cold. That, along with calmer seas, made for a great day. Sitting on deck in the warmth of the Sun watching the wave action, I reflect all the different moods of the sea I have seen. I also think about all the wondrous animals I have seen; and wonder about how much more life there is that we didn’t see.

Lollie and a heap of Sand dollars!
Lollie and a heap of sand dollars!

Elise Olivieri, May 13, 2009

NOAA Teacher at Sea
Elise Olivieri
Onboard Research Vessel Hugh R. Sharp 
May 9 – 20, 2009 

Mission: Sea Scallop Survey
Geographical area of cruise: Northwest Atlantic
Date: May 13, 2009

Weather Data from the Bridge 
Air Temperature: 12.06 Degrees Celsius
Barometric Pressure: 1026 mb
Humidity: 89%

Here I am holding up a skate.

Science and Technology Log 

Sea Scallops’ number one predator is starfish.  Starfish are very strong. They pry open the shell and then push their stomach inside and devour it.  Starfish are very abundant in the Mid-Atlantic.  Many tows yield hundreds of starfish.  It would be too time consuming to count every one of them so sub-sampling is done to attain an estimate of starfish.  The entire catch is sorted but only a portion of the catch is measured.  This is a good method when there are many starfish and little substrate (trash). The substrate is then collected in buckets and volume can be determined.  The data is then entered into the FSCS computer system.  As I mentioned before FSCS is extremely advanced and is a one-ofa-kind biological data system.  Prior to 2001, Fisheries Surveys information was sent to federal prisons to be entered into a computer data base.  This took an extremely long time to process.  Inmates would get compensated as little as a penny per log sheet. This was dangerous and the data could have been destroyed or lost. Today all data is backed up on a server in three different locations to secure data entries. This long-term study about age and growth of sea scallops helps scientists see a trend in different area’s ecosystems.

I have met some intriguing scientists aboard the Hugh R. Sharp. Shayla Williams is a research chemist for NOAA.  She specializes in fatty acid analysis of Fluke.  A fatty acid analysis is like a fingerprint of what you eat. By studying fatty acid in certain types of fish she can make generalizations about the health of an area. Shayla has done research on NOAA cruises since 2006. She has sailed on the Hudson Canyon Cruise, the Fall Fish Survey, and the Spring Fish Survey to name a few.  It takes a whole crew to run a ship and the Hugh Sharp has a very sharp crew. Wynn Tucker is an Oceanographic Technician aboard the Hugh R. Sharp. She has worked for NOAA, EPA, and the Navy. She loves being out on the open water and I don’t blame her.  It is magnificent to look out and be surrounded by blue as far as the eye can see. A.J. Ward is another crewmember aboard the Sharp. He works the inclinometer which lets the scientists know of the dredge is in the right spot on the bottom of the ocean floor.

Using the FSCS to record data about a scallop.

Personal Log 

Today was a great day! It was beautiful weather and I got a chance to talk with some of the crew members on the Sharp. I saw a whole school of dolphins less than three feet from the boat.  It was incredible!  I ran up to the bridge to get a better look and saw a couple of Finback whales as well. It is extremely hard to get pictures because they surface for a few seconds and then dive back under water.  There are many fish in this area known as the Elephant Trunk. I can’t wait for tomorrow!  Another exciting day where I have the opportunity to be working with cutting-edge technology and incredible scientists.  For now I can’t wait to get some sleep.

Animals Seen Today 

Little Skates, Goose Fish, Gulf Stream Flounder, Sand Dollars, Sea Mice, Razor Clams, Surf Clams, Hermit Crabs, Sea Sponge, Red Hake, Monk Fish, Cancer Crabs, Sea Scallops, White Back Dolphins, Finback Whales, and Starfish.

Elise Olivieri, May 11, 2009

NOAA Teacher at Sea
Elise Olivieri
Onboard Research Vessel Hugh R. Sharp 
May 9 – 20, 2009 

Mission: Sea Scallop Survey
Geographical area of cruise: Northwest Atlantic
Date: May 11, 2009

Weather Data from the Bridge 
Air Temperature: 11.83 Degrees Celsius
Barometric Pressure: 1021 mb
Humidity: 83%

The dredge
The dredge

Science and Technology Log 

There were 5 tows today on my  shift. I discovered open areas have far fewer sea scallops in each tow compared to closed areas.  In the open areas each catch was mostly starfish and cancer crabs. In the closed areas there were many sea scallops and various fish collected. Five scallops from each basket collected were processed for weight, length, gonad weight, and meat weight.  The sex of each sea scallop is also identified and all data is entered into the FSCS computer system.  The sea scallop shells were labeled and stored away for further identification.  If the sea scallops rings are clear and visible, lab tests can be done to identify its exact age and health. The Nordic Pride which is a commercial vessel contacted us today. The Nordic is working its way through the areas the Hugh R. Sharp already sampled.  The Sharp will compare tows with the Nordic. The Nordic surveyed with NOAA research vessels before and is taking this opportunity to survey with NOAA again. In the next few days we expect to see the Nordic Pride a few miles away. 

Personal Log 

A scallop opened up—the bright orange thing is its gonad and indicates it’s a female (they’re white in males).
A scallop opened up—the bright orange is its gonad and indicates it’s a female (white in males).

Today I feel much more confident about the tasks at hand. I have a lot of support from the crew and the Watch Chief. I am always up for new assignments and am very confident I can complete them correctly. Around 5:30 AM I saw about 12 white-sided dolphins. It was incredible. They are curious and fast animals.  They swarmed around the Hugh Sharp for a while until they got bored with us and continued on their way. Not long after the dolphins appearance 2 Finback whales surfaced. What an incredible night. I hope to see more dolphins and whales and hopefully get a picture of them.

Animals Seen Today 

Starfish Sea Scallops, Horseshoe Crabs, Hermit crabs, Cusk-eels, White Sided Dolphin, and Finback Whale.

Sea stars and sea scallops!

Elise Olivieri, May 10, 2009

NOAA Teacher at Sea
Elise Olivieri
Onboard Research Vessel Hugh R. Sharp 
May 9 – 20, 2009 

Mission: Sea Scallop Survey
Geographical area of cruise: Northwest Atlantic
Date: May 10, 2009

Weather Data from the Bridge 
Air Temperature: 16.3 Degrees Celsius
Barometric Pressure: 1019 mb
Humidity: 78%

Research Vessel Hugh R. Sharp

Science and Technology Log 

Today around 08:00 we set sail to begin the Sea Scallop Survey that will be conducted on this cruise.  This annual series of quantitative data is collected to determine the distribution and abundance of Sea Scallops. This survey will randomly collect sea scallops from Virginia all the way to Canadian waters. The Chief Scientist and his field operations officers randomly selected stations with in depth boundaries called strata. These selections are either in closed areas where commercial fishing is prohibited, or open areas where commercial fishing is allowed. Areas may be closed to protect the population growth for 2-3 years.  The government will most likely allow closed areas limited access with recommendations from NOAA.  Samples of sea scallops are taken randomly by using a dredge.

The dredge is 8 feet wide and 20 feet long.  It has a metal frame with a ring bag off the back.  Each ring is 2 inches in diameter and the bag is lined with a 1.5 inch twine mesh liner.  The bag is closed on the top and open on the bottom.  This survey consists of three Legs.  Leg I will complete approximately 200 tows.  Each tow is deployed to the bottom of the sea floor.  An inclinometer is used to ensure the dredge is completely at the bottom of the sea floor. This instrument measures time on the bottom.  If you know your average speed and multiply it with time this equals the distance towed on the bottom. Timestamps are matched up between the data collected at FSCS and the inclinometer.  Each tow lasts for 15 minutes at a speed of 3.8 knots.  Tows can be as shallow as 20 meters, and as deep as 150 meters.  After a tow is pulled up from the sea floor, 4 to 6 people manually sort through the catch and pull out Sea Scallops, Starfish, Cancer Crabs, and all fish.  All samples that are collected are placed into baskets.  The baskets are weighed and sea scallops and fish are measured. 

Personal Log 

Sorting scallops brought up by the dredge

Today I spent most of the day feeling sea sick.  I thought it would never end.  Now I feel like a million bucks.  It took me a little while to get my sea legs. Today I learned so much.  I spent most of the day asking a lot of questions and watching everyone closely.  I work the night shift from 12:00 AM to 12:00 PM. There is much excitement when a tow comes in and is emptied on the sorting table. The crew gets excited to see what we brought up. Today we deployed 9 tows on my shift.  We had quite a few clean tows and many muddy tows. A clean tow has many scallops and very few mud clumps.  Life at sea is not easy, it is hard work. The living conditions are great on the Sharp. The galley is stocked with anything you can imagine.  Meals are excellent and snacks are a part of sea life. My stateroom is very comfortable and the showers are very nice too.

I really enjoy sea life. The scenery is incredible.  At night you can see the moon so clearly and the light gently reflects off the rolling waves.  During the day there is blue sea for miles.  It is very relaxing.  Everyone is so nice and willing to explain how things are done.  I feel great and I am looking forward to resting for a while.

Animals Seen Today 

Sea Scallops, Starfish, Black Sea Bass, Hermit crab, Spider Crab, Sea Squirts or Tunicates, 4 Spot Flounder, Goosefish, Northern Sea Robin, and Scup.

Lollie Garay, May 10, 2009

NOAA Teacher at Sea
Lollie Garay
Onboard Research Vessel Hugh R. Sharp
May 9-20, 2009 

Mission: Sea scallop survey
Geographical Area: North Atlantic
Date: May 10, 2009

The dredge is hoisted to the sorting table

Weather Data from the Bridge 
Stationary front persists
West winds 10-20KT Seas 4-6 ft

Science and Technology Log 

We began our shift today sampling in an area called Del Marva Closed Area, which is an area currently closed to scallop fishing. We conducted 8 dredge hauls last night in spite of the turbulent weather that pursued us. But today, we had calmer seas and beautiful blue skies.

The serious work of sorting and measuring the catch begins right after the dredge is brought up and secured. As it is coming up, someone on either side of the dredge uses a rake to shake the net which allows the catch to fall out. After the net is secured, readings are taken using from a sensor mounted to the dredge. The sensor is called an inclinometer; it measures the dredge angle during the 15minute tow.  This allows the scientists to calculate the amount of time the dredge is on the bottom. Then I hop on the table to hold a whiteboard with the pertinent station information written on it next to the catch which is photographed for documentation. Then the frenzy begins! I leave and someone else gets on the sorting table to rake the catch towards waiting sorters who have several buckets and baskets ready.

The sorting begins!
The sorting begins!

The catch is a mixture of scallops, crabs, fish, lots of starfish, assorted other specimens and sometimes sand. We are primarily sorting out sea scallops and fish, but have had some stations that require us to sort out crabs as well. We work quickly to separate the catch which is then taken into the wet lab for measurement. I have been working with Larry Brady from NOAA Fisheries, learning how to measure scallops using the FSCS system. The FSCS is the Fisheries Scientific Computer System which is a collection of integrated electronic devices used to gather and store station and biological data. FSCS uses touchscreen monitors, motion compensation scales and electronic measuring boards. I feed Larry the scallops one after the other as he measures them using a magnetic wand. This information is automatically recorded into the data base. Last night we had a large number of scallops to process. However, today we have seen less and less; in fact we had one catch with none! The fish are not as plentiful either although we have seen various different specimens.

Starfish are plentiful on this catch!

There are also special scallop samples that need to be processed. First, the scallops are cleaned with wire brushes. Then they are weighed in their shells. After this is recorded, they are opened to remove the meat and gonads, which are weighed separately. This information provides us with the gender of the scallop and can approximate their age. I dry the shells and number them. Then I put them into a cloth sack, tag them with identifying information and put them into the deep freeze.

The fish are also weighed and their species is recorded. Sometimes specimens need to be counted (I counted small crabs today).  Once all the measurements are taken, everything is washed down! That includes the deck, the sorting table all the catch buckets, the FSCS measuring boards and the lab floors. We are then ready for the next dredge haul which follows approximately 20-30 minutes later. This pace continues throughout the shift, barring any mechanical or weather issues.

Personal Log 

Lollie and Larry Brady scrub scallop shells for special samples.

I am very impressed by the precision of the work that the science team does. As I waited for the dredge to unload a catch this evening I reflected on how everyone does their job quickly and efficiently. It’s something I never fully appreciated – that there are people out on the seas doing this very thing all the time! Already in one full day, they have taught me so much about how the fisheries system works, and they have expanded my knowledge of different marine organisms. Even as we sort quickly through the catch, they are always identifying specimens to me and answering my questions.

Loligo Squid
Loligo Squid

One of the most amazing sights for me has been the incredible number of starfish that each catch brings up! I have never seen so many, and I am learning about the different types. I am also learning how to shuck scallops for the galley for dinner. So far this has not been strength of mine, but I am determined to master this skill! By the way, our lunch today was scallop soup! The beautiful sunset today gave way to the almost-full moon shining on the seas. My shift is over for tonight, I’d best get some sleep.

Animals Seen Today 

Dolphins—made a quick but too brief appearance alongside the ship today. I caught a glimpse as they raced by. Polka dot Kuskeel; Baby Goosefish; Loligo Squid (pronounced Lollie go!) Snake Eel; and Clear Nose Skate.

Susie Hill, July 25, 2007

NOAA Teacher at Sea
Susie Hill
Onboard NOAA Ship Albatross IV
July 23 – August 3, 2007

Mission: Sea Scallop Survey
Geographical Area: North Atlantic Ocean
Date: July 25, 2007

Weather Data from the Bridge 
Air Temperature: 20.8 ° C
Sea Temperature: 21.8 ° C
Relative Humidity: 93%
Barometric Pressure: 1022.4 millibars
Wind Speed: 5 knots
Water Depth: 58 meters
Conductivity: 44.91 mmhos
Salinity: 31 ppt

Science and Technology Log 

It’s the morning after my first shift, and surprisingly, I still have energy! It was so much fun! It took us about 8 hours to get to our first tow station, and then we went right to work. At each tow station, the dredge is emptied out onto the deck for us to sort. In addition to the standard sampling to assess the stock, scientists request certain species samples for additional research before each cruise. The samples that are being pulled this trip are scallops, skates, hake fish, starfish (some of us call them sea stars), and monkfish (or goosefish). So, we pull these out of the catch and the rest is thrown back out to sea. It’s a race from there to get all of the research done before the next tow. The scientists everywhere (including me!) are weighing , dissecting, and recording the data into the FSCS (Fisheries Scientific Computer System). It’s awesome!

One of my stations was to help take the data on the sea scallops. We measured the gonad, meat, and viscera (pretty much everything else in the shell) weights of 5 randomly chosen sea scallops to determine the sex and shell height/meat weight relationships. The shells will be measured back at Woods Hole to determine the age. Do you know how scientists determine the age of a scallop? They count the rings on the outer shell just like you would to determine the age of a tree. We also collected these samples to help with a study being done by Scientist Stacey Etheridge and Melissa Ellwanger from FDA (Food and Drug Administration) to determine PSP (paralytic shellfish poisoning) levels. They are also testing for Alexandrium sp., a dinoflagellate phytoplankton, in the water sample that can also cause PSP in humans.

It is pretty cool that the scientists let us help out at the different stations so we could get a hand in everything that is going on. When I came on, I thought that we were only going to be doing one study- studying just scallops. It turns out that we get to experience so much more!

Mary Ann Penning, July 17, 2007

NOAA Teacher at Sea
Mary Ann Penning
Onboard NOAA Ship Albatross IV
July 9 – 20, 2007

Mission: Sea Scallop Survey
Geographical Area: North Atlantic Ocean
Date: July 17, 2007

Weather Data from the Bridge 
Visibility: 4 nautical miles (nm)
Wind direction: 278 degrees
Wind speed: 6 knots (kts)
Sea wave height: 1 foot
Swell wave height: 3 feet
Seawater temperature: 25.2 degrees C
Sea level pressure: 1017.1 millibars (mb)
Air Temperature: 24.9 degrees C
Cloud cover: hazy

Dvora Hart is counting astropectin, a type of sea star (also called starfish), for sampling.

Science and Technology Log 

For a person who has rarely eaten scallops, I’m really getting an up close and personal look into the lives of these mollusks.  Dr. Deborah, aka Dvora, Hart is our resident scallops’ expert traveling and working on this trip. She has studied scallops for eight years and travels internationally speaking on behalf of scallops everywhere. She is an intermediary between the science side of scallops and with the fishermen and the fishing industry. While incorporating her mathematics background, she works closely with our Chief Scientist Victor Nordahl developing these surveys. Talking with her over the course of the trip and just listening to her wealth of knowledge have taught me a lot about scallops in such a short time.  She is passionate about scallops and knowledgeable about other organisms that we saw on the trip. In a nutshell or should I say “in a scallop shell”, I’ll share what I’ve learned about scallops in just a little less than two weeks.

Scallops have been around for millions of years.  Five to ten million years ago, in the Chesapeake Bay area, there used to be a shallow sea.  Much later, scallop fossils, found by Indians living in this area, were used for bowls.  In fact Virginia’s state fossil is a scallop measuring up to 200 mm, named Chesapecten jeffersonius, obviously named after Thomas Jefferson.  I didn’t even know there were state fossils!

These sea stars, also known as starfish, are classified as Astropecten americanus.

Sea scallops like living in about 40 – 80 meters of water in the Mid-Atlantic. It is neither too warm in the summer nor too cold in the winter at these ocean depths for them to develop. In deeper water, one of their nemesis, Astropecten americanus, a type of starfish, will eat the baby scallops whole. (There are over 100 different species of Astropecten around the world.) Scallops swim, eat phytoplankton, and spawn when their food source is higher in the spring and fall.  They can range in size from a few centimeters to 15 centimeters from their hinge to their tip. The family of scallops includes our Atlantic Sea Scallops, (called Giant Scallops in Canada), Bay Scallops, and Calico Scallops.

In the US, the scallop industry wholesale at the dock brings in about $400 million dollars, while the retail value is worth about $800 million.  All fisheries in the northeast bring in about 1.2 billion dollars and scallops and lobsters are responsible for about one third each, while all other fish comprise the other third.  Full time scalloping permits can range in the three to four million dollar range; one can somewhat understand why these permits would be highly desirable. There are a limited number available.

In 1998, only 12 million pounds of sea scallops were caught in the U.S.  Since 2002, they have been bringing in over 50 million pounds each year.  Why the change?  Part of it is skill, part of it is good luck, but the main reason is that areas were closed for three years to allow the baby scallops to grow to bigger sizes.  In some of our surveyed areas that have been open to harvesting scallops, we have seen fewer and smaller scallops.  In Elephant Trunk, which just opened for scallop fishing in March, we have generally seen more scallops which are bigger. Data collected over time by surveys such as this one have supported the closings and reopening of areas.

This sea scallop survey is collecting data about sea scallops and other species to manage the sea scallop fishery properly in the southern part of the range of sea scallops. Our trip has spanned from New Jersey to the tip of North Carolina and back again. We have targeted underwater areas such as Hudson Canyon, Elephant Trunk, and a station on the edge of Norfolk Canyon to name just a few.  The NOAA National Marine Fisheries Service manages the area from 3 miles to 200 miles across the continental shelf.  The waters from shore to three miles out are managed by the various states and operate under different rules. The restrictions for scallop fishing are managed by a fishery management board comprised of 19 representatives from various states.

Scallop boats are allowed to retrieve about one fourth of the total scallops a year.  If they catch more than that, they fish out too many of the big ones in an area. If they catch too few a year, more will die from natural causes.  It takes about four years to deplete an area of scallops. (The four inch rings in their dredges allow smaller scallops to escape.)

My interview with Dvora has spanned the entire cruise.  As we have asked questions, whether kneeling in the pile on the fantail or in the workrooms or at the dinner table, she has been generous with her information and we have become more aware and knowledgeable about scallops and their economic impact on the US.

Scientists in front of the NOAA map showing the location of the scallop sampling stations.

Personal Log 

Thinking back over the trip, there have been some exciting highlights.  Three that come to mind are the following.  I finally went up to the bridge, about 1:00 AM one morning to see how the operations are run at night. I had been up there during the day and so I was familiar with the equipment during the daylight.  I walked into a quiet, dark room with only red lights showing. (I understand they don’t destroy your night vision.)  The side doors were open and a cool breeze was coming in.  It was hazy outside; I thought I couldn’t see any stars, something I had hoped to see.  The officer in charge said to look straight up and there were definitely some stars to see.  He helped me find the big dipper through the haze.  After craning my neck for awhile, I stepped to the starboard side and I found Cassiopeia, like a big, wide “W” in the sky.  He brought out a star chart to help me identify the constellations. Even though I was tired, it was definitely worth staying up a little later than usual.

Another job I learned how to do was check the inclinometer when the dredge came up on deck. (I had to wear a hard hat for safety.) It is a device which checks the dredge’s towing efficiency. A hand held wand type device transfers information from the inclinometer, which is stored in a protective steel tube at the top of the dredge.  Once back in the workroom, I would download the information onto a computer and print out a copy in graph form.  We could see from the graph if the dredge flipped when it went into the water. If it did, then we would have to turn around and retow.  This happened only twice that I am aware of during the entire trip.  The Chief Scientist ultimately analyzes all the data.

And I learned how to shuck a scallop! We could shuck scallops for the galley in our down time if the scallops came from an open area.  I’ve had them smoked, baked, sautéed, and even raw, marinated in special sauces.  Not that I’m a connoisseur now, but I’ve certainly learned to enjoy them.

Questions of the Day 

Estimate how many miles we will have traveled on our entire trip.  Remember we have zigzagged on our course from Woods Hole to the southern end of Virginia and back.  We left Woods Hole on the afternoon of July10th and we will be returning at 7:00 AM on Friday, July 20th.

How many gallons of diesel fuel does the ship hold? The ALBATROSS IV is a 187 foot long vessel with a breadth of 33 feet, and a draft of 17 feet 3 inches.  (It displaces 1115 tons of water.)

How does the ship get fresh water?

Patti Conner, August 4, 2006

NOAA Teacher at Sea
Patti Connor
Onboard NOAA Ship Albatross IV
July 31 – August 11, 2006

Mission: Sea Scallop Survey
Geographical Area: Northwest Atlantic
Date: August 4, 2006

Data: (collected mid-morning) 
Air temperature = 17 C(62.6 F0 )
Water temperature = 19.2 C0 (66 F0)
Weather = hazy
Depth of trawl = 85 meters (remember, a meter and a yard are pretty close)
Water salinity = 31.06 ppm
Wind speed = 10.56 knots

I am working in the Biology Lab which is located on the back deck of the ALBATROSS IV

Science and Technology Log 

The 12 hour shift is going very well. It is a little cooler out here than I expected, but the water temperature does affect the air. It is quite foggy today as we continue to travel northeast around Georges Bank. We have been in a little deeper water today, and have collected fewer scallops but we continue to bring in fish and many broken mollusk shells. Surprisingly, we brought up more algae than before even though the water is deeper. The main fish we are collecting are: Flounder, Hake, Skates, Sculpin, and Goosefish (also know as Monk Fish). I will be sending some pictures of the fish as well as some more invertebrate pictures.

Personal Log 

I miss being at home and respect those who are at sea working. It is demanding work, but when the sun rises over the water it is an impressive site and makes everything seem worthwhile. I wouldn’t care to be out here in the winter, but the boat and crew are except for a few weeks of the year. Next time we have a snow day, I’ll be thinking of my friends out here on the boat in howling winds. Today we had a little time between dredging so I was able to come up with several new labs for next year. My students will have a few new labs for our Under The Sea Unit. We will have some fish, and reptile (Sea Turtle) identifications to make using taxonomic keys. I am also working on a Squid dissection lab in addition to the Starfish dissection lab. Of course there will be a lab on Scallops (no, we are not going to eat them!).

Invertebrate identification from previous log = Echinoderms (Sunstars), and Vertebrate identification = Me! 

What invertebrate is this?  Look at the number of shells.  What are the small black spots?

connor_log3a

Patti Conner, August 2, 2006

NOAA Teacher at Sea
Patti Connor
Onboard NOAA Ship Albatross IV
July 31 – August 11, 2006

Mission: Sea Scallop Survey
Geographical Area: Northwest Atlantic
Date: August 2, 2006

Data: (collected mid-morning) 
Air temperature = 17 C0 (62.6 F0 )
Water temperature = 15.5 C0 (60 F0)
Weather = sunny, windy
Depth of trawl = 45.4 meters (remember, a meter and a yard are pretty close)
Water salinity = 31.54 ppm
Wind speed = 13.52 knots

NOAA Teacher at Sea, Patti Connor, helps to sort sea scallops aboard NOAA ship ALBATROSS IV.

Science and Technology Log 

Today we are sailing northeast of our sailing position yesterday. We are going to circle Georges Bank counterclockwise. Our dredges today were interesting. We continue to bring scallops in, but my watch team tells me there are more plentiful spots to come.  At one site, we found so many sand dollars that I couldn’t believe my eyes.  This particular species of sand dollar produces a very brilliant green colored pigment which stains everything (starfish, algae, fish and me!).  I am learning to identify the many species of starfish that we bring in.  One of my jobs is to count them at various sites by randomly selecting from the dredge material.  At one site, I was counting hundreds of them.  It’s amazing how well they can hide and are camouflaged in the algae.  Many of the scallops have thick red layers of red algae on them (remember that red algae can grow at deeper depths because the red pigment can trap the minimal amount of sunlight needed for photosynthesis), and they also can be found carrying Porifera (sponges) on them which also helps them to be camouflaged.

Personal Log 

I do love it out here. My inner ear and brain has adjusted to the perpetual motion of the boat. I have not had a problem with seasickness yet.  It has helped that the weather has been nice. I am also doing well with the midnight to noon work schedule.  It is a little funny to see the fog roll across the deck of the boat in the darkness of the night.  Sunrise is my favorite time as the light changes how everything looks, especially the dredge samples, and it is nice to see the waves and the great expanse of the water.

Yesterdays invertebrate sample: Starfish (phylum = Echinodermata).

Today’s invertebrate sample: starfish!