Heather O’Connell: Sound in Seawater and Sleeping at Sea, June 8, 2018

NOAA Teacher at Sea

Heather O’Connell

NOAA Ship Rainier

June 7 – 21

Mission: Hydrographic Survey

Geographic Area of Cruise: Seattle, Washington to Southeast, Alaska

Date: 6/8/18

Weather Data from the Bridge: Latitude: 48.15° N, Longitude: 122 ° South 58.0’  West, Visibility: 8 nautical miles, Wind: 24 knots, Temperature: 14.2° C

Science and Technology Log

I was fortunate enough to sit in on a survey orientation for new survey technicians and junior officers with Lieutenant Steven Loy. He was on Rainier as the Field Operations Officer, F.O.O., in the past and is currently here as an augmenter filling the role of Senior Watch Officer since he has navigated through the Inside Passage several times. In his two hour orientation, he shared a wealth of knowledge and discussed how multibeam sonar and ultrasounds are two opposite ends to the ultrasonic pulse spectrum.

Multibeam sonar sends out sound and measures the time it takes to return to calculate the depth of the ocean floor. The accuracy of the depth data generated from the multibeam sonar relies on the sound speed profile of the water. The combined effects of temperature, salinity and pressure generate a sound speed profile. Because of the inherent importance of this profile, there are several different ways to measure it. The sound velocity profiler measures this right at the interface of the multibeam sonar. C.T.D.s., or conductivity temperature and depth machines, measure water profile while the ship is stopped. M.V.P.s, or moving vessel profilers, take the water profile as the vessel is moving. Lastly, XBTs are expendable bathythermographs that measure temperature while the ship is in motion.

Sound is affected by different variables as it is energy that travels through a medium as a wave. Lieutenant Loy shared an informative website, The Discovery of Sound in the Sea, where I was able to enhance my understanding. Sound can travel through a liquid, such as water, a gas like air, or a solid like the sea floor. On average, sound travels about 1500 meters per second in sea water. However, the rate changes at different times of day, various locations, changing seasons and varying depths of the water. By looking at sound speed at one particular place in the ocean, you can determine how the different variables affect this sound. Usually, as depth increases, temperature decreases, while salinity and pressure increase.

A multi-beam sensor has a metal plate receiver and a transmitter perpendicular to one another. This array geometry enhances sound.  The sound velocity profiler is next to the receiver and measures right at the interface. To determine the speed of sound right where the beam is generated, sonar is used to measure speed sound across a known distance. This information is then utilized in the overall determination of the depth of the ocean floor. Once this cast is taken, the Seafloor Information System (SIS), can adjust sonar measurements accordingly.

Another way to measure the sound profile of water includes a C.T. D.  This device measures the conductivity, temperature and depth of the water. Conductivity measures the electrical current of the water. The more dissolved salt, or ions in solution, the greater the conductivity and salinity of the water. The depth of the water is directly related to the pressure of the water. Salinity, temperature and pressure affect the sound speed profile of water. This machine has a high data rate that goes up and down the water column. The titanium C.T.D. operates at a high pressure and costs about forty thousand dollars. This accurate technology can only be utilized when the boat is stopped and is used on the smaller survey launches.

C.T.D. used for sound speed profile of water

A third method of measuring sound profile is the M.V.P., moving vessel profiler, which takes the data when the ship is moving. These are calibrated before a survey begins and are an efficient way to collect data. An expansive crane lowers the metal torpedo with the sensor off the fantail, the overhanging back part of the ship, into the water to collect the data. The fish is programmed to stop twenty meters above the ocean floor, at which point it returns to its docked position. On ship Rainier, the deck department deploys the fish with a cable wire and the plot room with the survey technicians controls the sensor.  

Boatswain Kinyon and Survey Technicians Finn and Stedman releasing the torpedo of the M.V.P. into the water

Another way to collect the sound profile of water with a moving vessel is to use an expendable probe. As temperature decreases, the sound speed decreases. Since temperature is the most important factor affecting the speed of sound, an X.B.T., Expendable Bathythermograph, or expendable probe created by the military. With bathy relating to depth and thermo meaning heat, this measures the temperature of the water at a cost of about one hundred dollars. These probes descend at a known rate, so, depth is a function of time.

Sources – Discovery of Sound in the Sea

Personal Log

We left port yesterday at 16:30, which has been a highlight of my NOAA Teacher at Sea Experience thus far. Before leaving port, all hands were assigned a different assignment to help with the launch. I watched the crew bring in the gangway that connects the ship to the port then disassemble it. The crew with hard hats and orange work vests took down poles and neatly tied up different sections by knotting ropes. We slowly progressed out of the port after a cargo ship passed us.  

The deck crew preparing to leave port

Once the ship picked up speed and the ocean breeze was in my hair, I felt a new kind of freedom. With the Seattle skyline behind us and the beautiful green peninsulas in front of us, I was content to be moving forward. Everyone seemed to feel relieved once we were underway. I felt gratitude as I enjoyed watching the sunset from the flying bridge, the area of the ship above the bridge at the front of the ship.

Seattle Skyline
Seattle Skyline

After sunset, I returned to my berth, or sleeping quarters, located in the bow of the ship on the C-deck. I heard the constant white noise of the propellers that got much louder when the pitch, or angle, of them changed. This sound of seawater combined with the rocking motion of the ship lulled me to sleep on our first night at sea.

20180607_203558.jpg
Sunset

Did You Know?

Juneau, the American capital of Alaska, can only be entered by plane or boat. It is inaccessible by roads due to large mountain ranges on either side.
Helen Haskell: From Raw Data to Processed Data, June 16, 2017

NOAA Teacher at Sea

Helen Haskell

Aboard NOAA Ship Fairweather

June 5 – 26, 2017


Mission: Hydrographic Survey

Geographic Area of Cruise: Southeast Alaska – West Prince of Wales Island

Date: June 16, 2017

Weather Data

Wind:  3 knots from the east (272° true)

Visibility: 6 nautical miles

Barometer:  997.6 hPa

Air temperature: 9 °C

Cloud: 100% cover, 1000’

Location

54°54.4’N  132°52.3’W

Science and Technology Log

It would be easy to assume that once the small boat surveys are conducted and data from the larger sonar equipment on Fairweather is also acquired, that the hydrographers’ work is done and the data can be used to create navigational charts. As I have learned, pretty quickly, there are many parameters that affect the raw data, and many checks and balances that need to be conducted before the data can be used to create a chart. There are also a significant amount of hurdles that the crew of Fairweather deals with in order to get to their end goal of having valid, accurate data.  Some of the parameters that affect the data include tides, salinity of the water, temperature of the water, and the density of the data.

Tides:

Tides play a huge role in data accuracy.  But how do tides work and how do they influence navigational chart making? Tides on our planet are the effect on water due to forces exerted by the moon and the sun.  The mass and the distance from the Earth to these celestial bodies play significant roles in tidal forces. While the sun has a much greater mass than the moon, the moon is much closer to the Earth and it is distance that plays a more critical role.  Gravity is the major force responsible for creating tides. The gravitational pull of the moon moves the water towards the moon and creates a ‘bulge’. There is a corresponding bulge on the other side of the Earth at the same time from inertia, the counterbalance to gravity.  The moon travels in an elliptical orbit around the planet and the Earth travels in an elliptical orbit around the sun. As a result, the positions of the moon to the Earth and the Earth to the sun change and as a result, tide height changes.   The tides also work on a lunar day, the time it takes the moon to orbit the Earth, which is 24 hours and 50 minutes. So high tide is not at the same time in one area each solar day (Earth’s 24 hour day). There are three basic tidal patterns on our planet.  Here is southeast Alaska, the tides generally are what is called ‘semi-diurnal’, meaning that there are two high tides a day and two low tides a day of about the same height. Other areas of the world may have ‘mixed semi-diurnal’ tides, where there are differences in height between the two high and two low tides, or ‘diurnal’ tides, meaning there is only one high and one low tide in a lunar day.   The shape of shorelines, local wind and weather patterns and the distance of an area from the equator also affect the tide levels.  How does this affect the hydrographers’ data? If data is being collected about water depth, obviously tide levels need to be factored in.  Hydrographers factor this in when collecting the raw data, using predicted tide tables.  However, later on they receive verified tide tables from NOAA and the new tables will be applied to the data.

IMG_0211
The tide times of the day

Sound Speed Profiles:

Traveling down through the water column from the surface to the seafloor, several factors can change, sometimes significantly.  These factors include temperature, pressure and salinity.  These variables affect the accuracy of the sonar readings of the MBES (Multibeam Echo Sounders), so have to be factored in to account with the raw data analysis.  What complicates matters further is that these factors can vary from location to location, and so one set of readings of salinity, for example, is not be valid for the whole dataset.  Many fresh water streams end up in the waters off the islands of southeast Alaska.  While this introduction of freshwater has effects on the community of organisms that live there, it also has impacts on the hydrographers’ data.  To support accurate data collection the hydrographers conduct sound speed casts in each polygon they visit before they use the MBES.  The data is downloaded on to computers on the boat and factored in to the data acquisition.  The casts are also re-applied in post processing, typically on a nearest distance basis so that multiple casts in an area can be used.  In the picture below, the CTD cast is the device that measures conductivity (for salinity), temperature and depth.  It is suspended in the water for several minutes to calibrate and then lowered down through the water column to collect data. It is then retrieved and the data is downloaded in to the computers on board.


Data Density:

Hydrographers also need to make sure that they are collecting enough sonar data, something referred to as data density.  There are minimum amounts of data that need to be collected per square meter, dependent on the depth of the sea floor in any given area.  Having a minimum requirement of sonar data allows any submerged features to be identified and not missed. For example, at 0-20 meters, there need to be a minimum of five ‘pings’ per square meter.  The deeper the sea floor, the more the beam will scatter and the ‘pings’ will be further apart, so the minimum of five pings occupy a greater surface area.  Hydrographers need to make sure that the majority of their data meets the data density requirements.

Crossline Acquisition:

After much of the initial raw data has been collected, and many of the polygons ‘filled in’, the hydrographers will also conduct crossline surveys. In these surveys they will drive the small boat at an angle across the tracklines of the original polygon surveys. The goal here is basically quality control. The new crossline data will be checked against the original MBES data to make sure that consistent results are be acquired. CTD casts have to be re-done for the crossline surveys and different boats may be used so that a different MBES is used, to again, assure quality control.  At least 4% of the original data needs to be covered by these crossline surveys.

Shoreline verification:

Low tides are taken advantage of by the hydrographers. If the research is being conducted in an area where the low tide times correlate with the small boat survey times, then a vessel mounted LIDAR system will be used to acquire measurements of the shoreline.  Accurate height readings can be extracted from this data of different rocks that could prove hazardous to navigation.  Notes are made about particular hazards and photos are taken of them.  Data on man-made objects are also often acquired. Below are pictures produced by the laser technology, and the object in real life. (for more on LIDAT: http://oceanservice.noaa.gov/facts/lidar.html)


Night Processing:

Each evening once the launches (the small boats) return, the data from that day has to be ‘cleaned’. This involves a hydrographer taking an initial look at the raw data and seeing if there were any places in the data acquisition that are erroneous.  None of the data collected is deleted but places where the sonar did not register properly will become more apparent.  This process is called night processing as it happens after the survey day. After night processing, the sheet managers will take a look at remaining areas that need to be surveyed and make a plan for the following day.  By 6 a.m. the next day, the Chief Scientist will review the priorities made by the managers and let the HIC (Hydrographer In Charge) know what the plan in for their survey boat that day.

IMG_0281
Night Processing

Personal Log 

Throughout the Science and Technology log in this blog post, I keep referring to technology and computer programs.  What stands out to me more and more each day is the role that technology plays in acquiring accurate data.  It is an essential component of this project in so many ways, and is a constant challenge for all of the crew of Fairweather.  Daily on Fairweather, at mealtimes, in the post survey meetings, or on the survey boats themselves, there is discussion about the technology.  Many different programs are required to collect and verify the data and ‘hiccups’ (or headaches) with making this technology work seamlessly in this aquatic environment are a regular occurrence. I am in awe of the hydrographers’ abilities, not only in knowing how to use all the different programs, but also to problem solve significant issues that come up, seemingly on a regular basis.  Staff turnover and annual updates in software and new equipment on the ship also factor significantly in to technology being constantly in the foreground.  It often eats in to a large amount of an individual’s day as they figure out how to make programs work in less than forgiving circumstances.  Tied to all of this is the fact that there is a colossal amount of data being collected, stored and analyzed each field season.  This data needs to be ‘filed’ in ways that allow it to be found, and so the tremendous ‘filing system’ also needs to be learned and used by everyone.


Word of the day:   Fathom

Fathom is a nautical unit of measurement, and is the equivalent of 6 feet.  It is used in measuring depth.

Fact of the day:

Prince of Wales Island, west of which this research leg is being conducted is the fourth largest island in the United States. 4,000 people live on the island, that is 2,577sq mi.

What is this? 

fullsizeoutput_178

(Previous post: a zoomed in photo of ‘otter trash’ (Clam shell)

Acronym of the day:  

LIDAR: Light Detecting and Ranging


Becky Moylan: Acoustics and Trawling, July 5, 2011

NOAA Teacher at Sea
Becky Moylan
Onboard NOAA Ship Oscar Elton Sette
July 1 — 14, 2011


Mission: IEA (Integrated Ecosystem Assessment)
Geographical Area: Kona Region of Hawaii
Captain: Kurt Dreflak
Science Director: Samuel G. Pooley, Ph.D.
Chief Scientist: Evan A. Howell
Date: July 5, 2011

Ship Data

Latitude 1940.29N
Longitude 15602.84W
Speed 5 knots
Course 228.2
Wind Speed 9.5 knots
Wind Dir. 180.30
Surf. Water Temp. 25.5C
Surf. Water Sal. 34.85
Air Temperature 24.8 C
Relative Humidity 76.00 %
Barometric Pres. 1013.73 mb
 Water Depth 791.50 Meters

July 5, 2011

Science and Technology Log

Work is going on 24 hours here on the ship. The crew have different shifts, so nothing ever stops. It may be 3:00 in the morning, and you’ll see people sorting fish, filtering water, or working the acoustics table.


Acoustics Computer Screen

To improve the accuracy of identifying what organisms are seen on the acoustic system, Sette researchers collect samples from the scattering layers at night using a large trawl net towed from the ship.One important part of the research here is using the acoustic system to find where groups of fish and other organisms are located. This is done with a “ping”, or noise, sent down in the ocean. The sound waves bounce back when they find something, letting scientists know where, and sometimes what, is swimming underneath. Computers keep data on all the different sound waves showing patterns of fish movement. They have found that some groups move upward during the nighttime, and then move back down during the day.

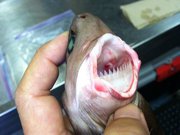
Cookie Cutter Shark
Cookie Cutter Shark
Trawl Net
Trawl Net

Every night on the ship, there is at least one trawl. The method of trawling started back in the 1400’s. Some people use these nets to catch large amounts of fish to sell, and that has been an environmental concern. NOAA is using this method as a scientific sampling, or survey, method to try and help the environment. They are trawling in the Epipalagic Zone (mid to shallow) which is around 200 meters deep, depending on the total depth at location and where the acoustics pick up signals.

Scientists want to find out the status of the smaller life in order to try and predict the outcome of the larger life. Only a small amount is caught for sampling. They weigh, sort, count, and study them. The goal is to be aware of what is happening in this area of the ocean. Some of the species they have found are different types of shrimp, squid, Myctopids, small crabs, and jellies. Last night they wound up with two Cookie Cutter Sharks. These results will then be combined with the measured acoustic data in order to improve the accuracy and effectiveness of acoustic monitoring.

Examining a Trawl Catch
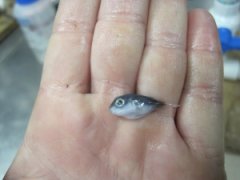
Puffer Fish
Puffer Fish

One scientist from New York, Johnathan, is looking for specific species of Myctopids. He studies them under the microscope and records detailed data found. The Myctopids are sometimes called Lantern Fish. This is because they have organs that produce light. The lights are thought to be a way of communicating with other fish and also as a camouflage. As mentioned earlier, some fish rise to shallower waters at night and the Myctopid is one of these. The reason might be to avoid predators, yet also to follow zooplankton which they feed upon.


Personal Log

Abandon Ship Suits
Abandon Ship Suits

Last night some of us went out on deck to watch the Kona fireworks. I didn’t realize how far out we were until I saw how tiny the little ball of colors appeared. You could see three different areas along the coast where they were shooting off fireworks. As a fourth of July treat, the cooks barbecued on deck and made special deserts. I especially liked the sweet potato pie.

This morning I was out at 6am preparing the CTD for deployment. It is getting easier each time. There are many precautions and steps to make sure the procedure is done correctly and safely. We could only drop it to 200 meters today because this area is shallower here. I watched and learned how to control the computer from the inside. Very impressive!

CTD Screens
CTD Screens

I’m wondering when the ship is going to have another “abandon ship drill”. That’s when we all carry our floatation suits to the upstairs deck and put them on, and it is not easy to do. You lay the suit down, sit on it, and put your legs in first. Then you stand up, pull the suit hood on, then lastly the arms. This is because the hands don’t have fingers. It is quite a funny sight.

I found out today that the 3am trawl ended up with only one fish because a Cookie Cutter Shark had eaten a round hole in the net. This is where they get their name. They always bite a round hole. Some have even eaten a hole out of humans!

Jason Moeller: June 25-27, 2011

NOAA TEACHER AT SEA
JASON MOELLER
ONBOARD NOAA SHIP OSCAR DYSON
JUNE 11 – JUNE 30, 2011

NOAA Teacher at Sea: Jason Moeller
Ship: Oscar Dyson
Mission: Walleye Pollock Survey
Geographic Location: Gulf of Alaska
Dates: June 25-27, 2011

Ship Data
Latitude: 55.58 N
Longitude: -159.16 W
Wind: 14.11
Surface Water Temperature: 7.2 degrees C
Air Temperature: 9.0 degrees C
Relative Humidity: 90%
Depth: 85.61

Personal Log
Anyone who has seen the show Deadliest Catchknows how dangerous crab fishing can be. Fishing for pollock, however, also has its dangers. Unfortunately, we found out the hard way. One of our deck hands caught his hand between a cable and the roller used to pull up the trawl net and hurt himself badly.

Cable
The cable and the roller.

Fortunately, the injuries are not life threatening and he will be fine. The injuries did require a hospital visit, and so we stopped at Sand Point to treat him.

Town
This is the town of Sand Point.
airstrip
Clouds hang over the hills at Sand Point. The airstrip is in the left edge of the photo.

We stayed at Sand Point for nearly 48 hours. What did we do? We fished, of course! We used long lines and hooks, and had a great time!

lines
Bill and Alex cast fishing lines in the harbor. We tied the lines off on the boat and hauled them up from time to time to check the bait.
Alex
Alex with a flounder that he caught! He also caught several cod and a 32-lb Pacific halibut!
cod
Cod and the flounder in a bucket!
Tammy
As with every fishing trip, we also managed to catch things that we didn't mean too! Tammy (the other NOAA Teacher at Sea) especially liked the kelp!
urchin
A few visitors always hitched a ride on the kelp we caught. Here is a tiny sea urchin.
crab
This crab was another hitchhiker on the kelp.
starfish
We were bottom fishing for Halibut, and a starfish, the largest one I've ever seen, went after the bait!

A one-day fishing license in Alaska costs $20.00. We had internet, so five of us went online and bought the fishing passes. Was it worth it?

Halibut
You bet it was! This is the 25-lb halibut I caught! It was AWESOME!!!

We filleted it and had the cooks make it for dinner. With the halibut, we also cut out the fleshy “cheeks” and ate them as sushi right on the spot! It doesn’t get any fresher (or tastier!) than that!

Science and Technology Log
Today we will look at the acoustic system of the Oscar Dyson! Acoustics is the science that studies how waves (including vibrations & sound waves) move through solids, liquids, and gases. The Oscar Dyson uses its acoustic system to find the pollock that we process.

The process begins when a piece of equipment called a transducer converts an electrical pulse into a sound wave. The transducers are located on the underside of the ship (in the water). The sound travels away from the vessel at roughly 1500 feet per minute, and continues to do so until the sound wave hits another object such as a bubble, plankton, a fish, or the bottom. When the sound wave hits an object, it reflects the sound wave, sending the sound wave back to the Oscar Dyson as an echo. Equipment onboard listens to the echo.

The computers look at two critical pieces of information from the returning sound wave. First, it measures the time that it took the echo to travel back to the ship. This piece of information gives the scientists onboard the distance the sound wave traveled. Remember that sound travels at roughly 1500 feet per minute. If the sound came back in one minute, then the object that the sound wave hit is 750 feet away (the sound traveled 750 feet to the object, hit the object, and then traveled 750 feet back to the boat).

The second critical piece of information is the intensity of the echo. The intensity of the echo tells the scientists how small or how large an object is, and this gives us an idea of what the sound wave hit. Tiny echos near the surface are almost certainly plankton, but larger objects in the midwater might be a school of fish.

good fishing
An image of the computer screen that shows a great number of fish. This was taken underneath the boat as we were line fishing in Sand Point.
poor fishing
The same spot as above, but with practically no fish.
fishing
An image of the screen during a trawl. You can actually see the net--it is the two brown lines that are running from left to right towards the top of the screen.

One of the things that surprised me the most was that fish and bubbles often look similar enough under water that it can fool the acoustics team into thinking that the bubbles are actually fish. This is because many species of fish have gas pockets inside of them, and so the readout looks very similar. The gas pockets are technically called “swim bladders” and they are used to help the fish control buoyancy in the water.

swimbladder
Swim bladder of a fish.

Species Seen
Northern Fulmar
Gulls
Cod
Pacific Halibut
Flounder
Sea Urchin
Crab
Kelp

Reader Question(s) of the Day
Today’s questions come from Kevin Hils, the Director of Chehaw Wild Animal Park in Chehaw, Georgia!

Q. Where does the ship name come from?
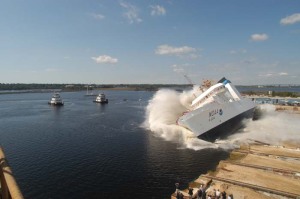
A. Oscar Dyson was an Alaska fisheries industry leader from Kodiak, Alaska. He is best known for pioneering research and development of Alaska’s groundfish, shrimp, and crab industry. Dyson was a founding partner of All Alaskan Seafoods, which was the first company actually controlled by the fishermen who owned the vessel. He also served on the North Pacific Fisheries Management council for nine years. He is in the United Fishermen of Alaska’s hall of fame for his work. The ship was christened by his wife, Mrs. Peggy Dyson-Malson, and launched on October 17, 2003.

Dyson
Oscar Dyson
launch
The launching of the Oscar Dyson

Q. How do you see this helping you teach at Knoxville Zoo, not an aquarium?
A. This will be a long answer. This experience will improve environmental education at the zoo in a variety of different ways.

First, this will better allow me to teach the Oceanography portion of my homeschool class that comes to the zoo every Tuesday. For example, I am in the process of creating a hands on fishing trip that will teach students about the research I have done aboard the Oscar Dyson and why that research is important. Homeschool students will not just benefit from this experience in Oceanography, but also in physics (when we look at sound and sonar) and other subjects as well from the technical aspects that I have learned during the course of the trip.

Scouts are another group that will greatly benefit from this experience as well. The Girl Scout council wishes to see a greater emphasis in the future on having the girls do science and getting real world experiences. While the girls are still going to desire the animal knowledge that the zoo can bring, they will also expect to do the science as well as learn about it. My experience aboard the Dyson will allow me to create workshops that can mimic a real world animal research experience, as I can now explain and show how research is done in the field.

The same can be said of the boy scouts.

In addition, one of the most common badges that is taught to boy scout groups that come in is the fish and wildlife merit badge. In the past, the badge has primarily focused on the wildlife aspect of this topic. However, I now have the knowledge to write and teach a fisheries portion for that merit badge, as opposed to quickly covering it and moving on. This will enrich future scouts who visit the zoo for this program.

A major focus for all scouts is the concept of Leave No Trace, where scouts are supposed to leave an area the way they found it. The fisheries research being done aboard the Dyson is focused toward that same goal in the ocean, where we are attempting to keep the pollock population as we found it, creating a sustainable fishery. The goal aboard the Dyson is similar to the goal in scouting. We need to be sustainable, we need to be environmentally friendly, and we need to leave no trace behind.

School children on field trips will greatly benefit, especially students in the adaptations section. There are some bizarre adaptations that I never knew about! For example, sleeper sharks slow, deliberate movement coupled with their fin and body shape basically make them the stealth fighter of the fish world. They can catch fish twice as fast as they are! Lumpsuckers are neat critters too! This knowledge will enhance their experience at the zoo during field trip programs.

Finally, I can pass the knowledge from this experience on to my coworkers. This will not only better the experience of my students, but it will also improve the outreach programs, the bedtime programs, the camps, and other programming done at the zoo.

Q. Are you old enough to be on a ship? You look like you’re 13???!!!!
A. SHHHHHHH!!!! You weren’t supposed to tell them my real age! They think I’m 24!

Dan Steelquist, July 16, 2009

NOAA Teacher at Sea
Dan Steelquist
Onboard NOAA Ship Rainier
July 6 – 24, 2009 

Mission: Hydrographic Survey
Geographical Area: Pavlov Islands, Gulf of Alaska
Date: July 16, 2009

Weather Data from the Bridge 

Latitude: 55°13.522’ N Longitude: 161°22.795’ W Visibility: 10 Nautical Miles Wind Direction: 174° true Wind Speed: 15 knots Sea Wave Height: 0-1ft. Swell Waves: N/A Water Temperature: 8.3° C Dry Bulb: 10.6° C Wet Bulb: 10.6° C Sea Level Pressure: 1021.0 mb

Science and Technology Log 

The primary mission of the Rainier is to gather hydrographic sounding data. For this leg of the summer field session, that data collection is done by a number of small launches that go out to work each day from Rainier. On a typical day four twenty-nine foot survey launches are deployed from the ship, each with an assigned area to gather data. Each launch is equipped with a multibeam sonar device that sends sound signals to the bottom and then times how long it takes for the signal to return to the receiver.  Knowing how fast the signal will travel through the water, the length of time the signal takes to leave and return to the sounder determines the depth of the water at that point.

Here I am preparing the CTD to take a cast.

For many years sonar devices have only been able to measure the water depth directly below a survey vessel.  Now, with multibeam sonar, survey vessels can cover a larger swath of seafloor with hundreds of depth measurements being taken at a time. Once the data is processed, a “painted” picture of the bottom surface can be generated. Once a launch is in its assigned work area, the sonar is turned on and the boat goes back and forth in a prescribed pattern to gather data on water depth, essentially providing total coverage of what the seafloor looks like in that area. The coxswain (person driving the launch) has a computer screen with a chart of the coverage area and steers the launch over the planned area. As the launch moves along the path of sonar coverage its path shows up on the screen as a different color, letting the driver know where the boat has been.

In order for data to be interpreted accurately, there are many steps in the process from data acquisition to actual placement on a nautical chart. There is one very important piece of data that needs to be gathered in the field as the launches do there work with the sonar. Sound waves can vary in speed as they travel through water, depending on certain conditions. In order for accurate depth readings to be acquired, those conditions must be known. Therefore throughout the data gathering session, hydrographers must acquire data on the condition of the water. That is where a CTD cast comes in. CTD stands for conductivity, temperature, depth. Every few hours a CTD cast must be done in order to accurately interpret the data gathered by the sonar. The device is lowered over this side of the launch and allowed to sink to the bottom. As it descends, the CTD gathers data at various depths. When recovered the CTD is connected to a computer and its data is integrated with the sonar data to acquire more accurate depth readings.

Personal Log 

I’ve been on the Rainier now for twelve days. While there are certain routines on board the ship, there isn’t much routine about the work these people do. I continue to be impressed with how everyone applies their skills to their work in order for data to be gathered. Much of the area where we are working has never been charted before and much of what has been charted was done before World War II with lead lines (dropping a piece of lead attached to a line, and counting the measured marks on the line until it hits bottom). The details acquired by multibeam sonar are truly amazing. We will be here in the Pavlof Islands for a few more days and then head back to Kodiak, where I will get off the ship. Not long to go, but there is still much for me to learn!

Something to Think About 
How long would it take you to paint an entire house with dots from a very small paintbrush? That would be like using a lead line to gather depth information. How long would it take you to paint an entire house with a very small, narrow paint brush? That would be single beam sonar. How much time could you save by using a wide paintbrush? That would be multibeam sonar.

Mary Anne Pella-Donnelly, September 15, 2008

NOAA Teacher at Sea
Mary Anne Pella-Donnelly
Onboard NOAA Ship David Jordan Starr
September 8-22, 2008

Mission: Leatherback Use of Temperate Habitats (LUTH) Survey
Geographical Area: Pacific Ocean –San Francisco to San Diego
Date: September 15, 2008

Weather Data from the Bridge 
Latitude: 3720.718 N Longitude: 12230.301
Wind Direction: 69 (compass reading) NW
Wind Speed: 12.0 knots
Surface Temperature: 15.056

Computer generated images showing acoustic scattering during the day

Science and Technology Log 

A lot of physical science is involved in oceanographic research.  An understanding of wave mechanics is utilized to obtain sonar readings. This means that sound waves of certain frequencies are emitted from a source.  The concepts to understand in order to utilize acoustic readings are:

  1. Sound and electromagnetic waves travel in a straight line from their source and are reflected when they contact an object they cannot pass through.
  2. Frequency is defined as the number of waves that pass a given point per second (or another set period of time).  The faster the wave travels, the greater the number of waves that go past a point in that time. Waves with a high frequency are moving faster than those with a low frequency. Those waves travel out in a straight line until they contact an object of a density that causes them to reflect back.
  3. The speed with which the waves return, along with the wavelength they were sent at, gives a ‘shadow’ of how dense the object is that reflected the wave, and gives an indication of the distance that object is from the wave source (echo sounder). As jellyfish, zooplankton and other organisms are brought up either with the bongo net or the trawl net, examinations of the acoustic readings are done to begin to match the readings with organisms in the area at the time of the readings.  On the first leg of the survey, there were acoustic patterns that appeared to match conditions that are known to be favorable to jellyfish.  Turtle researchers have, for years, observed certain characteristics of stretches of ocean water that have been associated with sea nettle, ocean sunfish and leatherbacks. Now, by combining acoustic readings, salinity, temperature and chlorophyll measurements, scientists can determine what the exact oceanographic features are that make up ‘turtle water’.
Computer generated images showing acoustic scattering at night.
Computer images of acoustic scattering at night.

Acoustic data, consisting of the returns of pulses of sound from targets in the water column, is now used routinely to determine fish distribution and abundance, for commercial fishing and scientific research. This type of data has begun to be used to quantify the biomass and distribution of zooplankton and micronekton. Sound waves are continuously emitted from the ship down to the ocean floor. Four frequencies of waves are transmitted from the echo-sounder.  The data is retrieved and converted into computerized images. Both photo 1 and photo 2 give the acoustic readings. The “Y” axis is depth down to different depths, depending on the location.  The frequencies shown are as follows for the four charts on the computer screen; top left is 38kHz, bottom left is 70 kHz, top right is 120kHz and bottom right is 200 kHz.  In general the higher frequencies will pick up the smallest particles (organisms) while the lowest reflect off the largest objects. Photo 1 shows a deep-water set of images, with small organisms near the surface. This matches the fact that zooplankton rise close to the surface at night.  Photo 2 gives a daylight reading.

A Leach’s storm petrel rests on the trawl net container.

It is more difficult to interpret.  The upper one-fourth is the acoustic reading and the first distinct horizontal line from the top represents the ocean floor.  Images below that line are the result of the waves bouncing back and forth, giving a shadow reading.  But the team here was very excited: for this set of images shows an abundance of organisms very near the surface. And the trawl that was deployed at that time resulted in lots and lots of jellyfish.  They matched.  Periodically, as the acoustic data is collected, samples are also collected at various depths to ‘ground truth’ the readings.  This also allows the scientists to refine their interpretations of the measurements.  The technology now can give estimates of size, movement and acoustic properties of individual planktonic organisms, along with those of fish and marine mammals.  Acoustic data is used to map the distribution of jellyfish and estimate the abundance in this region. By examining many acoustic readings and jellyfish netted, the scientists will be able to identify the acoustic pattern from jellyfish.

Karin releases a petrel from nets he flew into.

The sensor for the acoustic equipment is mounted into the hull, with readings taken continually.  Background noise from the ship must be accounted for, along with other types of background noise. Some events observed on board, such as a school of dolphins being sighted, can be correlated (matched) to acoustic readings aboard the ship.  Since it is assumed that only a portion of the dolphins in a pod are actually sighted, with the remaining under the surface, the acoustic correlation gives an indication of population size in the pod.  The goal of continued acoustic analysis is to be able to monitor long term changes in zooplankton or micronekton biomass. This monitoring can then lead to understanding the migration, feeding strategies and monitor changes in populations of marine species.

A Wilson’s warbler rests on the flying deck.

Personal Log 

Several small birds have stopped in over the week, taking refuge on the Jordan. Many bird species make long migrations, often at high altitude, along the Pacific flyway.  Some will die of exhaustion along the way, or starvation, and some get blown off their original course.  Most ships out at sea appear to be an island, a refuge for tired birds to land on.  They may stay for a day, a week, or longer. Their preferred food source may not be available however, and some do not survive on board.  Some die because they are just too tired, or perhaps ill, or for unknown reasons. We have had a few birds, and some have disappeared after two days.  We hope they took off to finish their trip. Since we were in site of land all day today, it could be the dark junco headed to shore. ‘Our’ common redpoll did not survive, so he was ‘buried at sea’, with a little ceremony.  About half an hour ago, a stormy petrel came aboard.  He did not seem well, but after a bit of rest, we watched him take off.  We wish him well.

Words of the Day 

Acoustic data: sound waves (sonar) of certain frequencies that are sent out and bounce off objects, with the speed of return an indication of the objects distance from the origin; Echo sounder: device that emits sonar or acoustic waves Dense or density: how highly packed an object is  measured as mass/volume; Distribution: the number and kind of organisms in an area; Biomass:  the combined mass of a sample of living organisms; Micronekton: free swimming small organisms; Zooplankton: small organisms that move with the current; Pacific flyway: a general area over and next to the Pacific ocean that some species of birds migrate along.

Animals Seen Today 
Leach’s Storm-petrel Oceanodroma leucorhoa
Herring gull Larus argentatus
Heermann’s gull  Larus heermanni
Common murr  Uria aalge
Humpback whale  Megapterea novaeangliae
California sea lion Zalophus californianus
Sooty shearwater Puffinus griseus
Brown pelican Pelecanus occidentalis
Harbor seal Phoca vitulina
Sea nettle jellies Chrysaora fuscescens
Moon jellies Aurelia aurita
Egg yolk jellies Phacellophora camtschatica 

Questions of the Day 
Try this experiment to test sound waves.  Get two bricks or two, 4 inch pieces of 2 x 4 wood blocks. Stand 50 ft opposite a classroom wall, and clap the boards together. Have others stand at the wall so they can see when you clap. Listen for an echo.  Keep moving away and periodically clap again. At some distance, the sound of the clap will hit their ears after you actually finish clapping. With enough distance, the clap will actually be heard after your hands have been brought back out after coming together.

  1. Can you calculate the speed of the sound wave that you generated?
  2. Under what conditions might that speed be changed?
  3. Would weather conditions, which might change the amount of moisture in the air, change the speed? 

Ginger Redlinger, July 18, 2007

NOAA Teacher at Sea
Ginger Redlinger
Onboard NOAA Ship Rainier
July 15 – August 1, 2007

Mission: Hydrographic Survey
Geographical Area: Baranof Island, Alaska
Date: July 18, 2007

Weather Data from the Bridge

Visibility: 10 Nautical Miles
Wind directions: 325°
Wind Speed: 10 Knots
Sea Wave Height: 1 – 2 feet
Seawater Temperature: 13.9° C
Sea level Pressure: 1009.2 millibars (mb)
Cloud cover: Partly Cloudy

Science and Technology Log 

Today’s Mariner word: Fiddly (Pronounced Fid-lee) the fiddly is the room above the engine compartment.

Survey Techs Hertzog & Boles prepare to measure sound velocity with CTD.

Wow – what a day. At 0800 hours we were briefed on our day’s work plan.  I was joining an experienced pilot (Coxswain) and two survey technicians on a research boat to take sound velocity readings in an area off the coast of Baranof Island.  First, we had the launch the boats from the ship.  The experience boat crew and I watched as the ship’s deck hands lowered the boats from their racks by crane to the side of the ship at a level that allowed us to climb aboard. (A few feet above water level).  The deck hands held the boat in position from above by crane, and on the sides to keep it from rocking back and forth and bouncing against the ship. Additional hands held ropes attached to the hooks and cables that we were going to release fore and aft hooks once the boat was in the water. Of course, the boat pilot needed to get the engine running right when the boat hit the water to keep it in the correct position against the side of the ship.  Launching while underway is challenging, and must be done correctly in order to ensure everyone’s safety. The boat’s personnel released the hooks and the deck personnel winched the hooks back to the starting positions.  Deck hands on ship held the boat in position with ropes fore and aft.  Once everything on the boat was checked and running the aft line was called in, then the bowline, and we were underway.  This was another example of the amazing teamwork I have witnessed everyday on this ship.

When we arrived at our survey area the technicians used a CTD to take an initial reading of the speed of sound at the surface of the water, then lowered it again to take the same reading at a much lower depth. (If you remember the last journal entry, this is the same process used to correct for the speed on sound on the RAINIER.) The readings are entered into the boat’s computer prior to taking any readings. While we took readings along our survey lines I asked the survey crew a question, “what about large mammals, won’t they interfere with the sonar readings?  The answer was “yes, if a whale is below us it would appear as a shadow on the computer screen. Algal blooms and kelp beds can also affect the quality of the readings.”

Survey Tech Boles monitoring the data recorded by the ELAC transducer

We tracked back and forth across our survey area. The direction and length of each survey line was determined the day before, and provide to the boat’s survey technicians.  No whales, algal blooms, or kelp beds today. Part of NOAA’s mission is to provide useful information to commercial navigators, and that includes fishermen.  We were very careful to adjust our movement across survey lines to avoid interfering with the fishing vessels. During our time on the boat I asked the crew questions about their background, the Coxswain (person who pilots the boat and ensures our safety) has been at sea for over 30 years. He is amazing.  He taught me how to pilot the board correctly.  My first try was not very successful. The second time I was much better.  I guess you could say that he is a good teacher, and a good seaman.

The two survey technicians on board track and record data. They have different backgrounds, but bring important skills to the task of gathering and reading data. The first, a young woman, has a degree in geology and works as a cartographer for the United States Geologic Service.  She is working on this boat this summer. The other is a young man from Tennessee who received his certificate in Geographic Information Systems. I have to admit, without the man who piloted the boat and kept it on a narrow track of water fighting swells, currents, and avoiding fishing boats – the rest of us wouldn’t have been able to take readings. Everyone has something critically important to do.

Coxswain Foye keeping the boat on the correct lines to record data.
Coxswain Foye keeping the boat on the correct lines to
record data.

How did we get the data from the boat to the on-ship computers? The data is cabled in from the boat to the plotting room where all the cartography hardware and software is located. (One way is to plug in a cable and download!) The database contains recent and historical charts made of waters that NOAA surveys. The FOO (remember, Field Operations Officer) showed me a chart created in 1924 of the same area. The technology used back then was lead lines and sextants. They would start by moving to a location, and then drop a lead line until it hit the bottom, counting the fathoms from surface to seafloor.  After recording it, they pulled up the lead line, and then traveled along as straight a path as possible, recorded latitude and longitude, and took another reading.  I didn’t count all the readings taken in this fashion on the old map, but there were well over one hundred readings in the small section we were surveying, and the old map covered a region much greater – the entire coastline and out to sea in the area we are working.  The FOO then did an amazing thing by overlaying the new map readings over the old map – it was amazing how accurate the old map still is!

You can find out more about early navigation and see maps made a long time ago here.

Coast & Geodetic Survey

Soundings (depth readings)

For information about prior work done in this area visit the NOAA photo library.

The need for accurate navigation information is as important now as it was back then.  Personal and commercial craft need to know where it is safe and where it is dangerous.  The FOO and I talked about how nice it would be someday to have a holographic representation of an area you are navigating (whether it is sea, lake, or river) that would allow you to see the bottom of the sea, the coastline, and the cloud layers.  Maybe future mariners, oceanographers, and technicians can make that available for everyone.

Questions of the Day 

Topic 1: There are additional corrections that the survey team includes in the analysis of the tracking data. Besides velocity of sound readings, what other data about the water in an area would be important to take into account? Hint: The moon has something to do with it.

Topic 2: Where can you earn a certificate in Geographic Information Systems (GIS), or a degree is Geology or Oceanography in the Northwest?  Where else can you learn about GIS?  Where can you learn the skills you need to work with the engineering crew, deck crew, or the Officer Corp in NOAA?

Topic 3: Can you name the earliest cartographer of this area, and when he did his work? Who else has surveyed this area?

Ginger Redlinger, July 17, 2007

NOAA Teacher at Sea
Ginger Redlinger
Onboard NOAA Ship Rainier
July 15 – August 1, 2007

Mission: Hydrographic Survey
Geographical Area: Baranof Island, Alaska
Date: July 17, 2007

Weather Data from the Bridge 
Temp: 56 degrees
Wave height: Negligible
Cloud: Cloudy and Fog
Visibility: ••• mile or less

Mariner word of the day: Strait A strait is a body of water – straight straits are straight bodies of water, but there are no wiggly straits. (Commanding Officer Noll provided today’s definition.)

Science and Technology Log

I got up early (0600 hours) to be sure to watch the crew navigate the ship from Peril Strait through Neva Strait, and then Olga Strait.  Can you imagine navigating a 231 foot ship though a channel that is a slightly wider than the ship and its wake, with only 14 feet of water below the keel?  Did you see the visibility distance in the conditions report?  Imagine how difficult it would be to see another ship approaching!  Well, these people are professionals. The deck hands steered the ship and watched from the decks with binoculars to catch any movement or objects on the surface of the water. The officers monitored two radar screens and checked the bearings constantly as they approached navigation markers.  They checked their route on the gyroscope compass to be sure they were not drifting. They constantly communicated with each other in their own terminology so everyone knew exactly who was doing what and where the ship was at all times.  Needless to say, the margin of error for passing through VERY narrow straits is small. The crew made a difficult navigation task looks easy.  This crew, deck hands, engineering, electronics, stewards, survey crew, and officers are exemplary.  I wish I could describe how well they work as a team – and I will try to help my students understand how important it is to work as a team –everyone has an important job to do.

The massive ship being loaded with supplies

When the fog cleared a bit I was able to see a variety of jellyfish in the water off the side of the ship.  A junior officer told me that when we drop anchor I will see more jelly fish than I can imagine.  I just hope my supply of camera batteries holds out! We will be entering deeper water in a few hours were I will be able to test my sea legs. (Which means that I will find out whether or not I will be seasick, or if will I be ok.) When we enter the sea beyond the bays, harbors, and straits that are protected from the seas constant motion, the boat will begin to move up and down and side to side with the waves and swells. After reading about the experiences of other Teachers at Sea, I decided to go the safe route and begin taking seasickness medicine ahead of time.  Does that make me Pollo Del Mar? (Chicken of the Sea – just a little chiste (joke) there!)

If you want to follow our journey on a map start at Juneau, go south to Gastineau Channel then head through Stephen’s Passage, north to Peril Strait, then west through Neva and Olga Strait. Pass Stika then head towards Biorka Island.  From this area we will head to our hydrography starting location and work as we travel.

A multibeam sonar transducer is installed on the bottom of the hull that will send signals to the ocean bottom and receives the data when it bounces back.  How does it work? Commanding Officer Noll describes it best, “The multibeam sonar precisely measures the time and angle of transmission/reception of the sound signal. The ConductivityTemperature-Depth (CTD) casts help us determine the speed of sound, which more or less allows us to apply Snell’s Law layer-based corrections to the ray-tracing of the sound vector that results. The data is converted to a picture of the bottom of the ocean.” Here is a picture of the transducer on the hull of the ship.  It is on the bottom of the ship’s hull, between the two posts that are holding the ship off the ground.

You may be asking, “why take speed of sound readings in the water before you survey?” Well, the speed of sound changes with the depth of the water so readings that pass through different layers have different velocities.  Accounting for those changes by correcting the data creates more accurate charts and maps. For more information about Snell’s Law and the refraction of sound waves, visit here. The ship runs a 24-hour hydrography work schedule.  The boat and crew will continue to collect and process data all day and night. This means that everyone will be working hard the entire time. If you would like to see a short animation clip of this work – click on this link.

Questions of the Day 

How much faster does sound travel in the water than in the air? Why is the velocity of sound faster in deeper waters than at the surface?  When you are mapping a deep part of the ocean, what impact would the changing velocity of sound have on the time it takes to travel from the transducer to the bottom, and back to the top again?


Barney Peterson, August 21, 2006

NOAA Teacher at Sea
Barney Peterson
Onboard NOAA Ship Rainier
August 12 – September 1, 2006

Mission: Hydrographic Survey
Geographical Area: Shumagin Islands, Alaska
Date: August 21, 2006

Weather Data from Bridge 
Visibility: 10 n.m.
Wind direction:  light airs*
Wind speed:  light airs*
Seawater temperature: 11.1˚C
Sea level pressure: 1012.0
Cloud cover: cloudy

* “light airs” means there is little or no wind

Science and Technology Log 

I have now been out on the survey boats twice and am scheduled to go out again this afternoon. Each survey boat is set up a little differently and some work better in shallower depths than others. They use the same basic systems to create profiles of the ocean bottom.  The survey technicians and NOAA Corps officers have been great at explaining how their equipment works. On the hull (bottom) of each survey boat is a transducer, a device that sends and receives pulses of sound waves. As the sound waves strike the seabed they bounce back to the receiver. Those that come back soonest are those that bounce off objects closest to the sonar device.

However, as the sound waves are transmitted straight down into the water, they spread out from the transducer in a cone shape.  This means that waves on the outer edges of the cone normally travel farther before returning than do the ones that go straight down.  The waves that come back to the receiver first show the tops of objects that are closer to the boat. This works fine for objects straight down, but remember, the waves that are on the outside of the cone travel a little farther and take a little longer to reach things.  That means that they may strike against the tops of higher objects, but they will still take a little longer to return than echoes from objects of the same height that are directly under the receiver.

This is where the sophisticated software comes into translating the echoes that the transducer receives. When the survey boats begin work, and every four to six hours after that, the crew uses a device called a CTD to read the temperature and conductivity of the water all the way to the seabed under the boat.  Both temperature and chemical make-up of the water affect how fast sound waves can travel through it.  Knowing how fast the sound waves can be expected to travel helps the receiver understand whether echoes are  coming back from the tops of rocks (or fish, whales, shipwrecks, etc.), from straight down under the boat, or from the edges of the cone.

Screen shot 2013-04-08 at 4.16.45 PM

There are other considerations to analyzing the echoes too.  It is important to have information on the height of the waves and the swell of the water at the time readings are being made.  (Remember the sound waves are sent out from the bottom of the boat and the boat is floating on the top of the water.) This way the echo patterns analysis can take into account whether the boat is leaning a little to the right or left as it goes up or down with the swell of the water.  That lean affects the angle at which the beam is aimed to the seabed from the bottom of the boat.  The level of the sea surface changes with the tides, so the software also figures in the lowest level that probably will occur due to changes of tide. This is all linked to the time that surveys are made, (because tides change with the time of day, month, and year) the date and the exact geographical position for each bit of information is very important.  This depends upon satellite and GPS technology.

The transducers send out pings faster or slower (pulse rate) and with a stronger or weaker signal, depending upon how deep the water is in the main area of the survey.  The power is set higher for deeper water.  The cone of the beam spreads out wider in deeper water so the resolution, or focus, is not as great.  This is acceptable because objects that are hazards to navigation are generally sticking up from the bottom in shallower water.  (Something sticking up 2 meters from the bottom in water 50 meters deep would still be 48 meters below the surface at its highest point.  That same object in 10 meter water would only allow 8 meters of clearance for ships on the surface.)

There are many other considerations to using the sonar information for making good charts. Every day I have the opportunity to ask a few more questions and learn a little more about this technology.

Personal Log 

This evening I got to go out in a kayak with the XO.  We paddled away from the ship and followed the shoreline north around the island until we entered the next bay.  The waves were small, but sometimes there was a pretty good gust of wind so I really had to pay attention as I was getting used to the feel of the little boat.  About 100 yards from the ship a sudden gust caught my hat and took it off into the water.  We were not able to recover it. On the cliffs above the second bay we spotted Bald Eagles and gulls of several kinds.  One of the eagles was really concerned about what we were doing and either circled over us or sat on the high bluff and watched us the whole time we were in the area.  Its mate flew back and forth through the area calling to it as it watched us.

We were hoping to see a waterfall that we had heard came down the side into this bay, but we never did sight it. The shoreline was beautiful with steep rock walls or narrow rocky beaches and mountains rising right up from the edge.  The hillsides look like they would be smooth and easy to walk on, but the vegetation is actually thick, deep, brush and provides very uneven footing.

Our return to ship was much faster than the trip out because the wind was at our back and pushing us all the way.

Question of the Day 

How were most of the islands in the Aleutian Chain formed?

Eric Heltzel, October 6, 2005

NOAA Teacher at Sea
Eric Heltzel
Onboard NOAA Ship Ronald H. Brown
September 25 – October 22, 2005

Mission: Climate Observation and Buoy Deployment
Geographical Area: Southeast Pacific
Date: October 6, 2005

Eric on the bridge of the RON BROWN

Weather Data from Bridge, 07:00 

Temperature: 19.1 degrees C
Sea level Atmospheric pressure: 1012 mb
Relative Humidity: 78%
Clouds cover: 8/8, stratocumulus
Visibility: 12 nm
Wind direction: 160 degrees
Wind speed: 6kts.
Wave height: 3 – 5’
Swell wave height: 3 – 5’
Seawater Temperature: 18.3 degrees C

Science and Technology Log 

The science team from the Upper Ocean Processes Group is busy preparing instruments to be deployed on the mooring of the Stratus 5 Buoy. Each instrument must be physically examined to ensure that it is properly mounted in its rack.  Then these instruments are awakened to make sure that they are working properly. They are hooked up to a computer so that their operation and calibration can be tested.

The Stratus Buoy
The Stratus Buoy

Today I had a look at a mechanical current meter.  These were designed by Senior Scientist, Dr. Bob Weller as part of his Doctoral work at Scripps Institute. The instrument is housed in an aluminum cylinder that is 2 feet long and 7” in diameter.  The canister is water tight utilizing two interior rubber seals. Extending from one end is a 3’ long PCV mast that has two propeller mounts on it. At each mount are two sets of propellers on either side of the hub.  The two mounts are set at 90 degrees to one another. When water flows through the propellers revolutions are measure and the data is stored in a chip inside the canister.  The number of revolutions per given unit of time gives the velocity of the current.  Having two sets of propellers set at 90-degree angles allows the direction of the current to be determined.

There is also a second type of current meter that uses measurements of sound waves to determine current velocity.  Several of these will be deployed on the mooring along with the mechanical current meters.  Using two types of instruments allows the team to compare results.  The mechanical units have been used for about 20 years and they are known to be reliable and accurate.  Placing the acoustic velocity meter nearby will help determine the accuracy of these devices.

Questions to Consider 

Why are all the instrument cases cylindrical in shape?

Why is a “sacrificial zinc anode” placed on each end of the mechanical current meter?

How could the direction of a current be determined using two sets of propellers at 90- degree angles to one another?

Why build canisters out of aluminum?