Mission: Sea Scallop Survey Geographic Area of Cruise: Northeast Atlantic Ocean Date: June 20, 2017
Weather Data from the Bridge Latitude: 41 18.06 N
Longitude: 68 42.35
Wind Speed: 20.3 knots
Air Temperature: 15.3 C
Science and Technology Log
I’ve had a lot of people ask “So what is the purpose of this trip?” I thought it would be fitting to answer that question in this last blog from sea. I’ve explained the process of collecting the data out here at sea. I’ve explained the technology and methods we’ve used to collect it. But the logical question now is, what happens once this data has been collected?
I’ve had the pleasure serving on the second half of this trip with NOAA Mathematical Biologist, Dvora Hart. Dvora is the lead scientist for the scallop fishery. She is well known in the New England area for her work with scallop fisheries. To many of you in the Midwest, scallops may not seem like a big deal, but did you know that scallops are the second largest commercial fishery market in America? In 2016 scallops were a 485 million dollar industry. They are second only to the lobster market in terms of commercial fisheries value.
NOAA has been completing scallop surveys with lined dredges since 1978. The methods have changed over the years as the technology and research methods have advanced, and these methods have yielded success. However the scallop fisheries have not always been as plentiful as they are now. In 1994 several measures were put in place to help a struggling scallop fishery. The changes were larger dredge rings so smaller scallops would pass through, less crew members on board a vessel, and sections of one of the most productive fisheries in the Atlantic, Georges Bank, would be closed for portions of time to scallop fishermen.
These kind of changes come from a Regional Fisheries Management Council. This council has appointed members from the governors of the New England states involved, head of NOAA Greater Atlantic Fisheries gets a seat, and then 3 more members from each state are nominated. The end result is 19 members who make up this council to decide how to best run a variety of commercial marine organisms in the Northeast Atlantic. There is also a technical committee, which advises this council. This is where Dvora Hart and the data from the scallop survey come in.
Data from the HabCam surveys are very effective at adding a layer of depth to the knowledge of the population of scallops in the Northeast Atlantic Ocean.
The scallop survey, which started May 16th, has been meticulously planned out by NOAA Fisheries. The area where the scallop survey has been preformed has been broken up into regions called strata. These strata areas are determined by their depth and their general geographical area. Once scallops are collected in a strata, a weighted mean, a size frequency, shell heights, and a mean number of scallops of each size category are taken. From the meat weights that were collected, a total biomass of scallops for the area is taken. There is a relationship between the meat weight and the shell height which gives researches an idea of the total biomass of scallops in the area. At any given depth there is a conversion of shell height to meat weight. These numbers can be plugged into software which can model the biomass for an area.
Scallop biomass modeling from the 2016 survey.
All of the data collected during the NOAA scallop survey is combined with the Virginia Institute of Marine Science (VIMS) scallop survey. Dvora and the NOAA scientists created forecasting models for 19 different areas in the Northeast Atlantic. Forecasts are made using the predicted biomass for the strata areas, by aging the samples of scallop shells collected, fishing mortality (amount of caught by fishermen), and natural mortality rates. Models are then created to forecast 15 years out to predict the consequences of fishing an area heavy. Dvora is part of a technical team that advises the Regional Fisheries Management Council using the data collected in this survey and the models her and her team have created. Scallop fisheries are very healthy currently due to the data collected, data interpreted, and models created by NOAA scientists, commercial fishermen, and Regional Fisheries Management Council.
Personal Log These 16 days have been quite an experience. I’d like to share just 5 of the more memorable moments from this trip.
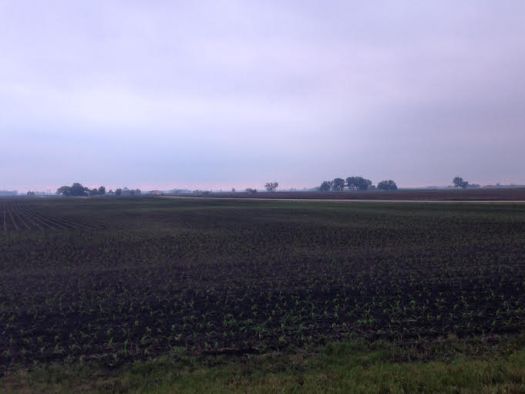
5. Amazing sites of nature. What a unique experience to be out only surrounded by the vast Atlantic Ocean for over two weeks. I’ve seen so many awe inspiring moments. Sun rises, sun sets, full moons over the ocean in a clear sky, rainbows that span the horizon, thousands of stars in the sky, and thick ominous fog which lasts for 24 hours. Truly once in a life time sights.
Only caught one sun rise, but it was beautiful.
Most nights there was an amazing sun set.
Huge rainbow after a storm.
Picture doesn’t do the full moon nights on the ship.
4. The 12 hour shifts. Whether it was running the Habcam and joking around with the crew while we watched computer screens for 12 hours or working the dredge station in all kinds of conditions, the work was fun. Being out on the deck working the dredge was my favorite type of work. To be out in the open air was awesome regardless of how hard the work was. The last day the waters were crazy as we worked on the deck.
I was able to be the “cutter” in the lab and shuck the scallops to be prepared for weighing and preserving.
I was given the ability to “start and event” and communicate with the crane workers running the dredge.
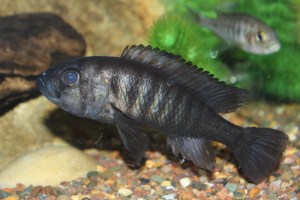
3. The awesome animals that came up in the dredge. Too many pictures to post here, but my favorite animal was the goosefish. That fish looked like it wanted to take a bite out of your arm even if it was out of water. Such an awesome animal.
Seeing these goosefish come out of the dredge never got old. Such an amazing fish.
2. The awesome animals that would come near the boat. Crew members saw whales, dolphins, sharks, sunfish, and mola mola. Though my favorite was my first day out when the humpback whales surrounded the boat, the dolphins riding by the boat is was a close second.
One of our last days a group of about 4 dolphins followed the ship for about 10 minutes.
1. General life about the Hugh R. Sharp. What a great group of people to be with for 16 days. I felt accepted and looked out for the whole time I was here. Mike Saminsky dropping what he was doing the first day I got to the ship to show me around and grab some dinner, TR sharing his hidden stash of snacks with me, a variety of crew members trying to help me through my sea sickness, and every body on the cruise allowing me to ask questions and interview them. Just the general down time and laughs had will be very memorable.
General life aboard the Hugh R. Sharp will be a lasting memory for me.
Thank you to the people of NOAA, the Hugh R. Sharp, my wife and kids (Hannah you are amazing for shouldering the extra load at home!), and family, friends, and students that followed the blog at home. This has been an experience of a lifetime, and I’m grateful to all of you who made it possible. Specific thanks to my work crew chief Nicole Charriere who was an awesome leader during this cruise. I learned a lot about how to lead a group watching her. Thank you to Larry Brady and Jonathan Duquette the Chief scientists for this cruise. Their organization and decision making made this a smooth experience for me. Thank you to Katie Sowers, Emily Susko, Jennifer Hammond, and Huthaifah Khatatbeh for help with the trip arrangements and all of my blog questions, you all made this experience much easier.
Did You Know?
I will travel over 1,000 miles to go home today. Yes that’s crazy to me. But I have traveled over 1,000 nautical miles on the Hugh R. Sharp since this cruise has began.
Mission: Sea Scallop Survey Geographic Area of Cruise: Northeast Atlantic Ocean Date: June 14, 2017
Weather Data from the Bridge Latitude: 41 31.54 N
Longitude: 70 40.49 W
Wind Speed 10 Knots (11.5 mph)
Air Temp 20.2 C (68.4 Fahrenheit)
Science and Technology Log
Contrary to the popular Rolling Stones song “Time is on my Side,” time is not on our side while we are taking survey of the scallop population in the Northeast Atlantic Ocean. This survey has been meticulously planned for months leading up to the actually event. There is no time budgeted to sit at a dredge station longer than you have to.
The Nobeltec Cruise Track for the 2nd and 3rd legs of the 2017 Scallop Survey. You can see this survey has covered 1000’s of nautical miles, and stopped at over 100 dredge stations.
For seven days our noon to midnight science crew has been working at a blistering pace to dredge the ocean floor or take pictures with the underwater camera, HabCam. We are on a tight schedule, and in a twelve hour period we are able to work through 10 dredge stations. There has been little down time, and because some of the dredge stations are so close together, there is no time to be unproductive while we are at a station. Because of this, there are often stations where we simply are not able to individually count all the organisms we collect. There are many situations where our crew must use the method of subsampling.
For you in the Midwest, imagine you wanted to know how many dandelions were in your yard. Now if you are anything like me, you have way too many to count. If you went to count them all individually, it would literally take you all day if not more. It is just not time efficient to do such a thing. But if we took a population sample of some random areas in the yard, we could come up with an answer of how many dandelions were in the yard, and get a very close answer to actually counting them individually.
A similar example I can give you is with a recent dredge catch that was full of sand dollars. In one of our massive dredge catches composed of about 99.5% sand dollars, I completed an estimate sand dollars in a similar manner. I filled 2 liter pail full of sand dollars. My count for that pail was 188 sand dollars per 2 liters. In this catch we had 46 baskets each with a volume of 46 liters. So at 94 sand dollars per liter with there being 2,116 liters total, you can estimate there are about 198,904 sand dollars in that dredge catch.
A dredge catch that was almost 100% sand dollars. These sand dollars are dripping with a green algae and cover our buckets and wet gear in a green coating.
We are faced with similar tasks while sorting through the dredge. When we face those situations, we turn to the method of sampling, and we take a representative sample of our catch. At most stations we are taking count of sea stars, crabs, waved whelks, all fish, and scallops. When we collect the dredge, most of the time it would not be time efficient to totally count up all the sea stars, so we turn to subsampling.
Here’s how subsampling works. Once we have sorted our dredge catch into various pails, we count up our specimens. For sea stars however we always take a subsample. To do that our watch-chief takes a scoop full of whatever is in our discard pails, and she does this randomly. She puts the random sample in a 4.5 liter pail. From here, she can begin to estimate the number of sea stars in our dredge catch. For example, if she goes through the 4.5 liter pail and finds six sea stars, and she knows there are four 46 liter pails of discard from the dredge, with a little math work she can figure out how many stars are in the dredge. If there are four 46 liter pails of discard, then there is a total of 186 liters of discard. She knows from her random sample that there are 6 sea stars per 4.5 liters which would come out to 1.3 sea stars per liter. By multiplying that number by 186, you can determine that an expanded estimate for the sea stars in the dredge collection would be 242 sea stars.
An example of our discard baskets from our dredge catches. This catch was sea star heavy, and this shows it would have taken too much time to count each sea star individually. Since many sea stars are predators of scallops, a count needs to be recorded.
We also use this method when we have a large catch of scallops. When we have an overly large scallop catch on the dredge, we are not able to count and measure every single scallop from the catch. In these cases we use a representative amount. In one case we caught 24 baskets of scallops, each basket able to hold 46 liters. If we were to measure all of those scallops we would be at that station far too long to move onto the next dredge. When we caught enough scallops to fill 24 baskets, we used 3 baskets of scallops as a representative amount. All of the scallops in the 3 baskets were measured for their shell height. We would then take a mean average from these scallops to represent the 21 other baskets. We are also able to estimate the number of scallops in the 24 baskets the same way I estimated the number of sand dollars in a dredge catch.
A large catch of scallops from one of our dredge stations. In this case a representative sample of shell heights was taken.
Representative samples and population estimations through sampling are valuable tools that scientists use to collect a lot of data in a more efficient amount of time. From this data, mathematical models and predictions are developed. By implementing these methods, we are able to get more data from more locations.
Personal Log
It has been 9 days since I arrived in Woods Hole, Massachusetts to be a part of this journey. As I shared in my last blog, it is hard to be away from home, but many of the people here are gone more than 100 days per year. There is one thing that makes that time away easier….eating! Here on the Hugh R. Sharp, I would imagine I’ve put on some extra pounds. Most days I feel like a cow grazing. There are so many snacks on board, that it is so easy just to walk by the galley and grab a mini candy bar, chips, pop, or ice cream. I have discovered there is no better candy bar than a Baby Ruth. On top of the snacks and sweets, the cook, Paul, cooks up some mean dinners. Though I miss my wife’s home cooking, Paul’s cooking is a good substitute.
Lots of candy and snacks and some good dinners is probably leading to some extra poundage! There are two drawers always full of candy, and a freezer always full of ice cream. Pictured on the left is the ship’s cook, Paul.
Outside of eating, there is not much recreational time on the ship. I do try to get up a couple hours before our shift begins to just enjoy being out on the ocean. I haven’t been able to make myself get up yet for sunrise at 5:05 AM. After working a twelve hour shift sorting dredge catches, there’s not much you want to do but sleep. Sleeping on the boat has been good. Probably some of the deepest sleep I’ve had since our kids were born. I’ve gotten used to the motion of the boat, the sound of waves hitting the bow, and the boat stabilizers which sound like a giant snoring. I’m a sleep walker, so that was a concern coming in that I would find myself on deck, sleep walking. But I’m sleeping so sound, I don’t think it’s possible. However I did warn my roommates to stop me if they saw me up in the middle of the night.
Part B of the survey has started, and with that most of my crew got off the ship, and I will have a new crew starting today. It was a great group of people to work with.
Part A of the survey the day crew from left to right: Crew chief Nicole, myself, Dylan, Sue, and Nancy. Then the night crew of Lauren, John, Jill, Han, and crew chief Mike.
Did You Know?
Living in Illinois, there are not many times where knowing your parts of a ship come in handy. However, as I have been living on the Hugh R. Sharp for over a week now I have picked up some terms. I did not know many of these coming on, so this is a “Did you know?” moment for me.
Front of the ship: bow
Back of the ship: stern
Moving to the front of the ship: forward
Moving to the back of the ship: aft
The left of this picture is port, and the right is starboard. It took me awhile to figure out what our turn would be like if we were making a turn to starboard.
If you were on the bow, your left would be the: port
If you were on the bow, your right would be the: starboard
Fathom: 6 feet
A heading of zero: North, a heading of 90: East, a heading of 180: South, a heading of 270: West
Heading to a location quickly: steam
Kitchen (where I constantly graze in between dredge stations): galley
Location of the ship’s navigational equipment is: bridge
Bathrooms: the head
Mission: Sea Scallop Survey Geographic Area of Cruise: Northeast Atlantic Ocean Date: June 7, 2017
Weather Data from the Bridge Latitude: 41 30.90 N
Longitude: 69 18.76 W
Air Temp 14.1° Celsius ( 57.3° Fahrenheit)
Wind speed 4.7 Knots (5.4 mph)
Science and Technology Log
Due to the poor weather delay on the 6th, June 7th was our first day out for the crew I am working with. Our ship is divided into two crews so we can work our operations around the clock. The crew I am working with works from noon to midnight, while the other crew works midnight to noon. On the 7th, were able to drop the dredge and attempt to collect scallops to assess the health, size, and population of those organisms.
Sometimes the dredge brings up more than scallops! This goosefish uses it’s illicium which act like fishing lures to attract fish close enough to be gulped by its large mouth.
We work those hours mainly using the collection process of dredging the ocean floor for scallops, but along the way, several other bottom dwelling ocean creatures are caught in the dredge.
A crane operator with the help of two deck workers lowers the dredge into the water. Once the dredge is in place to go into the water the crane operator releases cable until the dredge reaches the ocean floor. Depth readouts are calculated beforehand to determine how deep the dredge will need to drop. With this information the dredge cable is let out at a 3.5:1 ratio, meaning for every meter of ocean depth we are in, 3.5 meter of cable is let out. With this ratio the dredge is dropped with an angle that keeps it flat to the ocean floor. The crane operator is also reading a line tension readout in the crane booth to determine when the dredge has hit the ocean floor. We are typically in 200–350 ft of water when these dredges occur. The dredge travels behind the boat for 15 minutes, and is then pulled in.
On the dredge is a sensor called the “Star-Oddi.” This sensor detects the pitch and roll to make sure it was lying flat on the bottom of the ocean. The Star-Oddi also collects temperature and depth information as the dredge is traveling. The sensor is taken out of the dredge once it is brought up so watch-chief can see if the dredge was functioning properly throughout the tow.
University of Maine student Dylan Benoit is taking out the Star-Oddi after a dredge.
Once the dredge is hauled up, it is dumped onto a large metal table that the science crew stands around. Two of the Hugh R Sharp’s vessel technicians then scoop the collected haul to an awaiting science crew.
The dredge is unloaded with a good haul of scallops.
The science crew will then divide the haul into several different collection pails. The main objective of this crew is to collect scallops. Scallops collected are organized into different sizes. Fish are also collected and organized by a NOAA scientist who can properly identify the fish. At some of the dredge stations we collect numbers of crabs, waved whelks, and sea stars as well.
This dredge was especially sandy. In a typical day we reach around 6-8 dredge stations during our twelve hour shift. Here I am sorting through the sand looking for scallops, fish, crabs, and wave whelks.
Once the haul is collected and sorted, our science team takes the haul into a lab station area. In the lab, several pieces of data are collected. If we are at a station where crabs and whelks are collected, then the number of those are recorded as well. Fish taken from the dredge are sorted by species, some species are weighed and measured for length. Some of the species of fish are measured and some are counted by NOAA scientists.
In the dry lab the midnight to noon science crew takes measurements and records data.
Also in this lab station, all of the collected scallops are measured for their shell height. A small sample of scallops are shucked (opened) to expose the meat and gonads, which are individually weighed and recorded. Once opened we also identify if a scallop is diseased, specifically looking for shell blisters, nematodes, Orange-nodules, or gray meats.
Scallop disease guide posted in the dry lab.
Also at this station, the gender of the scallop is identified. You can identify the gender by the color of the gonad. Males have a white gonad, while a female’s looks red or pink. Finally at this station, commensal organisms are checked for. A common relationship we have seen during this trip is that of the scallop and red hake. The red hake is a small fish that is believed to use the scallop shell as shelter while it is young. As they get older, red hake have been identified to be in the depression around the scallop, still trying to use the scallop for shelter, even though it can no longer fit inside.
A shucked clam that had a red hake living inside of it when it was collected in the dredge.
After that has happened the shells are cleaned and given an ID number. These scallop shells are bagged up, to be further examined in NOAA labs by a scientist that specializes in scallop aging.
These scallops have been shucked, and now their shells will be researched by a scallop aging expert at NOAA. My job is to be the recorder for the cutter. I do the final cleaning on the scallop shells, tag them, and bag them.
If you’d like to know how this process works, watch the video below. The watch-chief, Nicole Charriere, of the science crew members I work with, explains the process in this short clip.
Transcript:
(0:00) Nichole Charriere. I’m the watch chief on the day watch, so working with Terry. I’ve been working at the Northeast Fisheries Science Center for about 6 ½ years. When we’re out here on deck, basically, we put a small sensor on the dredge that helps monitor the pitch, the roll, and kind of whether the dredge is fishing right side up or upside down. And we offload that sensor after every tow, put a new one on, and that sensor will tell us basically how that dredge is fishing, because we always want the dredge to be in contact with the bottom, fishing for the entire 15 minutes if we can.
(0:45) The dredge is deployed 15 minutes for the bottom and then it comes back up and then the catch is dumped on the table. Then depending on how far away the next station is, sometimes we take out crabs and whelks, and we account for the amount of starfish that are in each tow because those are predators of scallops. So we want to make sure that we’re kind of tracking the amount of predation that’s in the area. And you usually find if you have sometimes a lot of starfish, a lot of crabs of certain sizes, you’ll find less starfish. I mean you’ll find less scallops.
(1:22) After the entire catch is sorted, we’re bringing it to the lab. We have scallops, we have scallops “clappers,” which are dead scallops that still have the hinge attached, and that’s important for us because we can track mortality. Once the hinge kind of goes away, the shell halves separate. Can’t really tell how recently it’s died. But while that hinge is intact, you can tell it’s basically dead recently. So you kind of get a decent idea of scallop mortality in that area like that.
(1:52) Scallop, scallop clappers, we kind of count fish, we kind of measure usually commercially important ones as well. Then we take scallop meat weights, so we open up the scallop– Terry’s been doing a lot of that too– open up the scallop, we kind of blot the meat weight so it’s like a dry meat weight, and we measure, we weigh the gonad as well, and that kind of tracks the health of the scallop.
(2:21) And then the rest of us are doing lengths of the scallop, and that’s so that we get a length frequency of the scallops that are in the area. Usually we’re looking for about… if you look at the graph it’s like a bell curve, so you kind of get an average, and then you get a few smaller scallops and a few larger scallops. And that’s pretty much it. We’re taking length frequencies and we’re looking at the health of the scallops.
Personal Log
From the time I woke up on Tuesday till about the time I went to bed that night, sea-sickness was getting the best of me. I listened to the advice of the experienced sailors on board, and kept working through the sickness. Even though I felt sick most of the day, and I just wanted the day to end at that point. However, I was rewarded by sticking it out, and not going to my room to lay down, by one of the most incredible sites I’ve ever seen. From about 4pm til about 8pm, many humpback whales were all around our boat. We had a little down time waiting to get to the next dredge spot, so I was watching the horizon just trying to get my sea-sickness in check. As I was sitting by the side of the boat, I saw a whale towards the bow of the ship. I got out my camera and was in the right place at the right time to get a video of it. It was one of the most amazing sites I’ve ever seen.
Video of a humpback whale diving near R/V Hugh R. Sharp
Fluke of a humpback whale diving next to R/V Hugh R. Sharp
Did You Know?
The typical bleached white sand dollars that most people are accustomed to seeing as decorations are not the actual look of living sand dollars. In one of our dredge catches, we collected thousands of sand dollars, and only a couple were bleach white in color. Sand dollars are part of the echinoderm family. They move around on the ocean floor, and bury themselves in the sand. The sand dollars use the hairs (cillia) on their body to catch plankton and move it towards their mouth. The bleached white sand dollars that most people think of when they think of a sand dollar is just their exoskeleton remains.
Mission: Sea Scallop/Integrated Benthic Survey Geographical Area of Cruise: Northeastern U.S. Atlantic Coast Date: May 30, 2017
Personal Log
How do you prepare yourself mentally for something to which you have no comparison? I, Terry Maxwell, have wrestled with this question since I was notified on February 1st, 2017 that I would be a part of a research cruise in the NOAA Teacher at Sea Program. Do not get me wrong, the people at NOAA have been awesome in answering my questions and providing resources to interact with to prepare for this mission. However, I have lived my whole life in the flat land of Illinois. I am used to seeing for miles in all directions, but cannot imagine the views out on the ocean. I have taught science now for 13 years, but have never had an opportunity to work with scientists doing actual fieldwork and research. My mind is trying to process this upcoming incomparable experience right now.
My flat land views will soon be exchanged for a view from the Hugh R Sharp.
About Me
I am a science teacher at Seneca High School in Seneca, Illinois. I will be starting my 6th year at Seneca High School next year, and going into my 14th as an educator. I mainly teach freshman physical science, but occasionally get the opportunity to teach a junior/senior environmental science class. Along with teaching I also am an assistant
Teaching and coaching leads to a full year.
football coach, assistant track coach, science club sponsor, and FCA (Fellowship of Christian Athletes) huddle leader. I wear many different hats throughout the year, and have the support of an awesome family at home. It will be difficult to be away from my family for a couple weeks after a busy school year, but this is an amazing opportunity I had to apply for.
It will be hard to leave my wife and kids for a couple weeks, but they have been supportive. In the background, you can see the type of “vessels” I am used to!
Why did I apply for Teacher At Sea?
I attended a NOAA workshop at Shedd Aquarium in Chicago, Illinois titled “Why and How We Explore the Deep Ocean.” I went to the workshop to see if there was any ocean content I could work into my Integrated Physical Science class. At the workshop, I discovered the amount of ocean content that fits in with the physics and chemistry content I currently teach is numerous. The workshop was fantastic (if you are a teacher reading this I highly recommend you attend this workshop if it is available at a nearby location). Towards the end of the workshop, the presenter discussed the Teacher at Sea opportunity. I instantly knew I wanted to apply. I came home from the workshop and told my family, “I’m going to apply to go on a research vessel with NOAA this summer.” To which my wife (who has heard so many crazy ideas come out of my mouth) said, “Uh huh…okay.” My oldest daughter responded, “Only if I can go with you.” My son responds, “As long as it’s not over my birthday.” My youngest just put the free NOAA bag from the workshop on her head like a helmet, and ran around the room. So, with the obvious support of my family, I applied.
I had never felt so strongly about something. I wanted to be a part of this experience for many reasons. A) I wanted an experience working on an actually research mission. I consider this extremely valuable for my classroom moving forward. I envision taking research methods I learn from this trip and emulating them in my classroom. B) I seek to strengthen my weaknesses. My knowledge of ocean ecosystems is weak. Part of this is being land locked in Illinois. What better way to gain knowledge and appreciation for ocean ecosystems than to be a part of a team researching them? I think when you lack understanding about something it is much easier to disregard it. Ocean ecosystems are far too important to give little attention to them. C) Being about a 1/3rd of the way into my teaching career I am looking for an experience that can ignite new ideas, and help me grow as an educator. I am motivated and inspired by all kinds of simple things; I cannot imagine what this opportunity could do for me. D) I like fish. Simple I know, but its true. The science club I run is called Conservation in Action (yes the CIA), and one of the projects we currently have running is keeping cichlids that are endangered or threatened in the wild, in our classroom.
A male Lipochromis melanopterus that is housed in an aquarium in my classroom and cared for by members of our science club.
We currently have about 15 aquariums that some of our club members maintain with the goal of informing people of the plight of the Lake Victorian cichlids and other endangered fish, and keeping their population numbers in captivity healthy.
How can you prepare with me?
I would like to leave you with some resources that you can prepare for this trip with me. There have been several sources given to me by NOAA, and some others I have found to be valuable as well.
A) What ship will you be on? I will be on the Hugh R Sharp. You can find out more about this vessel here. This site from the University of Delaware even includes a video tour of the ship. This will answer a lot of questions about what day to day life may be like for me on the trip, though I will be posting more about that in the coming weeks.
B) What is a scallop survey? From what I understand, we will be collecting large amounts of samples from the ocean floor through dredging. The samples would be brought on board and counted. A record of overall population and populations at different life cycle stages is taken. A report from a past survey is found on the NOAA website, and that is linked here. This report by Dvora Hart is a great look at some of the technology and methods that may be used on this upcoming mission.
Did you know?
NOAA is predicting a more active than normal hurricane season in the Atlantic in 2017.
Always a good article to read right before heading out for a couple weeks into the Atlantic Ocean! However, I am not worried by this because I am in the hands of experts. It is always good to be prepared and aware though. The article is a good read with lots of links about NOAA’s weather predicting capabilities. Above-normal Atlantic Hurricane Season is Most Likely This Year
NOAA Teacher at Sea Donna Knutson
Aboard the Research Vessel Sharp June 8 – June 24, 2016
2016 Mission: Atlantic Scallop/Benthic Habitat Survey Geographical Area of Cruise: Northeastern U.S. Atlantic Coast Date: June 24, 2016
Last Leg of Leg III Atlantic Sea Scallop Survey 2016
Mission and Geographical Area:
The University of Delaware’s ship, R/V Sharp, is on a NOAA mission to assess the abundance and age distribution of the Atlantic Sea Scallop along the Eastern U.S. coast from Mid Atlantic Bight to Georges Bank. NOAA does this survey in accordance with Magnuson Stevens Act requirements.
Science and Technology:
Latitude: 41 29.84 N
Longitude: 070 38.54 W
Clouds: partly cloudy
Visibility: 5-6 nautical miles
Wind: 3.58 knots
Wave Height: 6 in.
Water Temperature: 53 F
Air Temperature: 67 F
Sea Level Pressure: 30.0 in of Hg
Water Depth: 26 m
It has been an action packed two weeks. The men and women who dedicate themselves to the scallop survey are extremely hard working scientists. It is not an easy job. The sorting of the dredged material is fast and furious, and it needs to be in order to document everything within the catch before the next one comes in. The baskets are heavy and it takes a strong person to move them around so quickly.
Han, Jill, Mike, Vic, Me and Ango
In small catches every scallop is measured. In dredges with many baskets of scallops, a percentage is measured. It is a random sampling system, taking some scallops from each of the baskets to get a general random sample of the whole. Mike led an efficient team, he told us what to look for and oversaw the measuring.
Mike and Nikki
He often set samples aside to show me later, when we were not as busy. A few examples were how to tell the difference between the red and silver hake or the difference between the Icelandic and Atlantic sea scallop. He showed me how the little longhorn sculpin fish, “buzz bombs” known to fisherman, vibrate when you told it in your hand.
Longhorn sculpin
Mike even took the time to dissect some hake and to show me the differences in gonads, what they were feeding on by opening their stomach, and the otolith within the upper skull. The otolith is a small bone in the inner ear that can be used to identify and age the fish when in a lab looking through a microscope. Mike answered my many questions and was always eager to teach me more.
Another helpful team member was Vic. Vic taught me how to run the HabCam. He has been involved in the HabCam setup since it started being used four years ago. There is a lot of work to do to set up the multiple monitors and computers with servers to store all the images collected by the HabCam. Vic overlooks it all from the initial set-up to the take down. I admire Vic’s work-ethic, he is always going 100% until the job is completed. Sometimes I just needed to get out of his way, because I knew he was on a mission, and I didn’t want to slow him down.
Control center for Habcam and Dredging
When we weren’t dredging, but rather using the HabCam, there was a pilot and copilot watching the monitors. The HabCam, when towed behind the ship, needs to be approximately 1.7 m off the ocean floor for good resolution of the pictures, and keeping it at that elevation can be a challenge with the sloping bottom or debris. There is also sand waves to watch out for, which are like sand bars in a river, but not exposed to the surface.
When not driving HabCam there are millions of pictures taken by the HabCam to oversee. When you view a picture of a scallop you annotate it by using a measuring bar. Fish, skates and crabs are also annotated, but not measured. It takes a person a while to adjust to the rolling seas and be able to look at monitors for a long period of time. It is actually harder than anticipated.
HabCam Picture of a skate.
Han was making sure the data was collected from the correct sites. She works for the Population Dynamics branch of NOAA and was often checking the routes for the right dredges or the right time to use the HabCam. Between the chief scientist Tasha and Han, they made sure the survey covered the entire area of the study as efficiently as possible.
Tasha, Han and Mike discussing the next move.
Dr. Scott Gallager was with us for the first week and taught me so much about his research which I mentioned in the previous blogs. Kat was with us initially, but she left after the first week. She was a bubbly, happy student who volunteered to be on the ship, just to learn more in hopes of joining the crew someday. Both vacancies were replaced by “Ango” whose real name in Tien Chen, a grad student from Maine who is working on his doctoral thesis, and Jill who works in Age and Growth, part of the Population Biology branch of NOAA. Both were fun to have around because of their interesting personalities. They were always smiling and happy, with a quick laugh and easy conversation.
Jill, Ango and Han after dredging.
The Chief Scientist, Tasha, was extremely helpful to me. Not only does she need to take care of her crew and manage all the logistics of the trip, plus make the last minute decisions, because of weather or dredges etc, but she made me feel welcome and encouraged me to chat with those she felt would be a good resource for me. On top of it all, she helped me make sure all my blogs were factual. She was very professional and dedicated to her work, as expected from a lead scientist leading a scientific survey.
Evan, Tasha and Jimmy discussing route.
I spent as much time as possible getting to know the rest of the crew as well. The Master, Captain James Warrington “Jimmy” always welcomed me on the bridge. I enjoyed sitting up there with him and his mates. He is quick witted and we passed the time with stories and many laughs. He tolerated me using his binoculars and searching for whales and dolphins. There were a few times we saw both.
He showed me how he can be leader, responsible for a ship, which is no small feat, but do so with a great sense of humor, which he credits he inherited from his grandmother. The other captains, Chris and Evan, were just as friendly. I am sure all who have been lucky enough to travel with them would agree that the RV Sharp is a good ship to on because of the friendly, helpful crew and staff.
KG, oceanic specialist, helped with dredges.
Because this was my second experience on a survey, the first was a mammal survey, I have really come to appreciate the science behind the study. It is called a survey, but in order to do a survey correctly, it takes months of planning and preparation before anyone actually gets on a ship.
There is always the studying of previous surveys to rely on to set the parameters for the new survey. Looking for what is expected and finding, just that, or surprising results not predicted but no less valued, is all in a scientist’s daily job. I admire the work of the scientist. It is not an easy one, and maybe that is why it is so much fun. You never know exactly what will happen, and therein lies the mystery or maybe a discovery to acquire more information.
I had to hold the largest goose fish we caught!
It was a challenging two weeks, but a time I’m so glad I had the opportunity to have with the members of Leg III of the 2016 Atlantic Sea Scallop Survey.
2016 Mission: Atlantic Scallop/Benthic Habitat Survey
Geographical Area of Cruise: Northeastern U.S. Atlantic Coast
Date: June 21, 2016
The Atlantic Sea Scallop – More Than Meets the Eye
Mission and Geographical Area:
The University of Delaware’s ship, R/V Sharp, is on a NOAA mission to assess the abundance and age distribution of the Atlantic Sea Scallop along the Eastern U.S. coast from Mid Atlantic Bight to Georges Bank. NOAA does this survey in accordance with Magnuson Stevens Act requirements.
Science and Technology:
Latitude: 41 16.296 N
Longitude: 68 49.049 W
Clouds: overcast
Visibility: 5-6 nautical miles
Wind: 21.1 knots
Wave Height: 4-6 occasional 8
Water Temperature: 59 F
Air Temperature: 64 F
Sea Level Pressure: 29.9 in of Hg
Water Depth: 101 m
Science Blog:
Sea scallops are unique from clams, molluscs and other bivalves. All of them are filter feeders, but the sea scallop filters out larger sized particles such as diatoms and large protozoans that are larger than 50 micrometers. Clams filter feed on smaller animals and particles that are too small for the scallop to retain and therefore flow right through their digestive system.
Older scallop found in a protected area.
Dr. Scott Gallager is looking inside the stomachs of scallops. His hypothesis is that microplastics are traveling down to the bottom of the ocean, and if they are, the scallop will siphon them into their stomach along with their food.
Microplastics are, as the name suggests, small pieces of plastic measured in micrometers. They may enter the ocean as an object such as a plastic water bottle, but over time with the turbulence of the ocean and the sun’s ultraviolet radiation break down into smaller and smaller pieces.
Another way microplastics are entering the ocean is through the cleaning products we use. Many shampoos, detergents and toothpastes have small beads of plastic in them to add friction which aid the products cleaning potential. Untreated water, such as runoff, has the likelihood of flowing into the ocean bringing microplastics with it.
Small sea scallops.
If a sea scallop ingests microplastics the same size as its food, the scallop will not be getting the nutrients it requires. Large quantities of micro plastics falling to the bottom of the ocean would obviously cause the health of scallops to deteriorate.
Another interesting story of the sea scallop is its “attachment” to the red hake. It is not a physical attachment. There appears to be a sentimental attachment between the two even though that is obviously not possible.
The red hake is a fish that starts out its life as a small juvenile without any protection. It finds a home and refuge inside a sea scallop shell. The sea scallop almost befriends the little red hake and allows it to live behind its photoreceptive eyes, next to the mantle.
Red hake minnow.
Red hake minnow found in its scallop.
The fish curls its body into the same contour shape as the scallop. The little fish can swim in at times of danger and the scallop will close its shells to protect them both. After the threat has passed the scallop opens its shells and the little red hake can swim out.
Red hake did not make it in before closing time.
There seems to be some commensalism between the two. Commensalism is the relationship between two different species where each live together without any one feeding off of the other. They live in harmony with each other neither hurting the other. It is not known whether the fish feeds on the scallops’ parasites or if they just coexist together.
It is clear something is happening between the two, because after the red hake grows and no longer fits inside the shell, the fish will still live next to the scallop. It now will curl itself around the outside of the shell. Looking at HabCam pictures, it appears to curl around a scallop even if the scallop is no longer alive. Could it really be the same scallop it lived in as a minnow?
Red hake curled around its scallop. Picture taken from the HabCam.
Red hake numbers increase in areas where there are larger, more mature, sea scallops present. What connects two together? Is there some chemical connection where the fish can identify the scallop it “grew up” with?
Why is the red hake red? The red hake is part of the cod family. The other fish such as the silver hake, spotted hake, white hake and haddock do not act like red hake. Red hake are the same color as the scallop. Coincidence? Maybe.
Is the red hake now protecting the scallop as it curls around it? The scallop protected the young fish for as long as it could, so now is the Red hake returning the favor? The main predator of the scallop is the starfish. A starfish would have to climb over the fish to get to the scallop. The red hake would not allow the starfish to get that far.
Red hake have a swim bladder that erupt when brought to the surface.
Is the red hake still just protecting itself? When curled around the scallop, the fish blends in with the scallops red color and is in a sense camouflaging itself from its enemies. In this sense, the scallop is still allowing the red hake to hide, but this time in plain sight.
The Atlantic sea scallop is more interesting than expected. It is curious how the scallop seems to realize how close it is to other scallops. Without having a fully functioning brain, just groupings of neural ganglia, acting as a control center for a bodily functions or movement, how can the scallop decide the best place to live? Do they move in search of a better habitat? How do they know to disperse within their area so they are relatively the same distance apart as seen on the HabCam? Is it competition for food?
Could it be their photosensitive eyes can’t tell the difference of movement of a predator to that of another scallop? They seem to be able to tell the difference between a sea fish predator and one that is not. Why are they so tolerant of the red hake? More questions than answers.
The HabCam is a wonderful tool for studying these questions and more. So little is understood about the habitats within the oceans. It has been easier to study space than to study the depths of our own planet. This is a very exciting time in oceanic research. The HabCam will reveal what has been covered with a blanket of water.
Personal Blog:
We spent a little more time at Woods Hole. Jim, the ship’s captain, hired a crew of scuba divers to scrub off the barnacles growing on the rudder. I was lucky enough to find a tour of some of the labs at Woods Hole. Scott called around to his colleagues and discovered there was a tour for teachers occurring at that moment when we arrived.
Alvin the deep sea submersible in dry dock.
I quickly was sent on a campus bus with Ken, a man working in the communications department, also with a science degree. I think he said it was in physical geology. Everyone around here has multiple degrees and they are often opposite what you would imagine. Such diversity makes some very interesting people to chat with.
In the teacher tour was a former TAS (Teacher at Sea). She was here because she won a touring trip to Woods Hole, so we had some time to chat over lunch about our experiences. We agreed the TAS is one of the best teacher development opportunities out there for all teachers and I think we convinced a third to apply for next year.
I never got the long walk I had planned on, but a much better one learning more about Woods Hole. Ken even took me to see Alvin, the deep sea submersible that lives on the Atlantis. The Atlantis was leaving Alvin behind on its latest mission so Ken showed it to me. The navy is using it this time.
I’ve been feeling great and even got on the exercise bike. Today we will be HabCaming the entire day. It is a nice rest compared to the physical work of dredging from the last two days. Both HabCam and dredging have their benefits. Together they create a much better understanding of what’s below us.
While I’ve been writing this the wind has picked up 10 knots. The waves are 4-6 ft high with an occasional 8ft and it doesn’t look like it will let up. The HabCaming continues but it is harder to keep it level. They are considering going in early if the weather continues to get worse. I believe Tasha said we were a bit ahead of schedule so that wouldn’t be so bad for the survey. Before that happens, there is more dredging to do.
NOAA Teacher at Sea Donna Knutson
Aboard R/V Hugh R. Sharp June 8 – June 24, 2016
2016 Mission: Atlantic Scallop/Benthic Habitat Survey Geographical Area of Cruise: Northeastern U.S. Atlantic Coast Date: June 13, 2016
Mission and Geographical Area:
The University of Delaware’s ship, R/V Sharp, is on a NOAA mission to assess the abundance and age distribution of the Atlantic Sea Scallop along the Eastern U.S. coast from Mid Atlantic Bight to Georges Bank. NOAA does this survey in accordance with Magnuson Stevens Act requirements.
Science and Technology:
Weather Data from the Bridge
Latitude: 40 43.583 N Longitude: 67 04.072 W
Clouds: 50% cumulous
Visibility: 6 nautical miles Wind: 296 degrees 11 knots at cruise speed of 6.5 knots Wave Height: 1-3 ft. Water Temperature: 52 ºF Air Temperature: 56 ºF Sea Level Pressure: 29.4 in of Hg Water Depth: 107 m
Scientific Blog
During the 1970’s fishermen made the observation that the Atlantic sea scallop was becoming hard to find. Overfishing had depleted the numbers and they were not repopulating at a steady rate. In the early 1980’s after noticing that nature wasn’t going to be able to keep up with man’s demands of the scallop, programs were set up to monitor the scallop fishing industry and to also set catch limits.
Live video from rear sonar devices
In 1997 NOAA and the New England Fishery Management Council determined that the Atlantic sea scallops were still being overfished and by 1998 a new plan for allowing the scallop to increase their numbers was implemented.
The guidelines for fishermen proved to be useful and the scallop industry had great success. It was reported that the scallop biomass harvested had increased eighteen times higher than the previous level between 1994 – 2005.
The demand for the Atlantic sea scallop did not decrease. The sea scallop adductor muscle, the muscle that holds the two shells together and allows the animal to open and close the two shells, is harvested for food. The muscle is typically 30 – 40 mm in diameter in adult sea scallops. The demand for this tasty muscle has made the Atlantic sea scallop fishing industry into a very powerful and prosperous billion-dollar industry.
Live forward sonar scanner
Fisherman will agree that science is essential to the health of their industry. It was determined that rotational management was needed for the scallops to replenish, much like crop rotation on land. After a period of time, areas need to rest without any activity and other areas can be reopened to scallop fishing after a period of time.
What that time period for rest is and what areas need to rest while other areas are opened to fishing is the science behind the industry. The industry recognizes that the science is essential to keep a healthy population of Atlantic sea scallops and, through a special research set-aside program, invests 25% of the scallops to research. The market value of the scallop, usually $10 -$14 per pound, determines the funding scientists can invest into research.
Resource management is not a new idea. Resources are managed at all levels whether they are animals such as scallops or deer, minerals or elements mined such as aluminum or coal, or even plants such as trees. Without management practices in place, there is a good possibility of endangering the resource for later use, and in the case of living animals, endanger their future viability.
Dr. Scott Gallager
Some of the “Research Set-Aside” monies given by the commercial fisherman have allowed the development of a special habitat mapping camera, affectionately called the HabCam. Dr. Scott Gallager has combined his two areas of expertise, biology and electronics and developed a series of cameras used for studying underwater habitats. NOAA has contracted Dr. Gallager to oversee the HabCam during the annual sea scallop survey.
While the original HabCam is being used by the commercial fishing industry on scallop vessels, a fourth generation HabCam is used by NOAA on the R/V Sharp to help with the annual Atlantic scallop survey. It has two sonar devices, one forward and one rear sonar scans a 50 meter swath on each side of the vehicle. It is equipped with four strobe lights that allow two cameras to take photographs. Each camera takes six pictures a second. The HabCam has a sensor called the CTD (Conductivity, Temperature, Depth) to measure physical properties such as salinity, temperature, depth, and dissolved oxygen. Two other sensors are used to measure turbidity, and a device that measures the scattering and absorption of light at that depth. Measuring absorption allows the computer to make color corrections on the pictures so the true colors of the habitat are seen. The vehicle is 3700 lbs. and made of stainless steel. It is actually towed through the water but is “driven” by using the metal jacketed fiber-optic tow cable which pulls it through the water. The HabCam relays the real-time images and data directly to the ship where it is processed by computers and also people monitoring the pictures. Computer Vision and Image Processing tools are also being developed to count and size scallops automatically from the images as the vehicle is being towed. This will allow managers in the future to use adaptive sampling approaches whereby the sampling track is actually changed as the vehicle is towed to optimize the survey.
HabCam on Right Side
By analyzing the data from the HabCam and doing dredges over mapped areas of the ocean, scientists can relay their findings to fisherman with suggestions on the best places to harvest Atlantic sea scallops. It is important to keep in mind the other animals in the area that may be affected by scallop fishing. The Yellowtail flounder is one such animals that could be better monitored with the aid of the HabCam. The flounder often is found living in areas that have a high density of sea scallops, but by identifying areas of high scallop and low yellowtail densities, fishermen may be better able to avoid yellowtail bycatch. Unfortunately, many bycatch fish do not survive the dredging and are often dead upon being returned to the sea.
While scallops and fish are certainly important to the commercial fishing industry, understanding the habitat that supports these organisms is paramount to their effective management. HabCam collects images that contain a huge amount of information on habitat factors such as temperature, salinity, chlorophyll, seafloor roughness, and substrate type (mud, sand, gravel, shells, boulders, etc). Habitat for one organism is not necessarily the same for the next so we need to put together maps of where certain habitats allow each species to exist and where they co-exist to form communities. Understanding this, we can simulate how communities will respond to climate change and other changing environmental factors such as Ocean Acidification (i.e., low ph), which all contribute to habitat.
Dr. Gallager working on the HabCam
Because of the success of the HabCam and other habitat monitoring/mapping devices, HabCams I – VI have been built. There are four different vehicles used now for specialized data collection depending on what the survey priorities are.
HabCam is a unique, and high-end technology, but at the same time is being upgraded to provide habitat data on a variety of sampling platforms such as high speed torpedo-like systems that are towed at 10 kts or greater and on robotic Autonomous Underwater Vehicles (AUV) that will carry the stereo cameras and sonar systems currently on HabCam. The combination of robotics with underwater sampling provides a window into the ocean universe that humans have not been able to effectively explore and sample because of the great pressure and low temperature of the deep sea. Abyssal habitat (deeper than 3000m) is very difficult to sample and more and more oceanographers are looking to develop and use robots to get to where observations and samples need to be taken.
Monitoring the screens for obstacles
While the HabCam was initially developed for the scallop fishing industry, it has clearly made an invaluable contribution to the study of habitats that have so long been inaccessible to us. There are many cameras throughout the world used to take pictures of the ocean bottom and even animals therein, but the HabCam series that was developed out of Woods Hole Oceanographic Institution (WHOI) is integrating many different data types to develop a more comprehensive understanding of fauna and flora (animals and plants) in their habitats worldwide. It is an exciting time for oceanic research!
Dr. Scott Gallager PhD, tenured Associate Scientist, Biology Department, Woods Hole Oceanographic Institution, Woods Hole, MA, Visiting Professor, Okinawa Institute of Science and Technology, Okinawa, Japan.
Personal Blog:
I am feeling great and meeting so many fascinating people! Dr. Gallager, or Scott to the scientists on board, has taught me so much in the very short time I’ve been on the ship. He has many great stories as he has been involved in oceanic research for many years. He was asked to study the teak wood that the Titanic was made of because “Bob” Ballard saw so little of it even though all the decks and ornamentations were made of it. So Bob asked Scott to study it and Scott wrote a paper on the polychaete worm that was able to break down the tough cellulose tissue.
After our dredging yesterday resulted in many scallops, you will never guess what we are having for our 12:00 p.m. meal. I said 12:00 p.m. meal because for some of us it is breakfast and for others it is supper.
Dogfish on the bottom of the ocean, Picture taken by the Habcam.
Me and the other five scientists are now done with our 12 hour shift and the new group just took over. We were running the HabCam all day and then looking at random still photos from the HabCam to identify the life forms that are present. Dr. Gallager is working on a computer image recognizing HabCam, but he feels it is important to have humans involved as well. I am so thankful I am on the same crew as Dr. Gallager. I am actually getting better with the whole time schedule shock. Not really a big deal once you try it. (Like most things in life.)
Skate on the bottom of the ocean. Picture taken by the HabCam.
NOAA Teacher at Sea Donna Knutson
Aboard R/V Hugh R. Sharp June 8 – June 24, 2016
2016 Mission: Atlantic Scallop/Benthic Habitat Survey Geographical Area of Cruise: Northeastern U.S. Atlantic Coast Date: June 12, 2016
Mission and Geographical Area:
The University of Delaware’s ship, R/V Sharp, is on a NOAA mission to assess the abundance and age distribution of the Atlantic Sea Scallop along the Eastern U.S. coast from Mid Atlantic Bight to Georges Bank. NOAA does this survey in accordance with Magnuson Stevens Act requirements.
Weather Data from the Bridge
Latitude: 40 26.375 N Longitude: 68 19.266 W Clouds: overcast Visibility: 5-6 nautical miles Wind: 21 knots at cruise speed of 4 knots Wave Height: 4-6 occasional 8 ft. Water Temperature: 56 °F Air Temperature: 70 °F Sea Level Pressure: 29.7 in of Hg Water Depth: 100 m
Science and Technology Log
There are four types of scallops that are found around the United States. The Sea Scallop is the largest and found primarily along the Eastern coast. Therefore, it is called the Atlantic Sea Scallop. Bay scallops are smaller, found closer to shore and are not usually harvested. The Calico mollusk is the smallest and rare, and is primarily located around the coast of Florida. The Icelandic scallop is also occasionally sighted around the United States.
The Atlantic Sea Scallop Placopecten magellanicus is a deep sea bivalve mollusk. It has a smooth shell and edges. Young scallops have a pink/red color with darker stripes radiating outward form the hinge. The older sea scallop is more orange in coloration and may fade into white. Photoreceptive eyes along their pale pink mantle, allow the scallop to sense changes in light allowing it to protect itself from possible dangers such as incoming predators.
Atlantic sea scallop
Some mollusks are hermaphroditic meaning they have both sex organs in the same animal, but the Atlantic sea scallop has two distinct sexes. It is impossible to tell what the sex of a scallop is from its outward appearance. When looking inside at the gonads it is easy to detect. The male gonads are creamy white and the female gonads are pink/red in color.
The female can reproduce after they are one-year-old, but four year olds release many more eggs. The older scallop may emit one to two hundred seventy million eggs at one time. Spawning occurs twice a year, once in the spring and another in the fall. Males will release their sperm into the water where the eggs have been released, and then the fertilized egg sinks to the bottom of the ocean to develop in groupings called beds.
Adult scallops will filter feed on phytoplankton and microscopic zooplankton. The immature larva are filter feeders as well, but can also absorb nutrients though their tissues.
Atlantic sea scallops play an important role in the ecosystem as they become food for other animals such as starfish, crabs, lobsters, snails, and fish such as cod, American plaice, wolfish, and winter flounder.
Sources:
Wikipedia, May 30, 2016
US Atlantic Sea Scallop, March 31, 2013
Personal Log
Leg III of the Atlantic Scallop/Benthic Habitat Survey started out a bit rough, bad weather came in from Hurricane Collin and caused a few delays. The lead scientist Tasha O’Hara decided to push back the departure times in hope of gentler seas.
We set sail on Thursday June 12, 2016 around 7 p.m. from NOAA’s Northeast Fisheries Science Center in Woods Hole. The Sharp started the third leg of four on the scallop survey. The last leg will end on June 24, 2016. The survey team will use a camera to take pictures of the bottom called a HabCam, which stands for Habitat Mapping Camera, and also dredge the ocean bottom periodically for physically counting and measuring specimens.
I have been allowed to participate in the driving of the HabCam and also the sorting, measuring and recording of animals brought up from the dredges. My blogging got a bit behind as I was trying to immerse myself in the new experiences when the sea sickness hit.
Donna holds a Goosefish
I did not get sick once on the last month long experience, but conditions here are a bit different. The captain of the Sharp, James Warrington, explained the gyre (oceanic current pattern) is unique here. We are in a cruising within circular gyre and with weather conditions forcing high waves into the flat bottomed boat, we are getting a lot of motion. So, yes, I now know what sea sickness is like. Today the wind has died down a bit so the waves are not as high, and I feel much better. I have been placed on the midnight to noon crew so that has been an adjustment as well. I’m sure you morning classes will agree I’m more active in the afternoon. Not really a morning person. J
Snake eel
Everyone is so great to me here. They were very considerate during my seasick time. I actually have been sitting up on the bridge with Captain Jimmy. I can see the horizon and feel more stable. Otherwise we are below decks looking at computer screens for the HabCam or working on the back deck looking at the dredged creatures.
Today we are doing some back tracking to get a start on more dredging and that has allowed me to get this blog in. I really wanted it to be sooner, but that’s the story.
NOAA Teacher at Sea Trevor Hance Aboard R/V Hugh R. Sharp June 12 – 24, 2015
Mission: Sea Scallop Survey Geographical area: New England/Georges Bank Date: June 21, 2015
Teacher at Sea?
Science and Technology Log
The rhythm of a ship rocking and rolling through varied wave heights while catching some zzzz’s in a small, curtain-enclosed bunk provides an opportunity to get some really amazing deep sleep. Last night I had a dream that one of my childhood friends married Dan Marino. It seemed completely bizarre until I remembered we saw lots of dolphins yesterday.
Dan? Mrs. Marino? Is that you?
Seas have calmed substantially from the ride we had a couple of days ago, and for the past few days the ride has been so smooth I feel more like a “Teacher at Pond” than “Teacher at Sea.” Unfortunately, it looks like that awful weather system my friends and family have been dealing back home in Texas is about to make its way to us here off the coast of New England (what many Texans consider “the southern edge of Santa-land”) and there’s even a chance today might be our last full day at sea.
At the helm: Estoy El Jefe!
Operations
Operationally, we’ve shifted back and forth from dredge to HabCam work and it is a decidedly different experience, and as with everything, there are pros and cons.
HabCam
As mentioned in an earlier blog, the HabCam requires two people to monitor two different stations as pilot and co-pilot, each with several monitors to help keep the system running smoothly and providing updates on things like salinity, depth and water temperature (currently 4.59 degrees Celsius – yikes!!!).
Views of the screens we monitor: from 6 o’clock, moving clockwise: the winch, altitude monitor, cameras of back deck, sonar of the sea floor and photos being taken as we travel
The pilot gets to drive the HabCam with a joystick that pays-out or pulls in the tow-wire, trying to keep the HabCam “flying” about 2 meters off the sea floor. Changes in topography, currents, and motion of the vessel all contribute to the challenge. The co-pilot primarily monitors and annotates the photographs that are continually taken and fed into one of the computers in our dry-lab. I’ll share more about annotating in the next blog-post, but essentially, you have to review, categorize and sort photos based on the information each contains.
The winch has its own monitor
Driving the HabCam gives you a feeling of adventure – I find myself imagining I am driving The Nautilus and Curiosity, but, after about an hour, things get bleary, and it’s time to switch and let one of the other crew members take over. My rule is to tap-out when I start feeling a little too much like Steve Zissou.
Dredge
Dredge work involves dropping a weighted ring bag that is lined with net-like material to the sea floor and towing it behind the vessel, where it acts as a sieve and filters out the smallest things and catches the larger things, which are sorted, weighed and measured in the wet lab on the back deck.
Close up of the dredge material; HabCam in the background
Dredge work is a little like the “waves-crashing-across-the-deck” stuff that you see on overly dramatized TV shows like “Deadliest Catch.” As my students know, I like getting my hands dirty, so I tend to very much enjoy the wind, water and salty experience associated with a dredge.
Yours truly, after a successful dredge, sporting my homemade Jolly Roger t-shirt
While the dredge is fun, my students and I use motion-triggered wildlife cameras to study the life and systems in the Preserve behind our school, and I fully realize the value those cameras provide — especially in helping us understand when we have too much human traffic in the Preserve. The non-invasive aspects of HabCam work provide a similar window, and a remarkable, reliable data source when you consider that the data pertaining to one particular photograph could potentially be reviewed thousands of times for various purposes. The sheer quantity of data we collect on a HabCam run is overwhelming in real-time, and there are thousands of photos that need to be annotated (i.e. – reviewed and organized) after each cruise.
More Science
Anyway, enough of the operational stuff we are doing on this trip for now, let’s talk about some science behind this trip… I’m going to present this section as though I’m having a conversation with a student (student’s voice italicized).
Life needs death; this is a shot of 8 or 9 different crabs feasting on a dead skate that settled at the bottom. Ain’t no party like a dead skate party…
Mr. Hance, can’t we look at pictures instead of having class? I mean, even your Mom commented on your blog and said this marine science seems a little thick.
We’ll look at pictures in a minute, but before we do, I need you to realize what you already know.
The National Wildlife Federation gives folks a chance to support biodiversity by developing a “Certified Wildlife Habitat” right in their own backyard. We used NWF’s plan in our class as a guideline as we learned that the mammals, amphibians, reptiles and birds we study in our Preserve need four basic things for survival: water, food, shelter and space (note: while not clearly stated in NWF’s guidelines, “air” is built in.)
This same guide is largely true for marine life, and because we are starting small and building the story, we should probably look at some physics and geology to see some of the tools we are working with to draw a parallel.
Ugh, more water and rocks? I want to see DOLPHINS, Mr. Hance!
Sorry, kid, but we’re doing water and rocks before more dolphins.
Keep in mind the flow of currents around Georges Bank and the important role they play in distributing water and transporting things, big and small. Remember what happened to Nemo when he was hanging out with Crush? You’ll see why that sort of stuff loosely plays in to today’s lesson.
Let There Be Light! And Heat!
As I mentioned in an earlier post, Georges Bank is a shallow shoal, which means the sea floor has a lot more access to sunlight than the deeper areas around it, which is important for two big reasons. First, students will recall that “light travels in a straight line until it strikes an object, at which point it….” (yada, yada, yada). In this case, the water refracts as it hits the water (“passes through a medium”) and where the water is really shallow, the sunlight can actually reflect off of the sea floor (as was apparent in that NASA photo I posted in my last blog.)
Also important is the role the sun plays as the massive energy driver behind pretty much everything on earth. So, just like in our edible garden back at school, the sun provides energy (heat and light), which we know are necessary for plant growth.
Okay, so we have energy, Mr. Hance, but what do fish do for homes?
The substrate, or the sediment(s) that make-up the sea floor on Georges Bank consists of material favorable for marine habitat and shelter. The shallowest areas of Georges Bank are made mostly of sand or shell hash (“bits and pieces”) that can be moved around by currents, often forming sand waves. Sand waves are sort of the underwater equivalent of what we consider sanddunes on the beach. In addition to the largely sandy areas, the northern areas of the Bank include lots of gravel left behind as glaciers retreated (i.e. – when Georges Bank was still land.)
Moving currents and the size of the sediment on the sea floor are important factors in scallop population, and they play a particularly significant role relating to larval transportation and settlement. Revisiting our understanding of Newton’s three laws of motion, you’ll recognize that the finer sediment (i.e. – small and light) are easily moved by currents in areas of high energy (i.e. – frequent or strong currents), while larger sediment like large grains of sand, gravel and boulders get increasingly tough to push around.
Importantly, not all of Georges Bank is a “high energy” area, and the more stable areas provide a better opportunity for both flora and fauna habitat. In perhaps simpler terms, the harder, more immobile substrates provide solid surfaces as well as “nooks and crannies” for plants to attach and grow, as well as a place for larvae (such as very young scallop) to attach or hide from predators until they are large enough to start swimming, perhaps in search of food or a better habitat.
With something to hold on to, you might even see what scientists call “biogenic” habitat, or places where the plants and animals themselves make up the shelter.
Substrate samples from one of our dredges; shells, sand, rocks/gravel/pebbles, “bio-trash” and a very young crabThere is one strand of a plant growing off of this rock we pulled up. Not much, but it’s something to hold on to!
Hmmmmmmmmmmmmm, rocks and one weed, huh… I wonder what’s happening at the pool…
Whoa, hold on, don’t quit — you’re half way there!
Before you mind drifts off thinking that there are coral reefs or something similar here, it is probably important that I remind you that the sea floor of Georges Bank doesn’t include a whole lot of rapid topography changes – remember, we are towing a very expensive, 3500 lb. steel framed camera at about 6 knots, and it wouldn’t make sense to do that in an area where we might smash it into a bunch of reefs or boulders. Here, things are pretty flat and relatively smooth, sand waves and the occasional boulder being the exceptions.
Okay, our scallops now have a place to start their life, but, what about breathing and eating, and why do they need “space” to survive? Isn’t the ocean huge?
As always, remember that we are trying to find a balance, or equilibrium in the system we are studying.
One example of a simple system can be found in the aquaponics systems we built in our classroom last year. Aquaponics is soil-less gardening, where fish live in a tank below a grow bed and the water they “pollute” through natural bodily functions (aka – “poop”) is circulated to the grow bed where the plants get the nutrients they need, filter out the waste and return good, healthy water back to the fish, full of the micronutrients the fish need to survive. I say our system is simple because we are “simply” trying to balance ammonia, nitrates and phosphates and not the vast number of variables that exist in the oceans that cover most of our Earth’s surface. Although the ocean is much larger on the spatial scale, the concept isn’t really that much different, the physical properties of matter are what they are, and waste needs to be processed in order for a healthy system to stay balanced.
Our simple classroom system
Another aspect of our aquaponics system that provides a parallel to Georges Bank lies in our “current,” which for us is the pump-driven movement of water from the fish to the plants, and the natural, gravity-driven return of that water to the fish. While the transportation of nutrients necessary to both parties is directionally the exact opposite of what happens here on Georges Bank (i.e. – the currents push the nutrients up from the depths here), the idea is the same and again, it is moving water that supports life.
But, Mr. Hance, where do those “nutrients” come from in the first place, and what are they feeding?
Remember, systems run in repetitive cycles; ideally, they are completely predictable. In a very basic sense where plants and animals are concerned, that repetitive cycle is “life to death to life to death, etc…” This is another one of those “here, look at what you already know” moments.
When marine life dies, that carbon-based organic material sinks towards the bottom of the ocean and continues to break down while being pushed around at depth along the oceans currents. Students will recognize a parallel in “The Audit” Legacy Project from this spring when they think about what is happening in those three compost bins in our edible garden; our turning that compost pile is pretty much what is happening to all of those important nutrients getting rolled around in the moving water out here – microscopic plants and animals are using those as building blocks for their life.
Our new compost system
Oh wait, so, this is all about the relationship between decomposers, producers and consumers? But, Mr. Hance, I thought that was just in the garden?
Yes, “nutrient rich” water is the equivalent of “good soil,” but, we have to get it to a depth appropriate for marine life to really start to flourish. Using your knowledge of the properties of matter, you figured out how and why the currents behave the way they do here. You now know that when those currents reach Georges Bank, they are pushed to the surface and during the warm summer months, they get trapped in this shallow(ish), warm(ish) sunlit water, providing a wonderful opportunity for the oceans’ primary producers, phytoplankton, to use those nutrients much like we see in our garden.
Ohhhhhhhhhhhh, I think I’m starting to see what you mean. Can you tell me a little more about plankton?
The term plankton encompasses all of the lowest members of the food chain (web), and can be further divided into “phytoplankton” and “zooplankton.” Yes, “phyto” does indeed resemble “photo,” as in “photosynthesis”, and does indeed relate to microscopic plant-like plankton, like algae. Zooplankton pertains to microscopic animal-like plankton, and can include copepods and krill.
Plankton are tiny and although they might try to swim against the current, they aren’t really strong enough, so they get carried along, providing valuable nutrients to bigger sea creatures they encounter. Just like on land, there are good growing seasons and bad growing seasons for these phytoplankton, and on Georges Bank, the better times for growing coincide with the spring-summer currents.
Dude, Mr. Hance, I didn’t know I already knew that…. Mind…. Blown.
Yeah little dude, I saw the whole thing. First, you were like, whoa! And then you were like, WHOA! And then you were like, whoa… Sorry, I got carried away; another Nemo flashback. While I get back in teacher-mode, why don’t you build the food web. Next stop, knowledge…
You’ve got some serious thrill issues, dude
But, Mr. Hance, you are on a scallop survey. How do they fit into the food web? You told us that you, crabs and starfish are their primary natural predators, but, what are they eating, and how?
Scallops are animals, complete with muscles (well, one big, strong one), a digestive system, reproductive system, and nervous system. They don’t really have a brain (like ours), but, they do have light-sensing eyes on their mantle, which is a ring that sits on the outer edge of their organ system housed under their protective shell. Acting in concert, those eyes help scallops sense nearby danger, including predators like those creepy starfish.
Predators
Scallops are filter feeders who live off of plankton, and they process lots of water. With their shells open, water moves over a filtering structure, which you can imagine as a sort of sieve made of mucus that traps food. Hair-like cilia transport the food to the scallop’s mouth, where it is digested, processed, and the waste excreted.
The text is small, but, it describes some of the anatomy of the scallop. Click to zoom.
But, Mr. Hance, do they hunt? How do they find their food?
Remember, scallops, unlike most other bivalves such as oysters, are free-living, mobile animals; in other words, they can swim to dinner if necessary. Of course, they’d prefer to just be lazy and hang out in lounge chairs while the food is brought to them (kind of like the big-bellied humans in my favorite Disney film, Wall-E), so can you guess what they look for?
Gee, Mr. Hance…. Let me guess, water that moves the food to them?
Yep, see, I told you this was stuff you already knew.
I highlighted the shadows in one of the HabCam photos to show you proof that scallop swim.
While plankton can (and do!) live everywhere in the shallow(ish) ocean, because they are helpless against the force of the current, they get trapped in downwellings, which is a unique “vertical eddy,” caused by competing currents, or “fronts.” Think of a downwelling as sort of the opposite of a tug-o-war where instead of pulling apart, the two currents run head-on into one another. Eventually, something’s gotta give, and gravity is there to lend a hand, pushing the water down towards the sea floor and away, where it joins another current and continues on.
Those of you who have fished offshore will recognize these spots as a “slick” on the top of the water, and there is often a lot of sea-foam (“bubbles”) associated with a downwelling because of the accumulation of protein and “trash” that gets stuck on top as the water drops off underneath it.
Those “smooth as glass” spots are where currents are hitting and downwellings are occurringThis particularly large group of birds gathered together atop a downwelling, likely because the water helped keep them together (and because fishing would be good there!)
Because plankton aren’t strong enough to swim against the current, they move into these downwellings in great numbers. You can wind up with an underwater cloud of plankton in those instances, and it doesn’t take long for fish and whales to figure out that nature is setting the table for them. Like our human friends in Wall-E, scallops pull up a chair, put on their bibs and settle at the base of these competing fronts, salivating like a Pavlovian pup as they wait on their venti-sized planko-latte (okay, I’m exaggerating; scallops live in salt water, so they don’t salivate, but because I’m not there to sing and dance to hold your attention while you read, I have to keep you interested somehow.)
If you become a marine scientist at Woods Hole, you’ll probably spend some time looking for the “magic” 60m isobaths, which is where you see scallop and other things congregate at these convergent fronts.
Before you ask, an isobaths is a depth line. Depth lines are important when you consider appropriate marine life habitat, just like altitude would be when you ask why there aren’t more trees when you get off the ski lift at the top of the mountain.
Um, Mr. Hance, why didn’t you just tell us this is just like the garden! I’m immediately bored. What else ya got?
Well, in the next class, we’ll spend some time talking about (over-)fishing and fisheries management, but for now, how about I introduce you to another one of my new friends and then show you some pictures?
I don’t know, Mr. Hance, all of this talk about water makes me want to go swimming. I’ll stick around for a few minutes, but this dude better be cool.
Lagniappe: Dr. Burton Shank
Today, I’ll introduce another important member of the science crew aboard the vessel, Dr. Burton Shank. As I was preparing for the voyage, I received several introductory emails, and I regret that I didn’t respond to the one I received from Burton asking for more information. He’s a box of knowledge.
That’s Burton, on the right, sorting through a dredge with lots and lots of sand dollars.
Burton is a Research Fishery Biologist at National Marine Fisheries Service in Woods Hole working in the populations dynamic group, which involves lots of statistical analysis (aka – Mental Abuse To Humans, or “MATH”). Burton’s group looks at data to determine how many scallops or lobsters are in the area, and how well they are doing using the data collected through these field surveys. One of my students last year did a pretty similar study last year, dissecting owl pellets and setting (humane) rat traps to determine how many Great Horned Owls our Preserve could support. Good stuff.
Burton is an Aggie (Whoop! Gig ‘Em!), having received his undergraduate degree from Texas A&M at Galveston before receiving his master’s in oceanography from the University of Puerto Rico and heading off as a travelling technical specialist on gigs in Florida, Alaska and at the Biosphere in Arizona. For those unfamiliar, the biosphere was a project intended to help start human colonies on other planets, and after a couple of unsuccessful starts, the research portion was taken over by Columbia University and Burton was hired to do ocean climate manipulations. Unlike most science experiments where you try to maintain balance, Burton’s job was to design ways that might “wreck” the system to determine potential climate situations that could occur in different environments.
As seems to be the case with several of the folks out here, Burton didn’t really grow up in a coastal, marine environment, and in fact, his childhood years were spent in quite the opposite environment: Nebraska, where his dad was involved in agricultural research. He did, however, have a small river and oxbow like near his home and spent some summers in Hawaii.
It was on during a summer visit to Hawaii at about 9 years old that Burton realized that “life in a mask and fins” was the life for him. On return to Nebraska, home of the (then!) mighty Cornhusker football team, many of his fellow fourth grade students proclaimed that they would be the quarterback at Nebraska when they grew up. Burton said his teacher seemed to think being the Cornhusker QB was a completely reasonable career path, but audibly scoffed when he was asked what he wanted to be and said he would be a marine biologist when he grew up. I welcome any of you young Burton’s in my class, anytime – “12th Man” or not!
Photoblog:
Sheerwater, I loved the reflection on this oneSuch a nice dayYou’ll never look at them the same, will you?Cleaning up after a dredge; shot from vestibule where wet-gear is housed. We spent lots of time changing.So fun to see lobsters and crabs when “HabCam’ing.” They rear back and raise their claws as if to dare you to get any closer.Good night!
Playlist: Matisyahu, Seu Jorge, Gotan Project, George Jones
Weather Data from the bridge: Wind SW 18-20 knots, Seas 4-7 ft, Visibility – good
Science and Technology Log: Starring the HabCam
The HabCam is a computerized video camera system. It is a non-invasive method of observing and recording underwater stereo images, and collecting oceanographic data,such as temperature,salinity, and conductivity. The vehicle is towed at 1.5 – 2 meters from the floor of the ocean. The main objective of this mission is to survey the population of scallops as well as noting the substrate (ocean floor make-up) changes. Most substrate is made up of sand, gravel, shell hash and epifauna. We also note the presence of roundfish (eel, sea snakes, monkfish, ocean pout, and hake), flatfish (flounders and fluke), whelk, crab, and skates. Although sea stars (starfish) are a major predator of scallops, they are not included in our annotations.
The HabCam awaiting deployment.
The crew and science staff work on alternate shifts (called watches) to ensure the seamless collection of data. The scallop survey is a 24-hour operation. The science component of the ship consists of 11 members. Six people are part of the night watch from 12am-12pm and the remaining members (myself included) are assigned to the day watch which is from 12pm until 12am. During the HabCam part of the survey all science staff members rotate job tasks during their 12-hour shift. These include:
A. Piloting the HabCam – using a joystick to operate the winch that controls the raising and lowering of the HabCam along the ocean floor. This task is challenging for several reasons. There are six computer monitors that are continually reviewed by the pilot so they can assess the winch direction and speed, monitor the video quality of the sea floor, and ensure that the HabCam remains a constant 1.5 – 2 meters from the ocean floor. The ocean floor is not flat – it consists of sand waves, drop-offs, and valleys. Quick action is necessary to avoid crashing the HabCam into the ocean floor.
Carol piloting the HabCam.
B. The co-pilot is in charge of ensuring the quality of digital images that are being recorded by the HabCam. Using a computer, they tag specific marine life and check to see if the computers are recording the data properly. They also assist the pilot as needed.
One of the images from the HabCam
C. Annotating is another important task on this stage of the survey. Using a computer, each image that is recorded by the HabCam is analyzed in order to highlight the specific species that are found in that image. Live scallops are measured using a line tool and fish, crabs, whelk and skates are highlighted using a boxing tool so they can be reviewed by NOAA personnel at the end of the cruise season.
Personal Log:
When not on watch there is time to sleep, enjoy beautiful ocean views, spot whales and dolphins from the bridge (captain’s control center), socialize with fellow science staff and crew members, and of course take lots of pictures. The accommodations are cozy. My cabin is a four-person room consisting of two sets of bunk beds, a sink, and desk area. The room is not meant to be used for more than sleeping or stowing gear. When the ship is moving, it is important to move slowly and purposely throughout the ship. When going up and down the stairs you need to hold onto the railing with one hand and guide the other hand along the wall for stability. This is especially important during choppy seas. The constant motion of the ship is soothing as you sleep but makes for challenging mobility when awake.
My home away from home.Captain Jimmy runs a tight ship.
Before heading out to sea it is important to practice safety drills. Each person is made aware of their muster station (where to go in the event of an emergency), and is familiarized with specific distress signals. We also practiced donning our immersion suits. These enable a person to be in the water for up to 72 hours (depending upon the temperature of the water). There is a specific way to get into the suit in order to do so in under a minute. We were reminded to put our shoes inside our suit in a real life emergency for when we are rescued. Good advice indeed.
Carol dons her immersion suit.Life jacket selfie.
Did you know?
The ship makes it’s own drinking water. While saltwater is used on deck for cleaning purposes, and in the toilets for waste removal, it is not so good for cooking, showers, or drinking. The ship makes between 600 and 1,000 gallons per day. It is triple-filtered through a reverse-osmosis process to make it safe for drinking. The downside is that the filtration system removes some important minerals that are required for the human body. It also tends to dry out the skin; so using moisturizer is a good idea when out at sea.
Photo Gallery:
Waiting to board the RV Hugh R. SharpWest Genesee colors; flying high on the SharpFloating Frogs at the Woods Hole Biological Museum.Seal at the Woods Hole Aquarium – Oldest Aquarium in the US.