Katie Gavenus, Bonus Blog: MIXOTROPHS, May 5, 2019

NOAA Teacher at Sea

Katie Gavenus

Aboard R/V Tiglax

April 26 – May 9, 2019

Mission: Northern Gulf of Alaska Long-Term Ecological Research project

Geographic Area of Cruise: Northern Gulf of Alaska – currently in transit from ‘Seward Line’ to ‘Kodiak Line’

Date: May 5, 2019

Weather Data from the Bridge

Time: 2305
Latitude: 57o 34.6915’
Longitude: 150o 06.9789’
Wind: 18 knots, South
Seas: 4-6 feet
Air Temperature: 46oF (8oC)
Air pressure: 1004 millibars
Cloudy, light rain


Science and Technology Log

I was going to just fold the information about mixotrophs into the phytoplankton blog, but this is so interesting it deserves its own separate blog!

On land, there are plants that photosynthesize to make their own food. These are called autotrophs – self-feeding.  And there are animals that feed on other organisms for food – these are called heterotrophs – other-feeding.  In the ocean, the same is generally assumed.  Phytoplankton, algae, and sea grasses are considered autotrophs because they photosynthesize.  Zooplankton, fish, birds, marine mammals, and benthic invertebrates are considered heterotrophs because they feed on photosynthetic organisms or other heterotrophs.  They cannot make their own food.  But it turns out that the line between phytoplankton and zooplankton is blurry and porous.  It is in this nebulous area that mixotrophs take the stage!

Mixotrophs are organisms that can both photosynthesize and feed on other organisms.  There are two main strategies that lead to mixotrophy.  Some organisms, such as species of dinoflagellate called Ceratium, are inherently photosynthetic.  They have their own chloroplasts and use them to make sugars.  But, when conditions make photosynthesis less favorable or feeding more advantageous, these Ceratium will prey on ciliates and/or bacteria.  Bacteria are phosphorous, nitrogen, and iron rich so it is beneficial for Ceratium to feed on them at least occasionally. Microscopy work makes it possible to see the vacuole filled with food inside the photosynthetic Ceratium. 

illustration of mixotrophic dinoflagellate Ceratium
I created this drawing after viewing a number of microscopy photos of the mixotrophic dinoflagellate Ceratium under different lights and stains. This artistic rendition combines those different views to show the outside structure of the dinoflagellate as well as the nucleus, food vacuole and chloroplasts. (Drawing by Katie Gavenus)

Other organisms, including many ciliates, were long known to be heterotrophic.  They feed on other organisms, and it is particularly common for them to eat phytoplankton and especially cryptophyte algae. Recent research has revealed, however, that many ciliates will retain rather than digest the chloroplasts from the phytoplankton they’ve eaten and use them to photosynthesize for their own benefit. Viewing these mixotrophs under blue light with a microscope causes the retained chloroplasts to fluoresce.  I saw photos of them and they are just packed with chloroplasts!
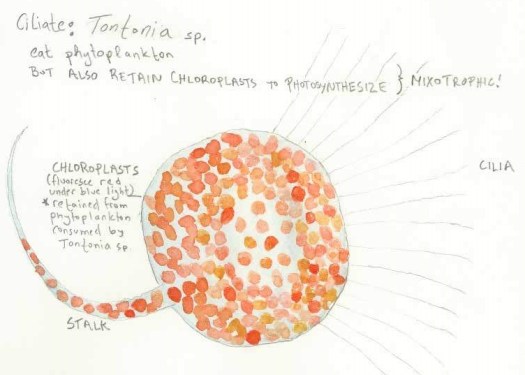
illustration of mixotrophic ciliate Tontonia sp.
The mixotrophic ciliate Tontonia sp. eats phytoplankton but retains the chloroplasts from their food in order to photosynthesize on their own! I made this drawing based off of photos, showing both the outside structure of the Tontonia and how the chloroplasts fluoresce as red when viewed with blue light. (Drawing by Katie Gavenus)

Mixotrophs are an important part of the Gulf of Alaska ecosystem.  They may even help to explain how a modestly productive ecosystem (in terms of phytoplankton) can support highly productive upper trophic levels. Mixotrophy can increase the efficiency of energy transfer through the trophic levels, so more of the energy from primary productivity supports the growth and reproduction of upper trophic levels. They also may increase the resiliency of the ecosystem, since these organisms can adjust to variability in light, nutrients, and phytoplankton availability by focusing more on photosynthesis or more on finding prey. Yet little is known about mixotrophs.  Only about one quarter of the important mixotroph species in the Gulf of Alaska have been studied in any way, shape or form!

Researchers are trying to determine what kinds of phytoplankton the mixotrophic ciliates and dinoflagellates are retaining chloroplasts from.  They are also curious whether this varies by location, season or year.  Understanding the conditions in which mixotrophic organisms derive energy from photosynthesis and the conditions in which they choose to feed is another area of research focus, especially because it has important ramifications for carbon and nutrient cycling and productivity across trophic levels.  And it is all very fascinating!

food web illustration
A drawing illustrating a fascinating, tightly linked portion of the Gulf of Alaska food web. Mesodinium rubrum must eat cryptophyte algae (this is called obligate feeding). The Mesodinium rubrum retain the chloroplasts from the cryptophyte algae, using them to supplement their own diet through photosynthesis. In turn, Dinophysis sp. must feed on Mesodinium rubrum. And the Dinophysis retain the chloroplasts from the Mesodinium that originally were from cryptophyte algae! (Drawing by Katie Gavenus)

Did you know?

Well over half of the oxygen on earth comes from photosynthetic organisms in the ocean.  So next time you take a breath, remember to thank phytoplankton, algae, and marine plants!

Personal Log:

Tonight was likely our last full night of work, as we expect rough seas and high winds will roll in around midnight tomorrow and persist until the afternoon before we head back to Seward.  We were able to get bongo net sampling completed at 6 stations along the Kodiak Line, and hope that in the next two nights we can get 2-4 stations done before the weather closes in on us and 2-4 nets on the last evening as we head back to Seward.

Despite our push to get 6 stations finished tonight, we took time to look more closely at one of the samples we pulled up.  It contained a squid as well as a really cool parasitic amphipod called Phronima that lives inside of a gelatinous type of zooplankton called doliolids.  Check out the photos and videos below for a glimpse of these awesome creatures (I couldn’t figure out how to mute the audio, but I would recommend doing that for a less distracting video experience).



Phronima
A parasitic Phronima amphipod. This animal typically lives inside doliolids, a type of gelatinous zooplankton. Apparently its body structure and fierce claw-like appendages inspired the design of “Predator.”


Martha Loizeaux: Plankton Palooza, August 22, 2018

NOAA Teacher at Sea

Martha Loizeaux

Aboard NOAA Ship Gordon Gunter

August 22-31, 2018


Mission: Summer Ecosystem Monitoring Survey

Geographic Area of Cruise: Northeast Atlantic Ocean

Date: August 22, 2018


Weather Data from the Bridge

  • Latitude: 991 N
  • Longitude: 590 W
  • Water Temperature: 22.3◦C
  • Wind Speed: 1 knots
  • Wind Direction: WSW
  • Air Temperature: 23.3◦C
  • Atmospheric Pressure: 66 millibars
  • Sky: Mostly Cloudy


Science and Technology Log

Haven’t you always dreamed of having your own Imaging Flow Cyto Bot (IFCB)?  What an interesting scientific instrument that I am lucky enough to be taking care of while on this cruise!  Before we even left the dock, Jessica Lindsey (volunteer from the Maine Maritime Academy) and I were trained by Emily Peacock, research associate at Woods Hole Oceanographic Institution, on how to run this amazing piece of equipment!

The IFCB is a computer, microscope, camera, and water flow controller all in one.  Emily describes it as “plumbing combined with electronics”.  It uses a water intake system from the ship to run a constant flow of water into extremely tiny hoses. As the water flows through these hoses, a laser beam of light shoots at every tiny particle that is in the water.  The tiny particles in the water, mainly phytoplankton (microscopic drifting plants), react to the sudden burst of light.  The phytoplankton scatters the light and also can react by fluorescing (reacting to one wavelength of light by giving off a different wavelength).  The computer detects this scattering and fluorescing to determine where the phytoplankton is in the water flow.  The microscope focuses in on each phytoplankton cell and the camera takes a picture!  Scientists simply get the IFCB going and at the end of the day they have hundreds of pictures of plankton!  Isn’t that incredible?!

Martha IFCB
Here I am learning how to use the IFCB! It is SO COOL!

One thing I’ve learned about this particular cruise is that it’s all about plankton!  We are collecting samples and data for scientists at the University of Rhode Island, Woods Hole Oceanographic Institution, and NOAA’s own Narragansett Lab, just to name a few.  What are all of these scientists studying?  Plankton!  Why?  Plankton is the microscopic lifeblood of the ocean.  The word plankton comes from a Greek word, oikos, meaning “drifter.”  Plankton refers to all the living things of the ocean that are drifting with the currents.  They are present throughout the water column and consist of two types:  phytoplankton and zooplankton.  Can you guess the difference?  Phytoplankton is like a plant.  It has chlorophyll and does photosynthesis.  Zooplankton is an animal.  There are many zooplankton species that hunt, hide, and do other things that larger animals do.  Most plankton is microscopic or close to it.  Phytoplankton does at least half of all the photosynthesis in the WORLD.  So you can think that every other breath you take contains oxygen created by phytoplankton.

Both types of plankton are the base of the marine food chain. If major changes happen in the community of plankton in the sea, these changes will impact the entire food chain all the way up to the apex predators (top predators).  So, as you can see, plankton is SUPER important.  If plankton populations are healthy, it indicates that much of the rest of the ecosystem is healthy too.

Some scientists use equipment, like the IFCB, to study samples of phytoplankton.

plankton on screen
Associate Researcher Emily showing us the program that allows you to see pictures of the phytoplankton sampled.

We also are collecting zooplankton in nets (called “bongo” nets) and preserving samples for scientists to analyze in the lab.  More on that to come soon!

My students have been learning that scientists always start an experiment with a question.

Scientists on this mission are not exactly leading an experiment, but they are responsible for monitoring.  The monitoring of an ecosystem tells us WHAT is happening there.  Scientists from all over the world can then use the monitoring data that we find to research and experiment WHY things are happening the way they are.  This is where the scientific method will come in and an experiment will start with a question.

For example, through the plankton samples that we take on this monitoring mission, scientists may notice a change in the amount of larval hake (tiny baby hake fish).  They can then ask the question, “Why are larval hake populations decreasing?” which may lead them to a hypothesis such as, “larval hake populations are decreasing due to climate change”.  They can test this hypothesis by comparing the plankton data to other types of data (such as pH and water temperature) in the same areas over time.  Thus, an experiment!

So our job now is to collect the important data that can help scientists understand what’s happening and think of ways to investigate “why” and “how”.

Bottom line, I really love plankton.  And you should too.  That breath you just took?  Thank plankton.

screen shot of plankton
Pictures of glorious plankton!


Scientist Spotlight – John Loch – Seabird Observer

Enough about plankton!  During all of this plankton excitement, I have also spent some time on the fly bridge (the top level of the deck of the ship), asking questions to our two seabird observers, John and Chris.  Their job is to stand watch all day, looking for and identifying seabirds, marine mammals, sea turtles, and any notable (large) animals.  Here’s a little interview with John Loch, Seabird Observer:


Seabird observer
John observing seabirds from the fly bridge

Me – Why is your job so important?

John – My job is to monitor seabird populations to help detect changes in numbers or distribution of species.  We estimate a 300 square meter area around the ship and record all birds seen within that area.  We enter our data into a computer, noting species, life stage, number seen, and direction of flight.  Over time, we may notice trends in numbers and distribution which is important to understand this ecosystem.


Me – What do you enjoy most about your job?

John – I enjoy seeing anything new or rare.


Me – How could scientists use your monitoring data to lead an investigation (using the scientific method)?

John – Our data has shown, for example, that some populations of birds, such as the gannet, have steadily declined over the last 20 years.  Researchers can ask “Why are gannet populations declining?” and can use oceanographic data in combination with bird observation data to come up with a hypothesis to test.


Personal Log

I was excited to get underway this afternoon!  Although many of us slept on the ship last night, we have been on the dock until 2:30 this afternoon, when we finally watched the crew release the lines and the ship cruise through the harbor and out to sea!

bow in harbor
A view of the bow as we head out to sea!!

We began our day with a scientist meeting where Harvey Walsh, our Chief Scientist, explained our route and the “stations” where we would be slowing down or stopping the ship to take our data.  He explained our 3am-3pm/3pm-3am shifts that we alternate so that whenever a station is reached, day or night, data can be collected.  I’m lucky to intersect these shifts and work “on watch” from 8am-8pm!  This means that I will support and assist scientist in their data collection during this time, and generally be present and available.

Scientist showing route
Chief Scientist Harvey explaining our route on the Northeast Shelf.

We also heard from Libby, our Operations Officer, who explained our state rooms, bathrooms, shared spaces, and general “do’s and don’ts” of the ship.

Safety briefing
Libby, our Field Operations Officer, explaining the safety procedures of Gordon Gunter

I have to say I am pleasantly surprised by our living quarters aboard NOAA Ship Gordon Gunter.  I have my own state room with a shared bathroom, small closet, sink, and even a desk.  It is quite spacious!  I’m also excited about the food options on board, but more about that later!

view from room window
The view from my state room…not bad!

Tonight is our first night out at sea!  Luckily, I’m not feeling seasick, but rocking and rolling as I type this does feel pretty strange!  Everyone says we’ll get used to it and it will feel normal in no time.

I am so excited for our first morning and sunrise out at sea!  Stay tuned!


Did You Know?

Phytoplankton come in all different colors, just like the flowers in your garden.  Since they are so tiny, we don’t see the colors unless there is a lot of plankton all together.  They also contain more than one color in their cells, similar to leaves that change from green to brown, red, or orange.

noaa phytoplankton
Colorful phytoplankton, photo courtesy of NOAA

Question of the Day

Do you think the amount and type of plankton in an area can affect how many sharks live there?  Why?

NOAA shark
Do sharks rely on plankton? Photo courtesy of NOAA


Kevin Sullivan: Bering Sea Bound, August 22, 2011

NOAA Teacher at Sea
Kevin C. Sullivan
Aboard NOAA Ship Oscar Dyson
August 17 — September 2, 2011

Mission: Bering-ALeutian Salmon International Survey (BASIS)
Geographical Area:  Bering Sea
Date:  August 22-24, 2011

Weather Data from the Bridge
Latitude:  N
Longitude:  W
Wind Speed:  20-23kts Tue,Wed. seas 9′ Thu 8/25 = calm
Surface Water Temperature:  C
Air Temperature:  55F
Relative Humidity: 70%

Science and Technology Log

We are on Day II of our travels to get to our first sampling station located in the SE Bering Sea.  We will begin our fishing operations today!  We have had decent weather thus far although we did just go through Unimak Pass (see picture below of location) which is a narrow strait between the Bering Sea and the North Pacific Ocean.  This passage offered a time of heavier seas.  I’m guessing that like any strait, the currents may become more funneled and the seas “confused” as they squeeze through this area.  It’s kind of analogous to it being more windy in between buildings of a major city vs. suburbia as the wind is funneled between skyscrapers.  I also imagine this to be a popular crossing for marine mammals as well.

Interesting to think that both marine mammals and humans use this passage to both get to the same things: a food source and a travel route.  It’s a migratory “highway” for marine mammals, and a heavily-trafficked area for humans in international trade and commercial fisheries.

Anyway, the Bering Sea is a very unique body of water. It really is the way that I imagined it.  It is as though you are looking through a kaleidoscope and the only offerings are 1000 different shades of grey.  It is rainy, foggy, and windy.  I can appreciate how this sea has been the graveyard for so many souls and fishing vessels in the past who have tried to extract the bounties it has to offer.

unimak pass
unimak pass

As of Wednesday, the 24th, we have finished 4 stations of the 30 that have been planned for Leg I of this study (Leg II is of similar duration and goals).  I was involved with helping the oceanographic crew with their tasks of collecting and evaluating various parameters of water chemistry.  To do this, an instrument called a “CTD”– an acronym for Conductivity, Temperature, and Depth — is lowered.  This instrument is the primary tool for determining these essential physical properties of sea water.  It allows the scientists to record detailed charting of these various parameters throughout the water column and helps us to understand how the ocean affects life and vice-versa.

One aspect that I found very interesting is the analyzing of chlorophyll through the water column.  All plant life on Earth contains the photosynthetic pigment called chlorophyll.  Phytoplankton (planktonic plants) occupy the photic zone of all water bodies.  Knowing that we live on a blue planet dominated by 70% coverage in water, we can thank these phytoplankton for their byproduct in photosynthesis, which is oxygen.  Kind of strange how you often symbolize the environmental movement with cutting down of the rainforests and cries that we are eliminating the trees that give us the air we breath.  This is true, but proportionately speaking, with an ocean-dominated sphere, we can thank these phytoplankton and photosynthetic bacteria for a large percentage of our oxygen.  Additionally, being at the base of the food chain and primary consumers, these extraordinary plants have carved a name for themselves in any marine investigation/study.

The procedure to measure chlorophyll involves the following:  water from the Niskin Bottles (attached to the CTD, used to “capture” water at select depths) is filtered through different filter meshes and the samples are deep-frozen at -80F.  To analyze chlorophyll content, the frozen sample filter is immersed in a 90% solution of DI (Distilled Water) and acetone which liberates the chlorophyll from the phytoplankton.  This is then sent through a fluorometer.

Filtering water from CTD for Chlorophyll Measurements

Fluorescence is the phenomena of some compounds to absorb specific wavelengths of light and then, emit longer wavelengths of light.  Chlorophyll absorbs blue light and emits, or fluoresces, red light and can be detected by this fluorometer.

Fluorometer; Berring Sea 08-25-11

Amazing to think that with this microscopic plant life, you can extrapolate out and potentially draw some general conclusions about the overall health of a place as large as the Bering Sea. Oceanographic work is remarkable.

CTD Berring Sea 08-24-11


Personal Log

The crew aboard the Oscar Dyson have been very accommodating and more than willing to educate me and take the time to physically show me how these scientific investigations work.  I am very impressed with the level of professionalism.  As a teacher, I know that most often, the best way to teach students is to present the material in a hands-on fashion…inquiry/discovery based.   This is clearly the format that I have been involved in while in the Bering Sea and I am learning a tremendous amount of information.

The food has been excellent (much better than I am used to while out at sea).  The seas have been a bit on the rough side but seem to be settling down somewhat (although, I do see a few Low Pressure Systems lined up, ready to enter the Bering Sea…..tis the season).  Veteran seamen in this area and even in the Mid-Atlantic off of NJ, know that this is the time of year when the weather starts to change). On a side note, I see that Hurricane Irene has its eyes set on the Eastern Seaboard.  I am hoping that everyone will take caution in my home state of NJ.

Lastly, it’s amazing also to think of the depth and extent of NOAA.  With oceans covering 70% of our planet and the entire planet encompassed by a small envelope of atmosphere that we breathe, it is fair to say that the National Oceanic and Atmospheric Administration is a part of our everyday lives.  I am in the Bering Sea, one of the most remote and harsh places this planet has to offer and across the country, there are “Hurricane Hunters” flying into the eye of a hurricane that could potentially impact millions of people along the Mid Atlantic………..Both operated and run by NOAA!

Sunset on the Berring Sea 08-24-11
Sunset on the Bering Sea 08-24-11

Becky Moylan: Preliminary Results, July 13, 2011

NOAA Teacher at Sea
Becky Moylan
Onboard NOAA Ship Oscar Elton Sette
July 1 — 14, 2011


Mission: IEA (Integrated Ecosystem Assessment)
Geographical Area: Kona Region of Hawaii
Captain: Kurt Dreflak
Science Director: Samuel G. Pooley, Ph.D.
Chief Scientist: Evan A. Howell
Date: July 13, 2011

Ship Data

Latitude 1940.29N
Longitude 15602.84W
Speed 5 knots
Course 228.2
Wind Speed 9.5 knots
Wind Dir. 180.30
Surf. Water Temp. 25.5C
Surf. Water Sal. 34.85
Air Temperature 24.8 C
Relative Humidity 76.00 %
Barometric Pres. 1013.73 mb
Water Depth 791.50 Meters

Science and Technology Log

Results of Research

Myctophid fish and non-Myctophid fish, Crustaceans, and gelatinous (jelly-like) zooplankton
Crustaceans
Chief Scientist guiding the CTD into the ocean

Beginning on July 1st, the NOAA Integrated Ecosystem Assessment project (IEA) in the Kona region has performed scientific Oceanography operations at eight stations.  These stations form two transects (areas) with one being offshore and one being close to shore. As of July 5th, there have been 9 CTD (temperature, depth and salinity) readings, 7 mid-water trawls (fish catches), over 15 acoustics (sound waves) recordings, and 30 hours of marine mammal (dolphins and whales) observations.

The University of Hawaii Ocean Sea Glider has been recording its data also.The acoustics data matches the trawl data to tell us there was more mass (fish) in the close to shore area than the offshore area. And more mass in the northern area than the south. This is evidence that the acoustics system is accurate because what it showed on the computer matched what was actually caught in the net. The fish were separated by hand into categories: Myctophid fish and non-Myctophid fish, Crustaceans, and gelatinous (jelly-like) zooplankton.

Variety of Non-Myctophid Fish caught in the trawl

The CTD data also shows that there are changes as you go north and closer to shore. One of the CTD water sample tests being done tells us the amount of phytoplankton (plant) in different areas. Phytoplankton creates energy by making chlorophyll and this chlorophyll is the base of the food chain. It is measured by looking at its fluorescence level. Myctophids eat phytoplankton, therefore, counting the amount of myctophids helps create a picture of how the ecosystem is working.

The data showed us more Chlorophyll levels in the closer to shore northern areas . Phytoplankton creates energy using photosynthesis (Photo = light, synthesis  = put together) and is the base of the food chain. Chlorophyll-a is an important pigment in photosynthesis and is common to all phytoplankton. If we can measure the amount of chlorophyll-a in the water we can understand how much phytoplankton is there. We measure chlorophyll-a by using fluorescence, which sends out light of one “color” to phytoplankton, which then send back light of a different color to our fluorometer (sensor used to measure fluorescence). Myctophids eat zooplankton, which in turn eat phytoplankton. Therefore, counting the amount of myctophids helps create a picture of how the ecosystem is working.   The data showed us more chlorophyll-a levels in the closer to shore northern areas.

Bringing in the catch

The Sea Glider SG513 has transmitted data for 27 dives so far, and will continue to take samples until October when it will be picked up and returned to UH.

Overall the mammal observations spotted 3 Striped dolphins, 1 Bottlenose dolphin, and 3 Pigmy killer whales.  Two biopsy “skin” samples were collected from the Bottlenose dolphins. A main part of their research, however, is done with photos. They have so far collected over 900 pictures.

Looking at all the results so far, we see that there is an area close to shore in the northern region of Kona that has a higher concentration of marine life.  The question now is why?

We are now heading south to evaluate another region so that we can get a picture of the whole Eastern coastline.

Personal Log

In the driver's seat
Krill
Krill

And on deck the next morning we found all kinds of krill, a type of crustacean. Krill are an important part of the food chain that feed directly on phytoplankton. Larger marine animals feed on krill including whales. It was a fun process finding new types of fish and trying to identify them.Last night I found a beautiful orange and white trumpet fish. We also saw many transparent (see-through) fish with some having bright silver and gold sections. There were transparent crabs, all sizes of squid, and small clear eels. One fish I saw looked like it had a zipper along the bottom of it, so I called it a “zipperfish”. A live Pigmy shark was in the net, so they put it in a bucket of water for everyone to see. These types don’t ever get very big, less than a foot long.

I have really enjoyed living on this ship, and it will be sad to leave. Everyone treated me like I was part of the group. I have learned so much about NOAA and the ecosystem of the Kona coastline which will make my lessons more interesting this year. Maybe the students won’t be bored!

Sunrise over Kona Region

Sunrise
Sunrise

Heather Haberman: Plankton, July 9, 2011 (post #3)

NOAA Teacher at Sea
Heather Haberman

Onboard NOAA Ship Oregon II
July 5 — 17, 2011


Mission:  Groundfish Survey
Geographical Location:  Northern Gulf of Mexico
Date:  Saturday, July 09, 2011

Weather Data from  NOAA Ship Tracker
Air Temperature:  30.4 C   (86.7 F)
Water Temperature: 29.6 C   (85.3 F)
Relative Humidity: 72%
Wind Speed: 6.69 knots   (7.7 mph)

Preface:  Scroll down the page if you would like to read my blog in chronological order.  If you have any questions leave them for me at the end of the post.

Science and Technology Log

Topic of the Day:  Plankton, the most important organisms on the planet.

Say the word plankton to a class full of students and most of them will probably think of a small one-eyed cartoon character.  In actuality plankton are some of the most important organisms on our planet.  Why would I so confidently make such a bold statement?  Because without plankton, we wouldn’t be here, nor would any other organism that requires oxygen for life’s processes.

Plankton are a vital part of the carbon and oxygen cycles.  They are excellent indicators of water quality and are the base of the marine food web, providing a source of food and energy for most of the ocean’s ecosystem’s.  Most plankton are categorized as either phytoplankton or zooplankton.

Question:  Can you identify which group of plankton are the plants and which are the animals based on the prefix’s?

Simple marine food web. Image: NOAA

Phyto comes from a Greek word meaning “plant” while planktos means “to wander”.  Phytoplankton are single-celled plants which are an essential component of the marine food web.  Plants are producers meaning they use light energy from the sun, and nutrients from their surroundings, to photosynthesize and grow rather than having to eat like animals, which are consumers.   Thus producers allow “new” energy to enter into an ecosystem which is passed on through a food chain.

Because phytoplankton photosynthesize, they also play an important role in regulating the amount of carbon dioxide in our atmosphere while providing oxygen for us to breathe.  Scientists believe that the oceans currently absorb between 30%-50% of the carbon dioxide that enters into our atmosphere.

Did you know:  It is estimated that marine plants, including phytoplankton, are responsible for 70-80% of the oxygen we have in our atmosphere.  Land plants are only responsible for 20-30%.

Diatoms are one of the most common forms of phytoplankton. Photo: NOAA

Question:  Since phytoplankton rely on sun and nutrients for their energy, where would you expect to find them in greater concentrations, near the coast or far out at sea?

Red and orange indicate high concentrations of phyoplankton. Concentrations decrease as you go down the color spectrum. Image from NASA's SeaWiFS mission

Notice the greatest concentration of phytoplankton occur near coastal areas.  This is because they rely on nutrients such as nitrogen and phosphorus for their survival.  These nutrients are transferred to the sea as rains wash them from our land into the rivers and the rivers empty the nutrients into the sea.  We’ll address the problems this is causing in my next blog.

Did you know:  The ocean is salty because over millions of years rains and rivers have washed over the rocks, which contain sodium chloride (salt), and carried it to the sea.

It is easy to identify water that’s rich in phytoplankton and nutrients because the water is green due to the chlorophyll pigment plankton contain.  The further away from the nutrient source you get, the bluer the water becomes because of the decrease in the phytoplankton population.

This tool is called a Forel/Ule scale. It is used to obtain an approximate measurement of surface water color. This helps researchers determine the abundance of life in the water.

Let’s go up a step in the marine food web and talk about zooplankton.  Zoo is Greek for animal.  Most zooplankton are grazers that depend on phytoplankton as a food source.  I’ve learned that larval marine life such as fish, invertebrates and crustaceans are classified as zooplankton until they start to get their adult coloration.  After hatching from their eggs marine larva are clear and “jelly like” which is an adaptation that helps them avoid being eaten by predators.  Camouflage is their only line of defense in this stage of development.

A zooplankton sample we collected aboard the Oregon II using a neuston net. Notice the small juvenile fish and all of the clear "jelly like" larva.

When plankton samples are collected two different methods are used.  One method uses a neuston net which skims the surface of the water for 10 minutes.  See the video below to watch a sample being collected.

I am securing the neuston net to the metal frame by lacing it with a line (rope for all of you land lovers)..

The second method is using the bongo nets which are deployed at a 45 degree angle until they are a meter shy of the ocean floor, then they are brought back up.  This method collects samples from the vertical water column rather than just the surface.  The samples we collect with the bongo net look much different from the samples we collect with the neuston net.  Bongo samples are filled with more larva and less juveniles.

Bongo nets getting ready to be lowered into the water column. They are called bongo nets because they resemble bongos. Photo: SEFSC

Plankton surveys are done in an effort to learn more about the abundance and location of the early life stages of fish and invertebrates.  All of the samples we collect are preserved at sea and are then sent to the Sea Fisheries Institute in Poland.  This is where all of the identification of fish larva and other zooplankton takes place.  This information is then used by researchers to study things such as environmental quality requirements for larva, mortality rates, population trends, development rates and larval diets.

On the right is the "cod end", or plankton collection chamber, which attaches to the end of the nets. We then sieve the contents of the cod end and funnel it into a jar along with some preservative.

Personal Log:

My last log mentioned bycatch as one of the bad things about bottom trawling.  Another problem associated with bottom trawling is the destruction of habitats as the net and “doors” sweep along the ocean floor.  So far we have had two nets tear as a result of this collection method.  It’s a good thing they keep ten extra nets onboard as back ups!

Here are some of the extra nets that are kept on deck.

Aside from the nets tearing off there has also been a problem with the wire that deploys the net.  It has been twisting which prevents the “doors” from opening the net wide enough for a good sample collection.  The crew has tried extending all of the wire off of the reel in an effort to untwist it.  It seems to be working well, but we still need to keep a close eye on it.

I have also had the opportunity to be the hottest I have ever been in my entire life.  We had an abandon ship drill where everyone had to get into their immersion suits.  Picture yourself in the Gulf of Mexico, standing on a black deck, in the middle of the day, in July, while putting on a full body jump suit made of neoprene.  Hopefully we won’t have to use them at any point during the cruise.

Patti Conner, August 2, 2006

NOAA Teacher at Sea
Patti Connor
Onboard NOAA Ship Albatross IV
July 31 – August 11, 2006

Mission: Sea Scallop Survey
Geographical Area: Northwest Atlantic
Date: August 2, 2006

Data: (collected mid-morning) 
Air temperature = 17 C0 (62.6 F0 )
Water temperature = 15.5 C0 (60 F0)
Weather = sunny, windy
Depth of trawl = 45.4 meters (remember, a meter and a yard are pretty close)
Water salinity = 31.54 ppm
Wind speed = 13.52 knots

NOAA Teacher at Sea, Patti Connor, helps to sort sea scallops aboard NOAA ship ALBATROSS IV.

Science and Technology Log 

Today we are sailing northeast of our sailing position yesterday. We are going to circle Georges Bank counterclockwise. Our dredges today were interesting. We continue to bring scallops in, but my watch team tells me there are more plentiful spots to come.  At one site, we found so many sand dollars that I couldn’t believe my eyes.  This particular species of sand dollar produces a very brilliant green colored pigment which stains everything (starfish, algae, fish and me!).  I am learning to identify the many species of starfish that we bring in.  One of my jobs is to count them at various sites by randomly selecting from the dredge material.  At one site, I was counting hundreds of them.  It’s amazing how well they can hide and are camouflaged in the algae.  Many of the scallops have thick red layers of red algae on them (remember that red algae can grow at deeper depths because the red pigment can trap the minimal amount of sunlight needed for photosynthesis), and they also can be found carrying Porifera (sponges) on them which also helps them to be camouflaged.

Personal Log 

I do love it out here. My inner ear and brain has adjusted to the perpetual motion of the boat. I have not had a problem with seasickness yet.  It has helped that the weather has been nice. I am also doing well with the midnight to noon work schedule.  It is a little funny to see the fog roll across the deck of the boat in the darkness of the night.  Sunrise is my favorite time as the light changes how everything looks, especially the dredge samples, and it is nice to see the waves and the great expanse of the water.

Yesterdays invertebrate sample: Starfish (phylum = Echinodermata).

Today’s invertebrate sample: starfish!