Lisa Hjelm, August 3, 2008

NOAA Teacher at Sea
Lisa Hjelm
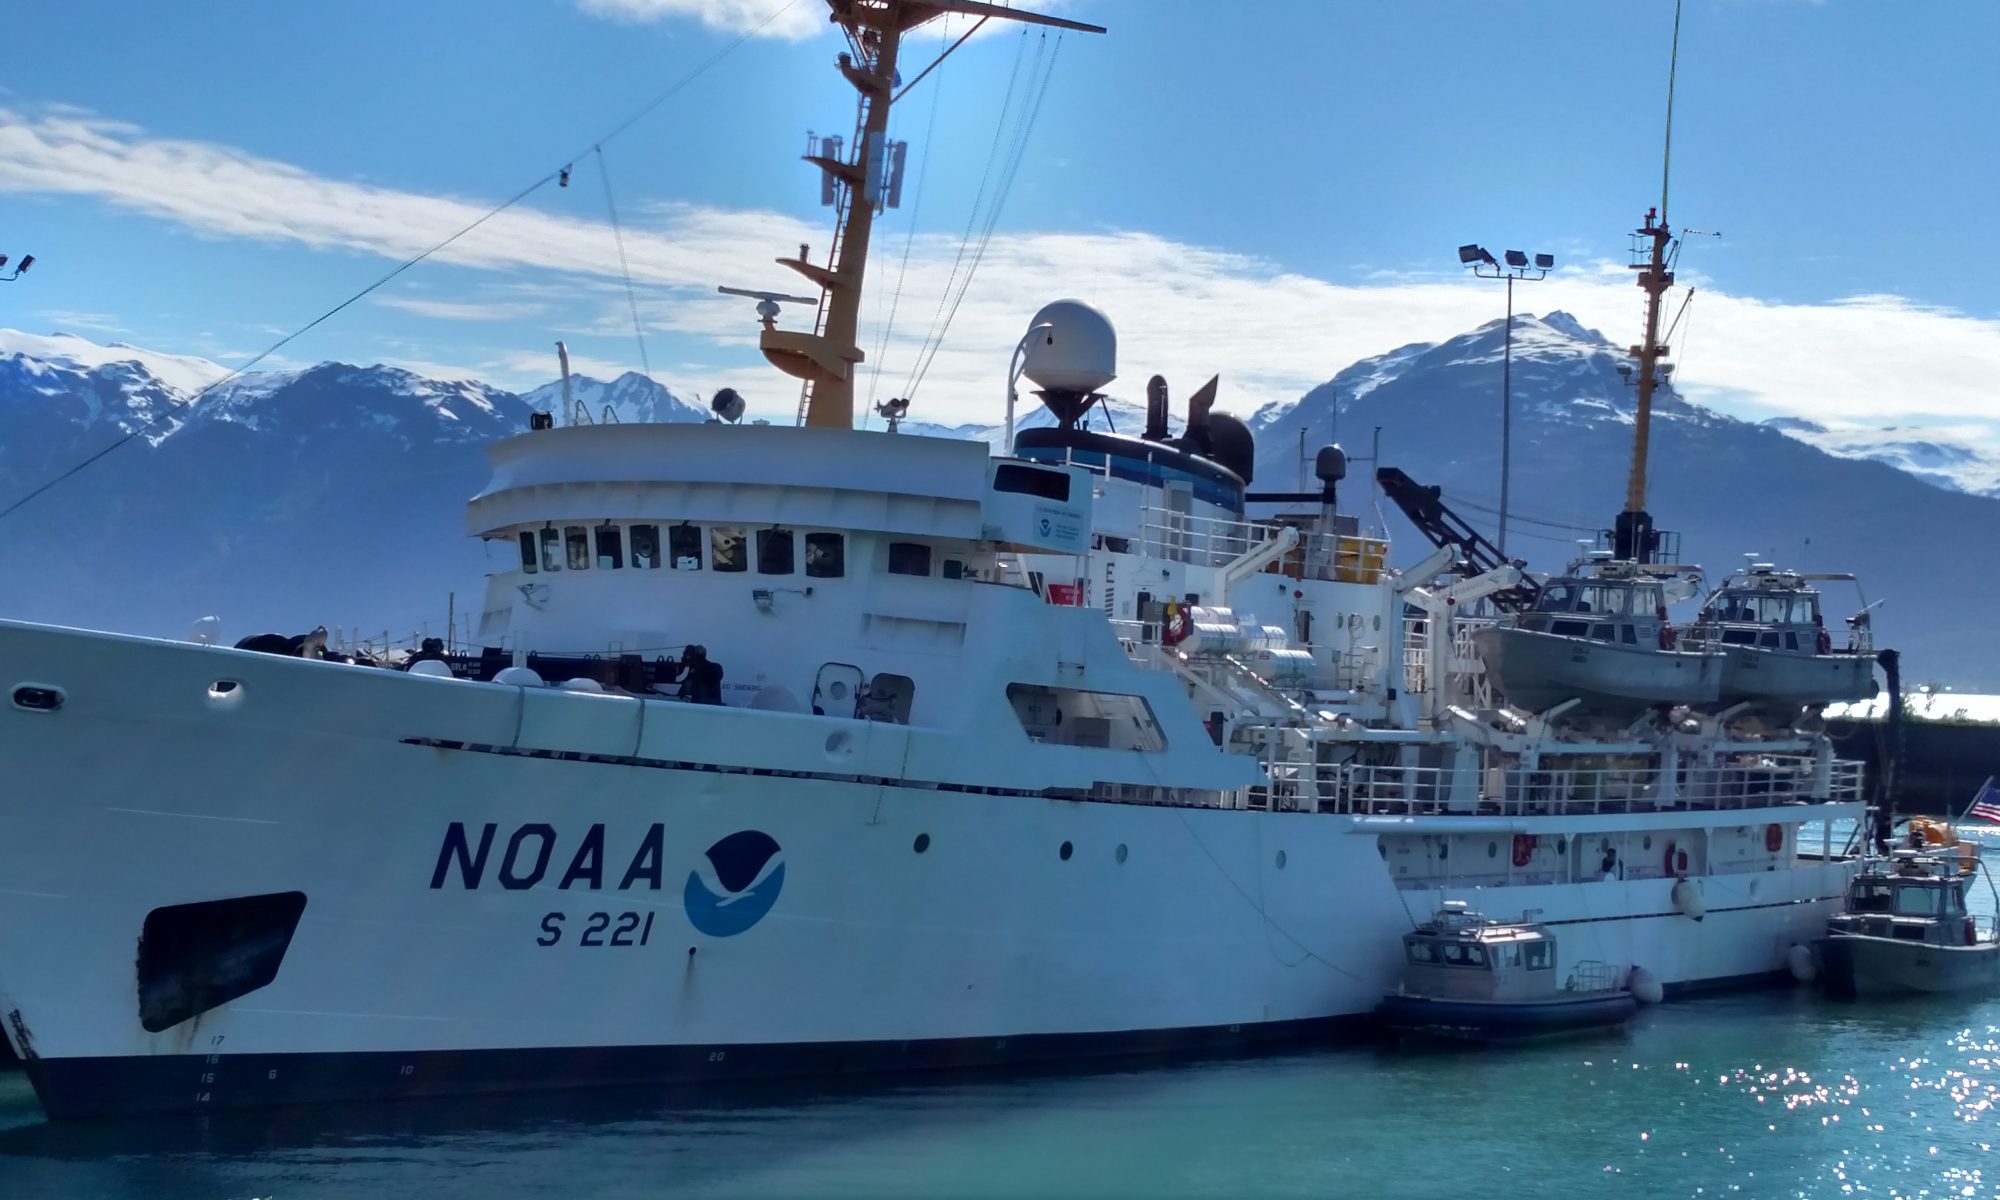
Onboard NOAA Ship Rainier
July 28 – 15, 2008

Mission: Hydrographic Survey
Geographical area of cruise: Pavlov Islands, Alaska
Date: August 3, 2008

Lowering a launch using a gravity davit system

Science and Technology Log 

This morning I awoke to my first cloudy sky. Although clouds line the horizon, the sky above is blue. The fine weather is holding steady. At 0815 three launches were deployed to continue surveying the deep water, central part of the channel. I watched them head out into open water, but today I am in the survey room observing the Survey Technicians (ST) as they process the multibeam sonar data. At the same time, the ship is underway to a new anchorage on the other side of the end of the world, or more properly, the other side of Inner Iliasik Island. After a full week I have a new perspective on this island and volcano world. I’ve learned the names of our islands, Inner Iliasik and Iliasik. From the launch I am able to orient myself by looking out at the islands, not just by looking at the map. I continue to learn more about navigation charts. Whenever I stop by the Bridge someone points out something new. Today I learned that this area was previously mapped during surveys from 1900 – 1939 and 1940 – 1969. That means that much of it was surveyed with single beam sonar just after World War II. It took twenty summer seasons to cover this area using single beam sonar.

The launch heads out to sea

Using modern, multi-beam sonar, NOAA Ship Rainier is the first ship to chart this area, and the survey should be completed by 2009, or less than two years from start of survey to final chart. As the ship transits to its new anchorage we are collecting bottom samples at specified locations along the way. To collect a sample, the ship stops and is maneuvered into position, so the sampler can be safely lowered. A metal container descends on a cable to the seafloor. When it hits bottom a spring loaded scoop closes and collects a bottom sample. The container is winched back to the surface, and the water drained out. Then, we open it up to see what’s inside. Today our samples have been turning up broken shells, sand and shells, pebbles and shells and sticky green mud. After the samples are logged they go right back into the sea. I collected some sand samples to dry out and examine under microscopes with students.

Bottom sampling from the ship

Bottom samples are used to investigate and confirm comments on the existing navigation chart. Examples of chart comments would be sandy, shells (s, sh), black sand (bk s), shoals, rocky, and my personal favorite, smoking volcano. Sample locations are selected to provide representative coverage of the areas that have been mapped, and the data will be used to update the charts. Soon this sample data along with reflectivity data (measured as changes in backscatter of the sound pulse that reflect the hardness of the bottom surface) from the surveys will be used to map the type of seafloor along with the shape of the seafloor. This would be similar to generating a preliminary geologic map of the seafloor. Tomorrow I expect to be back on a launch with a better understanding what goes in to compiling a navigational chart.

Personal Log: Observations from the Fantail 

Kayakers heading out to explore

Dinner is at 1700 (5:00 pm) prompt. After dinner people pursue their own activities. Some fish from the fantail. If the weather is calm, the smaller launches are used by fishing parties, and sea kayakers venture out to the islands to explore and hike. As I enjoyed the bright, warm sunlight on the fantail deck, I watched the progress of the hikers, tiny dots progressing steadily up the slope of Inner Iliasik Island. I gazed past the islands at the distant, hazy volcanoes, and spotted an ashy plume! With binoculars it was possible to see that smoke was rising from a small crater atop a conical volcano. Several of us rushed to the bridge to identify the volcano by locating it on the nautical chart. Our best guess, Dutton, which was not listed as presently erupting on the Alaskan Volcano website, http://www.avo.alaska.edu . Volcano watching is an exciting after dinner activity.

The catch of the day

Barney Peterson, August 18, 2006

NOAA Teacher at Sea
Barney Peterson
Onboard NOAA Ship Rainier
August 12 – September 1, 2006

Mission: Hydrographic Survey
Geographical Area: Shumagin Islands, Alaska
Date: August 18, 2006

wet and dry bulb thermometer
Wet and dry bulb thermometer

Weather Data from Bridge 
Visibility: 10 nm
Wind direction:  220˚
Wind speed:  light 0 – 2 knots
Sea wave height: 0 – 1’
Seawater temperature: 9.4 ˚C
Sea level pressure:  1017 mb
Cloud cover: cloudy (8/8)

Science and Technology Log 

Wednesday I spent time on the bridge, observing what happens when the ship is traveling at sea. My classes at James Monroe Elementary have participated in the GLOBE program, acquiring and sending weather data daily to be used to form a picture of conditions around the world.  It was particularly interesting to me to learn that the crew of NOAA ships take much the same readings hourly and report them every 4 – 6 hours to the National Weather Service to help develop the predictions that help us all guide our day to day lives.  I was especially impressed that the readings I saw were made using traditional instruments, not an automated electronic weather device.

One of the people in the pilot house logs weather every hour on the hour. There is an outside station on the starboard wall of the pilot house.  This gives a temperature reading and allows them to calculate relative humidity.  That is the difference between how much moisture is in the air, and how much total moisture the air is capable of holding.  It may be expressed as a percentage, or decimal number. For hourly reporting, the relative humidity is not recorded and it is calculated automatically by when the “Big Weather” is submitted to National Weather Service.  Both temperature of the air and sea water are read in ˚Fahrenheit and converted to ˚Celsius for reporting.

An anemometer  measures wind speed.
An anemometer measures wind speed.

Wind speed is read from an anemometer mounted on the ship’s mast.  This reading is a bit trickier if we are under way. When the ship is moving, the ship’s speed is subtracted from the anemometer reading to give a corrected wind speed.  (Otherwise, the reading is like what you would get running while holding a pinwheel in front of you…much faster air movement than what is actually happening.) There is a wind vane mounted on the front of the ship and also an electronic gauge for reading wind direction.

The barometer (at left) is used for reading air pressure. It is located on the back wall of the pilot house and always gets a gentle tap before a reading is taken. This measurement is important because trends up or down in air pressure give clues to developing weather systems.  The pressure is recorded in milibars.  The ship’s barometer is shown at left. Some measurements involve using experience and personal judgment as well as instruments.  These are the ones for wave height, swell height, cloud cover amount, cloud height, and visibility. The accuracy of these readings depends upon the experience and care of the person making them.  The sea wave and swell can be estimated by careful observation, which seems to become second nature to the crew because they are exposed to them all the time.  They are recorded in feet.  The direction of the swell is always shown as the direction in which the swell is going. It can be measured using a device mounted on the deck outside the pilot house.

A barometer reads air pressure.

Cloud cover is measured in eighths.  The observer divides the sky, calculates by observation how many eighths of the sky are covered by clouds, and reports that fraction. Likewise, a person must be a careful observer to note the kind of clouds they are seeing and where they mostly appear in the sky. There is a cloud chart available that shows pictures of cloud types and tells the altitudes at which they are commonly formed.  This is a great help. (The cloud chart is shown at the right.) When there are low clouds, and there is land nearby, the observer can check the elevation of a point of land and judge the elevation of the lowest clouds as they appear against that point. Another measurement that may sometimes have to be an experienced estimate is visibility.  Again, if land is visible, the observer tells how far away she/he can clearly see according to landmarks and the distances on charts or the ship’s radar screens.  It is a lot harder to make this judgment when the ship is at sea, with no landmarks to help.  That is when experience is especially important.  One aid in this case is that the known distance to the horizon, due to the curvature of the earth, is eight nautical miles.  That means that if the observer can see clear to the horizon, visibility is at least 8nm.

This day I watched Able Bodied Seaman (AB) Jodi Edmond take weather readings and report “Big Weather” to the National Weather Service using the internet.

A cloud chart on the NOAA’s National Weather Service Web site.
A cloud chart on the NOAA’s National Weather Service Web site.

Personal Log 

I am running about a day behind writing and submitting my logs.  There is so much to do and see that I forget to spend enough time writing.  I am using the personal journals that my students gave me at the end of the school year to record my impressions and thoughts every evening.  Those act as memory-joggers when I sit down at the computer to do my formal writing.

Everyone aboard the RAINIER is very friendly and helpful.  I am still making a few wrongs turns or selecting the wrong stairs to get to where I need to go. The officers and crew are great about pointing me in the right direction and giving me clues to help me remember how to find where I need to be when.

Every afternoon the orders for the next day are posted in several spots throughout the ship.  These list the survey boats that will be going out, and their crews and assignments.  The list also tells about responsibilities on board ship…both for the officers and the crew.  These are called the Plan of the Day (POD) and are important for everyone to read when they are posted.

Question of the Day 

How is wind direction normally reported: do we tell the direction from which the wind comes, or the direction toward which it is blowing?

Barney Peterson, August 16, 2006

NOAA Teacher at Sea
Barney Peterson
Onboard NOAA Ship Rainier
August 12 – September 1, 2006

Mission: Hydrographic Survey
Geographical Area: Shumagin Islands, Alaska
Date: August 16, 2006

Weather Data from Bridge 
Visibility: 12 nautical miles (nm)
Wind direction: 234˚
Wind speed: 0 – 3 knots
Sea wave height: 1’
Seawater temperature: 11.7˚C
Sea level pressure: 1011.8 mb
Cloud cover: 8/8 Height: 2000 -3000’ Type: Stratus

My first view of the NOAA ship RAINIER at the dock in Seward, AK.

Science and Technology Log 

Yesterday I spent time in the Plot Room learning about the technology used to survey the surface of the earth underneath the ocean (bathymetry).  For each survey the computers must  have accurate, real-time information about the behavior of the ship on the sea surface (pitch, roll, speed) because all of this can affect the accuracy of sonar readings.  The sonar (sound waves) is beamed from the bottom of the survey vessel and spreads out in a cone shape to the undersea surface. Bottom features that stick up closer to the sea surface reflect sonar waves and return echoes sooner so they show up as more shallow spots.  Echoes from deeper places take longer to return, showing that the bottom is farther away at those places.

The data from each day’s survey is downloaded into computers in the Plot Room.  Survey technicians review the data line by line to be sure it all fits together and to “clean up” any information that is questionable.  They use information about the temperature and conductivity of the water where the survey was taken to understand how fast the sonar waves should be expected to travel. (This information is critical for accuracy and is collected every 4 to 6 hours by a device called the CTD.  The CTD is lowered from the ship and takes readings at specified depths on its way down through the water.)

Ensign Megan McGovern and crew partner in full firefighting bunker gear for our first Fire/Emergency Drill.

When survey work is in deep water, it is done from the ship using equipment that can cover a wider area in less detail.  The launches are used for shallow water work where it is more important to navigation to have finer detail information on water depths and underwater features of the earth surface. Bonnie Johnston, a survey technician, spent about an hour explaining how the system works and showing me how they clean up data before it is sent off for the next stage of review, on its way to becoming part of a navigational chart.  Computers used have two screens so survey technicians can see a whole survey line of data and look closely at information on tiny spots at the same time without losing their place on the big screen.  This helps to judge whether changes of depth are accurate according to trends on the sea bottom, or spikes that show an error in the echoes received by the sonar. The software also allows them to see data as 2-D, 3-D, color models, and to layer information to give more complete pictures.

Tomorrow we are scheduled to begin our actual survey work in the Shumagin Islands.  In between making new surveys the technicians are kept very busy working with the data they have on hand. There are many steps to go through to insure accuracy before data is ready to use for charts.

This is the 4.5 foot dogfish shark caught by a crewmember.  This shark has no teeth even though it looked ferocious.  released it after taking pictures.
This is the 4.5 foot dogfish shark caught by a crewmember. This shark has no teeth even though it looked ferocious. released it after taking pictures.

Personal Log 

My first two days aboard the RAINIER have been a swirl of new faces and places.  The only name I knew for sure before I arrived was Lt. Ben Evans who had exchanged email with me about the gear I would need. I was met at the Seward RR station by and welcomed onto the ship by Ensign Megan McGovern.  She gave me a quick tour of the ship, including where to put my gear. I felt like a mouse in a maze: up and down steps, around blind corners, and through doorways. It has been much easier so far to find my way than I thought it would be.  Reading books that use nautical terms has helped give me a background to understand port, starboard, fore, aft, head, galley, bridge, fantail, and flying bridge. Now I just need to remember where they all are.

Monday was taken up with a safety briefing, checking out equipment such as my flotation coat, personal flotation device (life jacket) for use in survey boats, hard hat, and immersion suit.  I spent several hours reading Standing Orders that all persons aboard must read before being allowed to stay. I talked with the medical officer, and discovered where to eat and the times meals are served. Tuesday we had a Fire/Emergency Drill at about 1030 (10:30 am) for which I reported as fast as I could to my assigned station on the fantail.  We were checked off on a list and some crew members practiced with fire fighting equipment.

Just as we finished that drill, the Executive Officer called an Abandon Ship Drill.  Everyone rushed to quarters to get immersion suits, hats and any assigned emergency gear before reporting to muster stations.  Again we were checked off and all accounted for before anyone could return to what they were doing before. These drills are an important part of shipboard life. They are required once a week and always within 24 hours of the ship sailing from port.

I am sleeping and eating well.  The food is like camp and so are the bunk beds.  So far I have seen lots of salmon: the stream in Seward was full of migrating Coho (silvers); the sea at Twin Bays was alive with jumping Pinks. Monday night one crew member, fishing from the fantail while we were anchored, caught and released a 4.5’ dogfish (shark).  The next day someone caught an 8 lb. silver.  There are sea lions, otters, gulls, eagles, puffins and dolphins to watch. I hate to close my eyes to sleep because I know I will miss seeing something wonderful.

Question of the Day 

What is the speed of sound through air?  Does sound travel faster or slower through water?

Linda Armwood, May 3, 2006

NOAA Teacher at Sea
Linda Armwood
Onboard NOAA Ship Fairweather
April 25 – May 5, 2006

Mission: Hydrographic Survey
Geographical Area: Aleutian Islands, Alaska
Date: May 3, 2006

Weather Data from Bridge 
Visibility:  8 nautical miles (nm)
Wind direction:  120°
Wind speed: 10 kt
Sea wave height: >1 ft.
Sea water temp: 10.7
Sea level pressure:  1022.5 mb
Present weather: Overcast
Temperature:  °C~ 9.5 dry/8.5wet

Linda Armwood dons her survival suit aboard the Fairweather

Science and Technology Log 

The weather data is collected daily by the NOAA Ship FAIRWEATHER. These observations can be used by ship personnel to help interpret the forecast and any changes in weather that may have occurred along the route.  This recorded data is sent monthly to the NOAA Seattle, WA station for archival purposes.  The observations of data that is collected on the NOAA Ship FAIRWEATHER at 4:00 a.m., 10:00 a.m., 4:00 p.m. and 10:00 p.m. are sent to NOAA’s National Weather Service (NWS).  The NWS employs meteorologists who can use these observations from the sea to evaluate local weather conditions, to locate and determine the strength of weather systems, and prepare surface weather charts. In addition, meteorologists are able to use these observations to forecast over land areas to include long-range forecasts of climate, temperature, and precipitation; to monitor climatic change and ocean currents; and to conduct studies of the constant interaction of air and sea.

Personal Log 

The Alaska shape files, charts and sail plans will be an extra bonus for students to share in my journey!

Question of the Day 

Geospatial Semester and Environmental Science Students 

Make an inference of which continent is affected by the North Pacific Ocean weather systems.

A Profile of Able Seaman (in training) Emily Evans 

Able Seaman Evans is a native of Rochester, NY and is the sole female crew member in the Deck Department of the NOAA Ship FAIRWEATHER.  As an Able Seaman in training, she is committed to completing assigned duties and tasks, including manning the helm of the NOAA Ship FAIRWEATHER.  She graduated from Wellesley College, MA with a Bachelor of Science degree in Physics in 2000.

Her initial interest in working on the NOAA Ship FAIRWEATHER stems from her desire to advance in her career of marine science.  She has a 100-ton license with five years of sailboat driving.

She is fiercely independent in working towards setting her goals.  A short-term goal for Emily is to get more sea time so that she can get license advancement.  An additional short-term goal for her is to become NOAA system qualified.

Mrs. Armwood

Linda Armwood, April 26, 2006

NOAA Teacher at Sea
Linda Armwood
Onboard NOAA Ship Fairweather
April 25 – May 5, 2006

Mission: Hydrographic Survey
Geographical Area: Aleutian Islands, Alaska
Date: April 26, 2006

Weather Data from Bridge 
Visibility:  5 nautical miles (nm)
Wind direction: 130 °
Wind speed:  12 kt
Sea level pressure: 1004.5 mb
Present weather: Drizzle, mostly cloudy
Temperature:  °C~ 7.5dry/6.5wet

Science and Technology Log 

During the morning I concentrated on the Electronics Department to see how this operation is run. This department covers a significantly large portion of the ship in several locations. The Chief Electronics Tech explained the functioning of the iridium and INMARSAT satellites. The iridium satellite is used for low speed communication such as the telephone and e-mail.  This is primarily used at sea for hourly email transit except when launches are out.  The iridium also has a tie-in for sensors such as wind speed and barometric pressure.  The INMARSAT satellite is for high speed communication such as voice, faxes and two-way data transfer.  The management of these satellites, the Automated Information System (AIS) and all other electronic/electrical systems for the ship are managed, coordinated and maintained by the Electronics Department.

The afternoon was spent on one of the launches to observe survey technician launch operations. During the training there was a demonstration of the use of several components of data acquisition and processing.  Some of the data that is collected is sonar, boat voltage, vertical waterfall, bathymetric in 2-D view, position and orientation, heave, distance and altitude. All of this data is then processed and becomes the responsibility of the survey technician to combine the data into a single file, known as a concantenated file.

Personal Log 

I appreciate the ability to view the hydrographic navigation charts in my room through INMARSAT. This allows me to know where we are while preparing for the day.  Thanks to the Chief Electronics Tech for giving me the ship tracker web site for students and other interested persons.

Mrs. Armwood