NOAA Teacher at Sea
Avery Marvin
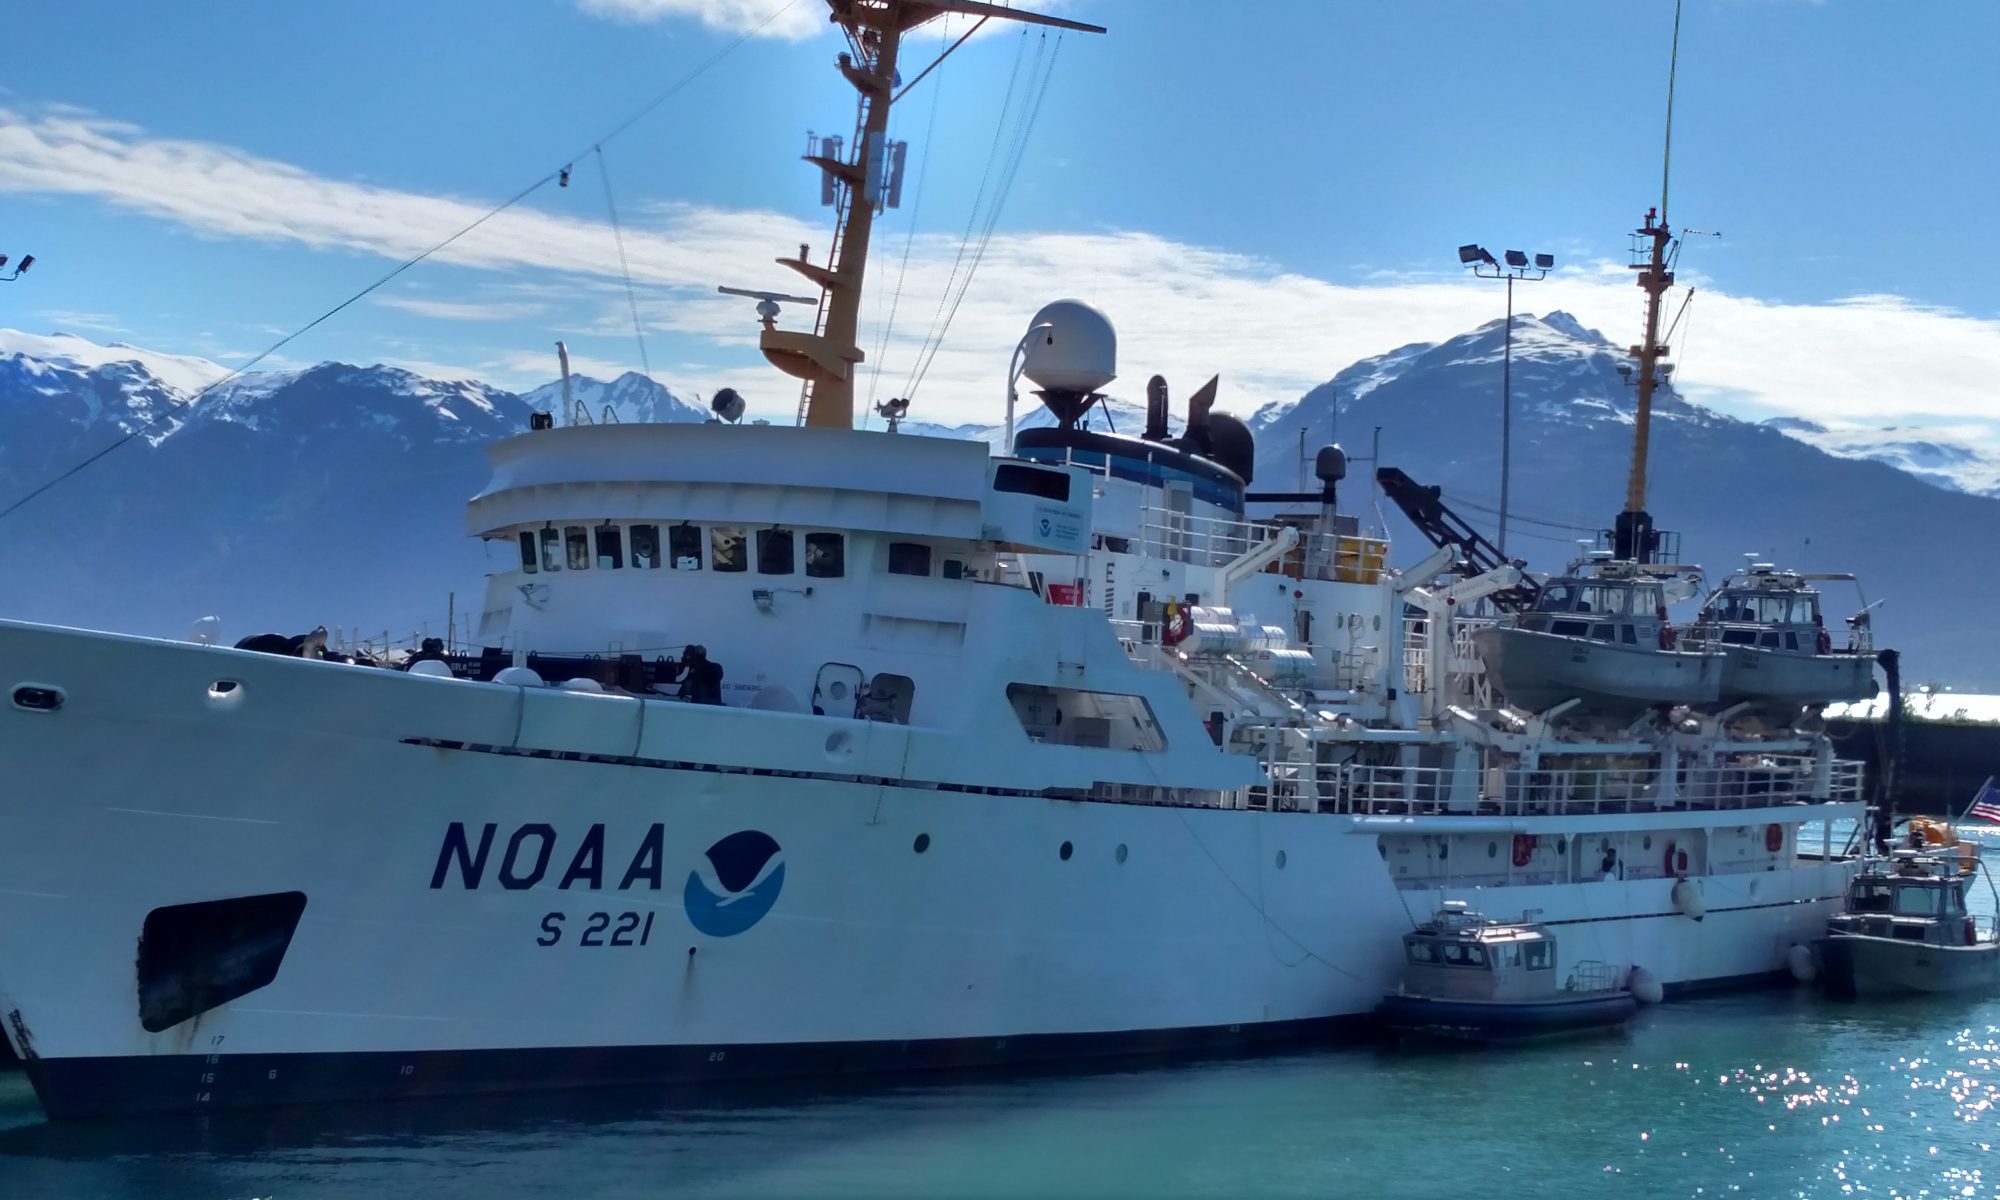
Aboard NOAA Ship Rainier (NOAA Ship Tracker)
July 8 — 25, 2013
Mission: Hydrographic Survey
Geographical Area of Cruise: Shumagin Islands, Alaska
Date: July 16, 2013
Current Location: 54° 55.8’ N, 160° 09.5’ W
Weather on board: Overcast skies with a visibility of .5 nautical miles, South wind at 18 knots, Air temperature: 10°C, Sea temperature: 7.2°C, 1-2 foot swell
Science and Technology log: Shoreline Verification
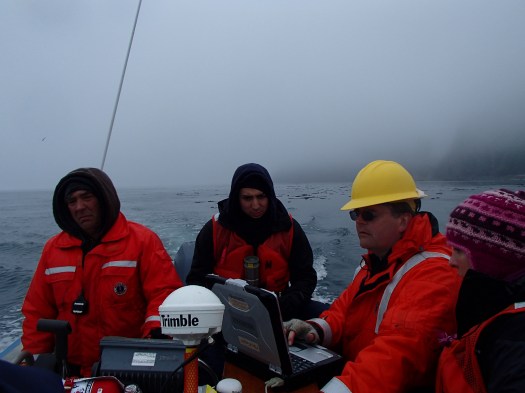
When you think of a shoreline, you might think of a straight or curved “edge” made of sandy beaches that gradually retreat into deeper and deeper water. In the Shumagin Islands, a sandy cove is a rare occurrence and a place for a beach party! Towering, jagged cliffs patched with Artic moss and blanketed by a creeping fog are the typical “edges” here. Below the cliffs in the water, lie sporadic toothed rocks and beds of dense rooted bull kelp, swaying with the current. As I sit on the edge of the skiff (small dingy-like boat), which gently trudges along the outside of the protruding rocks, I think to myself “Is this what Ireland is like?” or is this a world unto its own-untouched and solitary? Whatever it is, this place evokes an ethereal mood and you really feel like you are in one of the most remote places in the world.


Remote it is and that is why we are here. These are for the most part, uncharted or poorly documented waters and shorelines and in this post, I am going to talk about the shoreline aspect. Besides taking bathymetric data (depth data), hydrographic ships like the Rainier must also verify that the shorelines of various land-masses are portrayed accurately and that all necessary “features” are documented correctly on nautical charts. Features include anything that might be a navigational hazard such as rocks, shoals, ledges, shipwrecks, islets (small islands) and kelp beds. For shoreline verification, a 19 foot skiff is used for maneuverability and shallow water access. This boat will go out during the “shoreline window”, when the tide is the lowest, with the hopes that if there is a dangerous feature present, it will be visible above the water. In the best case scenario, we can investigate the shoreline fully with the skiff before sending in the bigger launches to survey the area with the sonar, so that we know they won’t hit anything.

Shoreline verification crew. From left: Randy (Coxswain), John (NOAA Corps. Officer), Chief Jacobson (Chief Survey Tech), Avery (Teacher at Sea)

The main goal of the scientists aboard the skiff is to establish a “navigational area limit line” (NALL). This is a boundary line delineating how far off shore the launch boats should remain when they are surveying. This boundary line is obtained in one of three ways:
1) presence of a navigational hazard such as a dense kelp bed or several protruding rocks
2) a depth of 4 meters
3) distance of 64 meters to shore
Whichever of these is reached first by the skiff will be the navigational area limit line for the launches. Here in the Shumagins, kelp beds and rocks have been the boundary line determinant and often these hazards are in water that is deeper than 4 meters because we have been encountering these before we get within 64 meters of the shoreline.
While scientists are determining the NALL, they are also verifying if certain features portrayed on older charts are in fact present and in the correct location. Using navigational software on a waterproof Panasonic Toughbook, they bring up a digitized version of the old chart of a specific survey area. This chart depicts features using various symbols (asterisk=rock above water, small circle=islet). This software also overlays the boat’s movement on top of the old chart, allowing the boat to navigate directly to or above the feature in question.


If the feature is not visually seen by the human eye or the single beam sonar on the skiff, it will be “disproved” and a picture and depth measurement will be taken of the “blank” location. If the feature IS seen, more data will be recorded (height of feature above the water, time of day observed, picture) to document its existence. This same verification procedure is used for newfound features that are not present on the old charts. All of this data is written on a paper copy of the chart and then back in the “dry lab”(computer lab), these hand-written notes are transferred to a digital copy of the chart.


Note: Kelp buffers are the large shaded red areas and the smaller red circle is the actual position of the islet. The three southernmost rocks (marked by red asterisks) inside the black box were disproved.
On the two shoreline verification adventures I went on, many rocks and islets were disproved and several new features were found. Most of the new features were rocks, islets or large kelp beds. It is important to note that if scientists find a new feature which is a serious present navigational hazard (ex. Shipwreck, huge jutting rock or shoal far offshore) it will be marked a DTON (Danger to Navigation) and communicated to mariners within a short time frame. Other less significant features take 1-2 years to appear on updated nautical charts.
For some survey areas, the Rainier uses aircraft-acquired LiDAR (Light Detection And Ranging) to get an initial idea of various features and water depths of a shoreline area. (This is a service that is contracted out by NOAA.) LiDAR data is obtained by a plane flying over an area at 120 mph, emitting laser beams to the water below. Like SONAR, LiDAR measures the time it takes for the laser beam to return to its starting point. Using this measured time and the speed of light, the distance the light traveled can be obtained, using the equation distance = speed*time, accounting for the fact that it travels through air and then water. Because light travels much faster than sound, the plane can travel significantly faster than a boat and a large area can be surveyed faster. Unfortunately LiDAR can only be used in clear, calm water because light is easily reflected by various solids (silt in the water, floating wood), specific color wavelengths (ex. White foam on ocean surface) and absorbed by biological specimens for photosynthesis (ex. Surface bull kelp). LiDAR surveys do reduce the time hydrographers spend at a shoreline site thus increasing the safety and efficiency of an operation. As with any data acquisition method, it must be cross-checked by another method and in this case because of the obvious downsides, it is used as a guide to shoreline verification.

After spending several days “disproving” a lot of rocks and islets that were clearly not present in their identified location, we started to wonder why someone would have thought there was a specific feature there. One possibility is that it was just an ink blot on the original chart, made by accident (from a fountain pen), and then interpreted as a rock or islet in the process of digitizing the chart. It’s better to be safe than shipwrecked! Another possibility is that these features were “eyeballed” in their documented location, and thus were present but just in the wrong spot. Lastly because of limitations previously mentioned, LiDAR occasionally mis-reports features that are not present. Fortunately, our current survey methods use sophisticated navigational technology and several cross-checks to minimize data errors.
After shoreline verification has been completed, launches can survey the ocean floor (using SONAR) outside the boundary (NALL) that was established by the skiff. Each launch will be in charge of surveying specific polygons (labeled by letters and names). The picture above shows the polygon areas which are outlined in light orange (most are rectangles). I will talk more about SONAR and surveying on the launch in my next post. 🙂
Personal log:
I have been on the skiff two times now helping with the shoreline verification process. After the second time around and a chat with the XO Mike Gonsalves, my understanding of this process is more fine-tuned. It feels good to reach this point and it reminds me of the need to be patient, diligent and okay with the unknown when learning something new. I, like my students, often seek answers and a deep understanding of complex topics immediately and if this doesn’t happen I can get frustrated with myself. I have been more self-forgiving aboard the Rainier because I know I will be exposed to the same topic or process once again either in a different format or with a different set of crew members. I am also surrounded by a group of tolerant people who continually answer my questions with grace and peak my interest with new ideas. This repetition of content and supportive network is crucial for any learning environment, whether it be on a ship or in a classroom. Additionally, I have been given several small but important tasks which make me feel like a part of this group and complex operation. This empowerment inspires me to learn more and continue contributing. Building a successful classroom community is no different than what is going on here on the Rainier. All students need to have a stake in their learning and a purpose for coming to class each day.
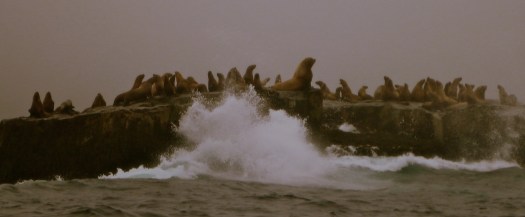
One of my small tasks aboard the skiff during the shoreline verification was to take pictures of the various features (rocks, islets etc.) that needed to be examined. In some cases, it was important to photograph specific biological features that had an effect on navigation. For example, when rounding the SE side of Chernabura Island we came across a large Stellar Sea Lion rookery inhabiting a small rocky islet. The male proudly stood in the center, surrounded by about 50 females. As seen in the picture, this was a hefty male who easily weighed upwards of 1200 pounds. (Males can get as big as 2,500 pounds.) During the breeding season (June-August), the male will fast and often won’t leave his reproductive rookery site. His primary focus is to defend his territory and spread his genes! Even though male Stellar Sea Lions are polygamous, they do not force the females into a harem but rather control the boundaries around their physical territory where within, the females reside. The most successful rookery territories, not surprisingly are small rocky islands which can remain stable and productive for up to two months.

After researching about the Stellar Sea Lion, I learned that the western stock which resides in the Aleutian Islands is listed as an endangered species (since the 1970’s populations have declined by 70-80%). The cause for this is complex and has been attributed to a range of factors including: overfishing of sea lion prey (ex. Herring, Pollock), predation by Orca whales, shooting by fisherman, and disease. Interestingly, a few native Alaskan communities are still permitted to hunt Stellar Sea Lions for subsistence (survival) purposes.

Fun factoid: The Stellar Sea Lion was named after the naturalist, George Wilhelm Stellar who first discovered the species in 1741 while part of Bering’s tragic voyage across the uncharted North Pacific.

