Rita Larson, August 13, 2009

NOAA Teacher at Sea
Rita Larson
Onboard NOAA Ship Rainier
August 10 – 27, 2009 

Mission: Hydrographic Survey
Geographical Area of the Cruise: Kasitsna Bay, AK
Date: August 13, 2009

RA-4 launch, one of the Rainier’s small boats

Weather Data from the Bridge 
Latitude: 59° 28.515′N Longitude: 151° 33.549′W
Sea Water Temperature: 9.4°C
Air Temperature: Dry Bulb : 14.4°C (46°F); Wet Bulb: 12.2°C (54°F) (Dew Point)
Visibility: 10 miles

Science and Technology Log 

The Rainer deploys launches or small boats such as the RA-4 that have different tasks assigned to them listed on the POD or the Plan of the Day. Today, our mission was to survey a section of the sea floor in Kachemak Bay. Once the survey has been completed, the raw data is processed and then is sent to other NOAA’s National Ocean Service divisions to create nautical charts of the sea floor for either updating for accuracy or created for the first time.

Each launch is equipped with multi-beam sonar devices. The crew is currently collecting bathymetric as well as backscatter data simultaneously. Backscatter data can be analyzed to categorize the bottom type of the sea floor indicating changing sediment types such as rock or mud. This information is of particular use to fisheries biologists, ecologists, and others who are interested in habitat mapping. The lead hydrographers are given a polygon region, which defines the area in which they are going to survey.  This is what ours looked like for today:

This was our chart at the beginning of the day.
This is our chart after a hard days work!

Can you see what we surveyed? Yes, you are correct if you said the purple and green-blue mixture. The first step that was taken was putting a cast in the water, which is called a CTD and stands for Conductivity, Temperature, and Depth. The CTD is used to see the changes in sound velocity all the way to the bottom.  This process is repeated at least every four hours for readings. This sound velocity data is used to correct the multi beam sonar data. The computer is able to translate the multi-beam sonar data in a 3-D image of the sea floor.

The CTD, which measures conductivity, temperature, and depth.

Personal Log 

I am getting used to my routine living on a ship. The main idea is respecting others and their space. Listening to others and following the rules. Asking lots of questions will help you transition easily. Following others advice. Enjoying the company you are with. Having fun on every adventure that is given to you. I am learning so much, and each day I am feeling more and more comfortable here in my new home on the Rainier. 

New Term/Phrase/Word 

Wow, I am a student here on the Rainier! I am learning new words and terms everyday. Just today I found out a FISH is not an animal, but an instrument that is towed behind a boat on a cable and “swims” through the water. One example is a Moving Vessel Profiler or a MVP. This apparatus collects the same information as the CTD; however, it collects the information in real time. It is smart to have the CTD and the MVP on the launch to compare the same data to make sure it is correct.

This is a screen that is read by the hydrographers that shows the 3-D sonar images of the bottom of the sea floor.  Today, some of our readings were more than 500ft deep. WOW!
This is a screen that is read by the hydrographers that shows the 3-D sonar images of the bottom of the sea floor. Today, some of our readings were more than 500ft deep. WOW!

When we survey a section of the sea floor that was previously surveyed that is called junctioning, or overlapping. Holidays are not the days on a calendar, but stands for “holes in the data”. That means after you survey a section of the sea floor, if there is a missed section on the computer screen you must go back and re-survey that area.
Kristin Joivell, June 22, 2009

NOAA Teacher at Sea
Kristin Joivell
Onboard NOAA Ship Fairweather
June 15 – July 1, 2009 

Mission: Hydrographic Survey
Geographical area of cruise: Shumagin Islands, Alaska
Date: June 21-22, 2009

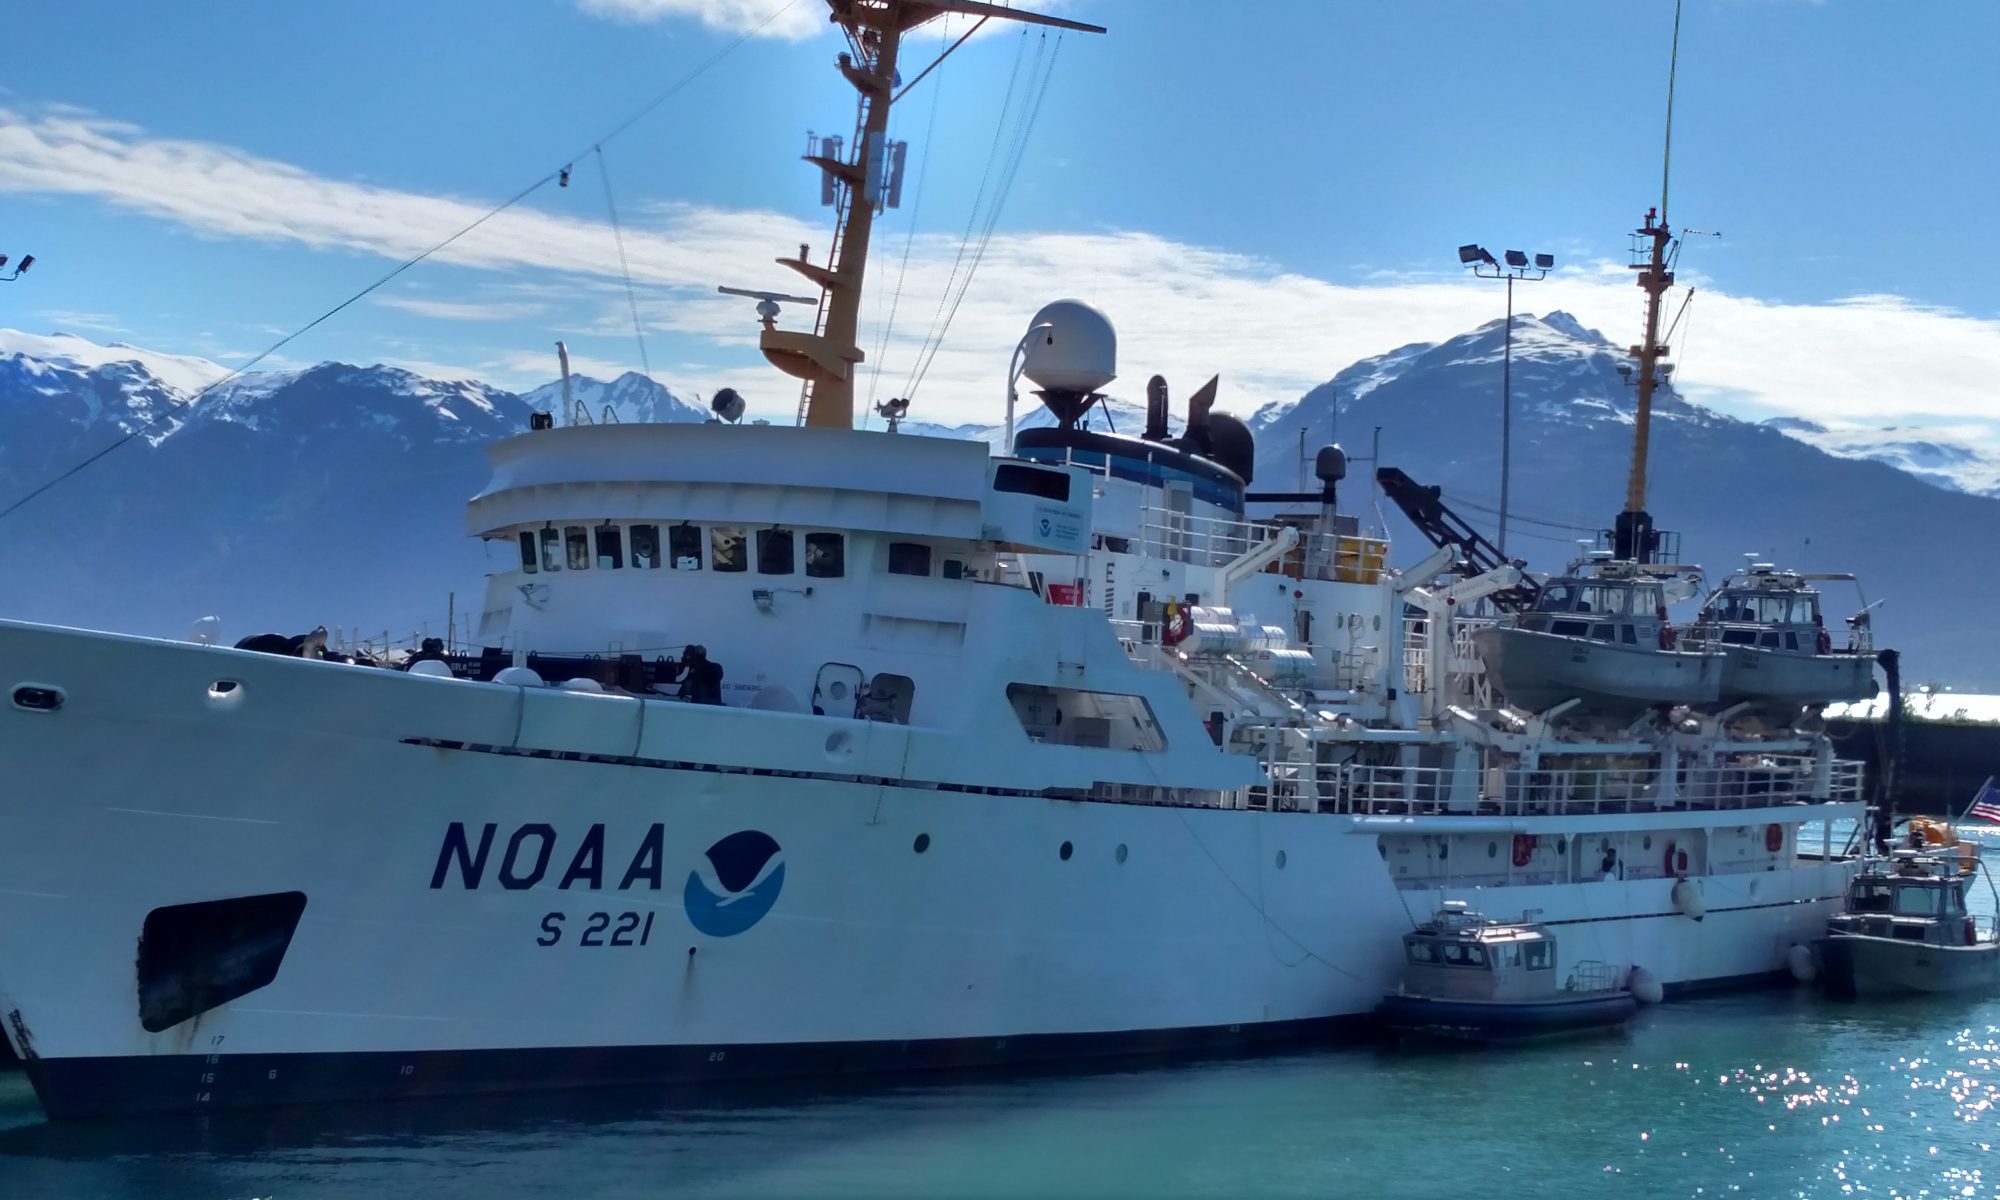
The Fairweatherrests at anchor in Northwest Harbor.

Weather Data from the Bridge   
Position: Northwest Harbor
Clouds: Mostly Clear
Visibility: 10+ miles
Wind: 13 knots
Waves: less than 1 foot
Temperature: 8.2 dry bulb
Temperature: 7.2 wet bulb
Barometer: 1007.0

Science and Technology Log 

Launches are excellent for collecting data near the shoreline, but the Fairweather is better at open water data collection. The polygons are larger, but the ship must still be traveling at approximately 6 knots for optimum results.  The ship also uses the multibeam to sweep the ocean floor, just like the launches.  Of course, multiple computer screens are again necessary to monitor data collection on the ship. Also similar to the launches and their CTD’s, the ship uses a device called a Moving Vessel Profile (MVP) that collects information about sound velocity as it is dropped through the water. It is commonly called the “fish” since it is dropped into the water and manipulated to “swim” at different depths for data collection.

Here I am dislplaying the MVP or “fish” that will be deployed periodically throughout data collection to measure sound velocity, temperature, and pressure of the water.

A definite advantage of the MVP is that the fish can be deployed while the ship is moving; however, the launch must be stopped to use the CTD.  Additionally, the MVP measures sound velocity directly where as the CTD collects data that must be plugged into a formula to calculate the measurement for sound velocity. Data collected from both the launches and the ship must be processed and converted.  Much of the data processing involves moving data uploaded from launches into networked folders.  At times while I watched data processing, there were too many folders open on multiple computer screens for me to personally keep track of.  Also, I noticed certain data sets being converted from one form to another.  Sometimes, the data conversion takes a long time so computers must be marked so nobody interrupts the conversion process.  Patience, computer literacy, and organization skills are a must for working on data processing!

In this picture I’m attempting to clean “dirty” data.  The screen on the left shows a 3D image of the ocean floor.  The screen on the right shows a 2D image of the ocean floor that is color coded based on depth. As you can see, dirty dishes also tend to collect when cleaning dirty data!
In this picture I’m attempting to clean “dirty” data. The screen on the left shows a 3D image of the ocean floor. The screen on the right shows a 2D image of the ocean floor that is color coded based on depth. As you can see, dirty dishes also tend to collect when cleaning dirty data!

Another part of working with data collected from the launches and the ship involves cleaning “dirty” data.  Even through the best efforts to collect data, pings are sometimes lost or interference occurs. Perhaps the speed of the vessel exceeded 6 knots or maybe there was a section of the water with an unusual density. So, a software program called Caris is used to work with the data on a dual screen computer. The ocean floor that is color coded by depth can be viewed on one screen. Then, the person working with the data selects small segments of the ocean floor to view on the other screen.  The plane of the ocean floor and all of the pings are shown in a variety of color scales. Data that is very accurate at a high confidence level can be shown in violet, but the lower the confidence level gets, the further up the spectrum the colors are shown.  Many people choose to show different lines of pings in different colors to make it easier to see how many times the same section of the ocean floor was swept.

The person working on the computer can choose to delete certain pings, especially if they were located at the far end of the multibeam.  These pings are more likely to be lost or misrepresent the depth. Additionally, a measurement can be taken on the screen with a ruler tool to determine if a group of pings are within specification limits.  If they are not, a segment of data can be designated for further investigation.  The person working on this must make many decisions, so it is important to be able to infer information from data as you work.

Personal Log 

Paddling my kayak in the ocean through Northwest Harbor in the Shumagin Islands

I went sea kayaking a few years ago in Mexico, but sea kayaking in Alaska is by far more dangerous. Even though the kayaks are paddled the same way and I could keep the boat balanced relatively easily, the danger of flipping over and freezing to death in the sea water is a constant thought. The beauty of the islands as I paddled near them was mesmerizing.  The Shumagin Islands look like something out of a prehistoric world.  I keep expecting to see a dinosaur walking up one of the rocky hillsides. I didn’t see any prehistoric creatures on the kayak, but I did see some puffins, a seal, and a wide variety of other seabirds too far away for identification.  Kelp was also floating around in abundance. I should mention that I was sea kayaking from about 8:30 to 11:00pm, but it was still daylight the whole time.  It is near the summer solstice, so daylight lasts for about 18 hours or so each day. Right now, the sun is rising at about 6:00am each morning and setting at about 11:30 each night. It is really unusual to be out on a sea kayak in bright daylight in the middle of the night!

Create Your Own NOAA Experiment at Home 
You can use simple items from your kitchen to see how cold the water in Alaska feels. You will need some ice water, a thermometer, and a bowl. First, put the ice in the bowl and pour the water over it. Next, place the thermometer in the bowl with the ice water.  Wait until the temperature goes down to about 45 degrees Fahrenheit.  Now, place your bare hand in the ice water. How does it feel? Try it with a glove on.  Do you feel a difference?  Remember, your body temperature is about 98 degrees Fahrenheit, so you are putting your hand into water that is about half your body temperature. Can you imagine how it would feel to fall into this water?