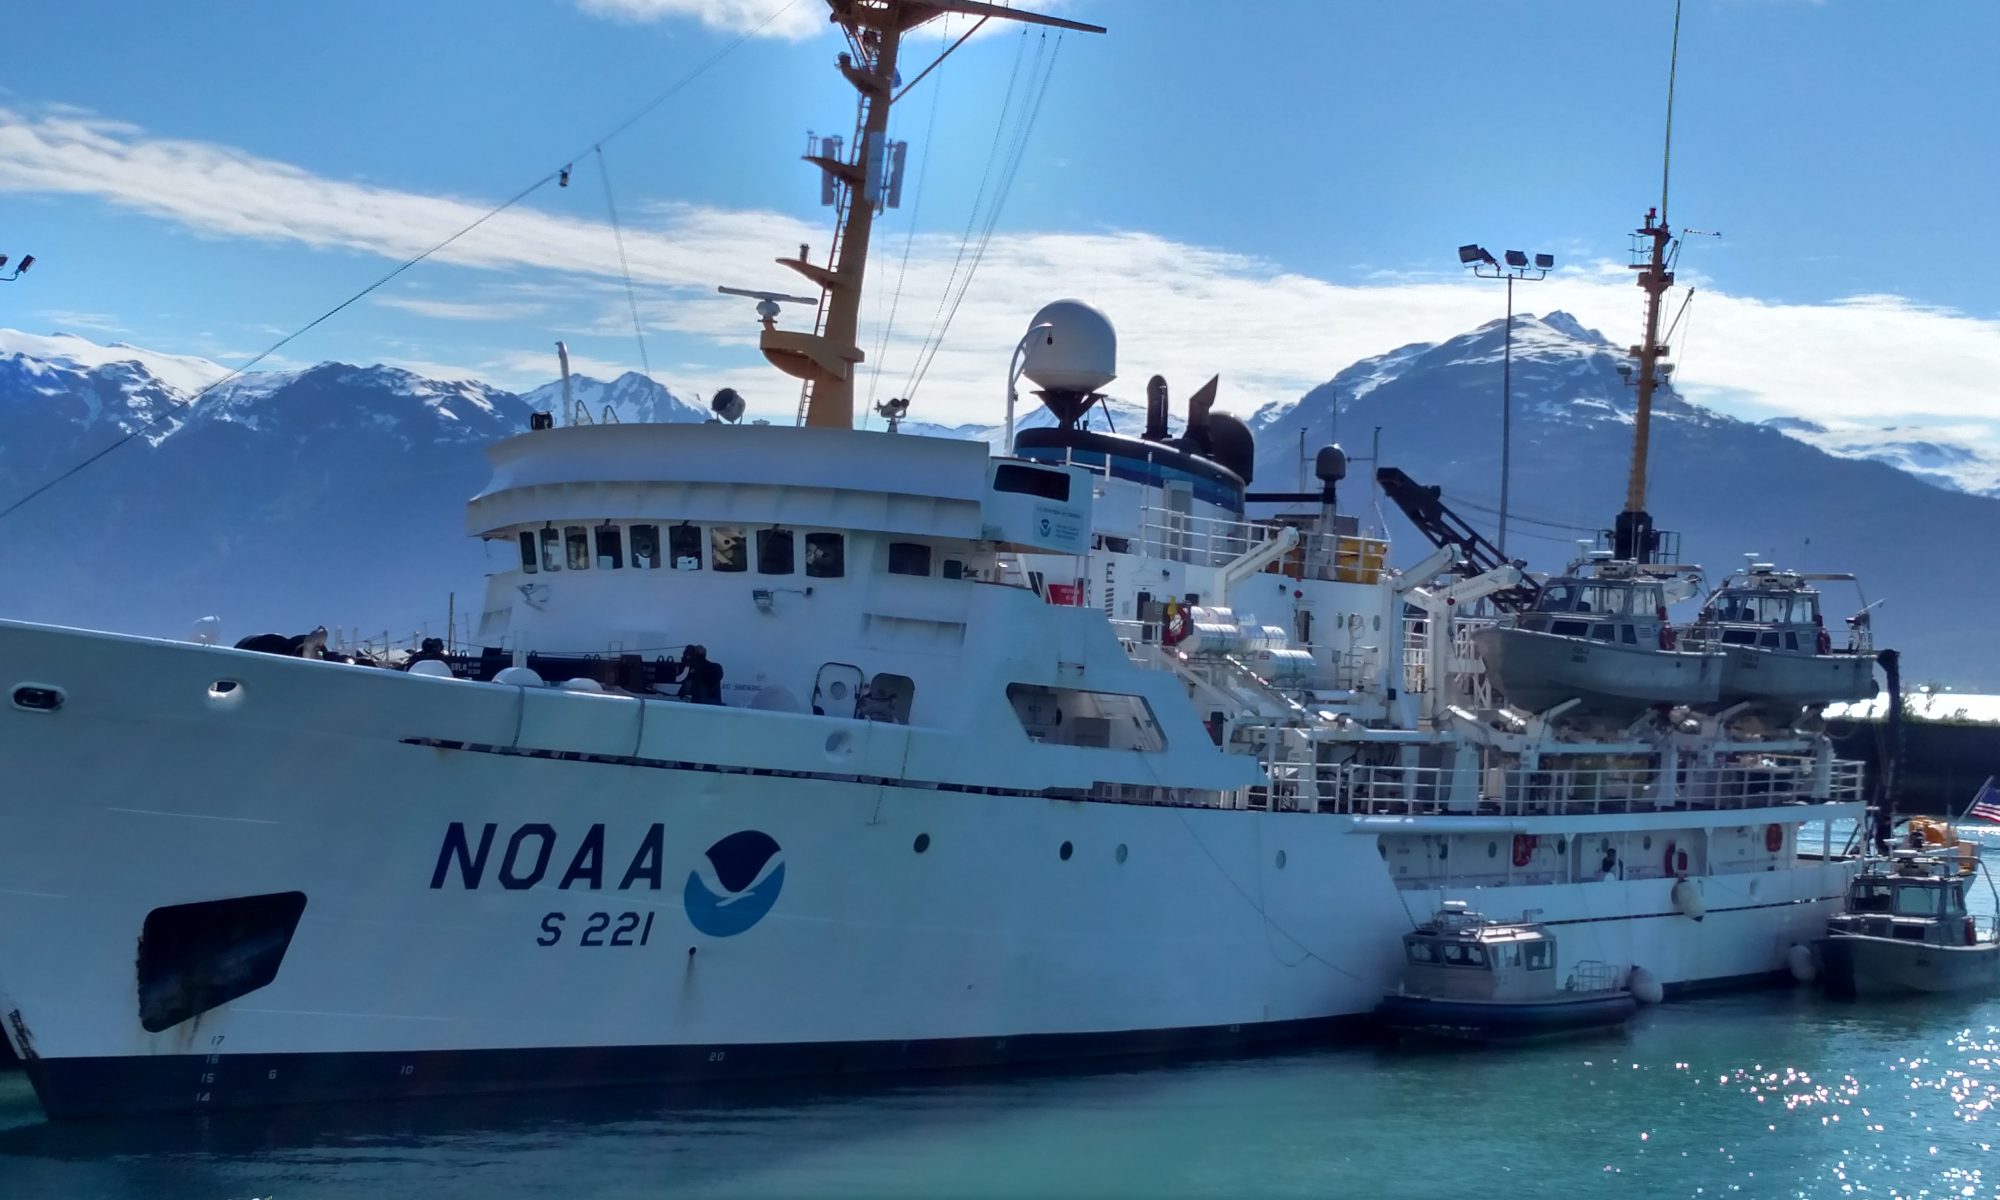
Staci DeSchryver: A Whale of a Time, August 8, 2011

NOAA Teacher at Sea
Staci DeSchryver

Onboard NOAA Ship Oscar Dyson
July 26 – August 12, 2011 

Mission: Pollock Survey
Geographical Area of Cruise: Gulf of Alaska
Location: Barnabas Trough  56 deg 54.05N, 152 deg 38.100W 
Heading: 252 at 2.4 kts
Date: August 8, 2011

Weather Data From the Bridge
Dry Bulb Temp:  11.0 deg C
Wet Bulb Temp: 10.0 deg C
Pressure:  1020 mb and steady
Cloud cover:  Mostly Cloudy, Altostratus
Wind:  16 kts at 271 deg
Station model 08.09

Science and Technology Log

One of the most important abilities the NOAA Corps officers should master is the capability of navigating the ship.  Today, I got a brief tour of the all of the neat gadgets on the bridge that keep us “headed” in the right direction!

The tour started off with me playing the “What if?” game.  Poor guys.  It went a little something like this:

ENS Rodziewicz:  This machine tells us our current heading.

Landlubber DeSchryver:  What if that thing breaks?  Then what?

ENS Rodziewicz:  Well, then we use this machine over here.

Landlubber Deschryver:  And if that breaks?

ENS Rodziewicz:  (sighs)  We use this alternate machine.

Landlubber DeSchryver:  And if that breaks?

ENS Rodziewicz:  Well,  this would be our last stop if we were in a real pinch.  He points to the magnetic compass.

Landlubber DeSchryver:  And what do you do if that breaks?

I realized my gaffe as it was flying out of my mouth.

He politely informed me that compasses don’t break.   I knew that.  I just didn’t remember it right that second…

Thankfully, he didn’t hold it over my head too long as the tour continued.  As it turns out, much of the tour went in the same manner.  The Oscar Dyson’s bridge can also be called the Department of Redundancy Department.  There are multiple back-up systems to combat malfunctions on all counts.  They even have a hand-held crank phone on the bridge in case things really head south.  The bridge has the following instruments/gadgets:

  • Two Radars to detect oncoming traffic/small islands
  • One computer screen to list, by name and give speed/direction of said oncoming traffic
  • Two computers for plotting course – one of them has “layering” capabilities to include depth, traffic, heading, and the ability to program the ship to steer itself
  • Speaking of steering – there are at least 4 separate places for the “driver” to “drive  the ship.”
  • Two compasses
  • A radio, hand-crank phone, and backup generator power supply for all items in the event of a cataclysmic failure.
  • A superior selection of hard candies for bridge visitor/users perusal.

After the tour, I was a little cross-eyed at all of the instrumentation and its capabilities.  I’ve also evaluated and concluded that the Oscar Dyson would be a great place to hole up in the event of an apocalypse, as she is truly ready for anything.

At the end of the day, I really enjoyed looking at the multi-colored information recorders, but what I really wanted to know was “How did the old school guys get the job done?  You know, drive the ship with maps and compasses?”

nav tools
Here are some handy tools for navigation!

As it turns out, there are many factions of Old School sailing.  The oldest group had nothing more than a map, a compass, a sextant, and the stars or the sun to get the job done.  But we’ve been using GPS for quite some time now, so some would consider a single GPS system with satellite passes that would “ping” the ship twice a day as Old School.  It was a nice reminder that we certainly live in a different age!

One of the neat tricks I learned to do tonight was how to calculate the true wind speed.  If you aren’t familiar with true wind speed and direction, here’s a brief tutorial:

It’s time to think in terms of relativity.  Everything on Earth is relative to something else.  Think about the last time you got into a car and sat in the passenger seat.  Relative to the car, the passengers in the car don’t appear to be moving.  BUT…to an observer on the street outside of the car, both the driver and the passenger are moving – in a given direction with a given speed.  (To get technical, they are moving with velocity only – recall that velocity is speed with direction.)  Now, let’s picture riding in the back seat of a car.  The passengers in the front don’t appear to be moving.  If the driver accelerates past another moving car, the car that is getting passed appears to be moving backward.  Some people blame their eyes playing a trick on them.  They shouldn’t.  Relative to your position in the moving car, they are moving backward.  To viewers watching the cars move while standing on the street, both cars are moving forward.  Tricky.

Now, let’s think about this with a ship.  If a ship is trying to calculate the wind speed while it’s moving, it’s not going to get a good reading.  Why not?  The boat effectively creates its own wind as it’s zooming through the ocean.  It can also give a false direction because the ship is not necessarily cruising along in the same direction of the wind.  How do we solve the problem?

Tonight, I learned how to use a Maneuvering Board to calculate the true wind speed and direction.  A maneuvering board is like a fancy piece of circular graph paper that can do so much more than regular graph paper can.  If graph paper is the cat’s meow, the Maneuvering Board is the lion’s roar.    By drawing the vectors of the ship and the relative wind, the true wind can be calculated on the board.

maneuvering board
This board is useful to sailors becuase it can be used for many calculations - wind speed and direction, charting around stationary objects, and charting around other ocean traffic are some good examples.

Remember, the ship has a speed and a direction – its total motion is a vector quantity.  Wind also has a speed and a direction – its total movement is ALSO a vector quantity.  I’m sure as you read you can hear the vector demon whispering in your ear, prophesizing about what is to come…time to resolve vectors…time to resolve vectors…Just give in.  There’s no use fighting it, mostly because vectors are super-awesome.

In order to calculate the true wind speed, both the relative speed and direction of the wind and the true direction and speed of the ship must be taken into account.  Once those two vector quantities are added (or subtracted, depending on the motion of the ship and the wind) the true wind speed and direction can be calculated.

But we only have to do that if all of the instrumentation catastrophically fails on the bridge.  A lot of the people on the bridge will complete a maneuvering board on occasion, just to stay fresh.  Otherwise, you just read the screen.

Personal Log

WHALES!!!  WHALES EVERYWHERE!!!  Tonight as we were moving between transects, we were invited to join a humpback whale party.  I was on my way up to the bridge to see what sorts of shenanigans were going on when someone informed me that the bridge was the place to be because there was a whale.  Well, when I got to the bridge, it was NOT a whale.

Whale!

There were at least 15.  It started off as two or three spouts in the distance.  Then came the tail flukes slowly and playfully slapping the water.  They were everywhere!  As if that weren’t a beautiful enough show, they began to breach – exploding out of the water and returning via a graceful dive.  We must have seen 8 to 10 breaches.  I don’t know if any one whale breached more than once, but it felt like just as one re-entered the water, someone was shouting “Breach!” in a completely different direction. Two swam within about 50 feet of the Dyson, and we had to change our course briefly for one particular whale who was fancying our transect line as a place to play.  We stayed up on the bridge for about an hour, just watching them have a good old time in the sea.  I’ve never seen anything like it, but I hope to see it again soon.  I got some on video, but my plan is to wait until I’m home to upload videos to my blog because it takes up a lot of internet to upload videos at sea.  It was an incredible and powerful sight.  Scientists still can’t completely confirm why they breach, in particular why humpback whales breach, but I’m not going to ask questions as long as they keep doing it!  What a trip!

In other news, I’ve been combatting seasickness quite handily (I hope I haven’t spoken too soon! Uh oh!) by using a transdermal ear patch.  I tried using  some other anti-seasick meds, and they worked just fine, but they made my brain feel foggy – not a good state to be in while assessing fish stocks!  Finally I just gave up and went to the patch.  I didn’t want to overload my body with medication, but it’s critical that I remain alert while at sea.  It is also critical that I do not hang halfway over the side-rails for extended periods of time.  After all, I still don’t have my sea legs.

AK Sun
I've been working hard, but when my view from the chem lab looks like this, I would call it hardly workin'. Gorgeous!

Up on the bridge, one of the NOAA Corps Officers asked me how long I had been wearing my patch.  I told him I was going on hour 48.  He told me I ought to take it off because my pupils were wildly dilated, which is a side effect of this particular medication.   Admittedly, I kind of blew the advice off, because even if my pupils are big, at least I’m not feeding fish.  A reasonable trade off in the grand scheme of things, in my meek opinion.

Then I caught a glimpse of myself in the mirror.  Have you ever seen the cartoon classic feature film Who Framed Roger Rabbit?  Yeah.  I look like one of those bad-guy Toontown  weasels after he gets hit on the head with a frying pan.  Both of my pupils are large, but one (the one that shares the same side as the ear patch) is considerably larger.  In case you are having a hard time picturing this, I have converted this image into a “dilated emoticon face” to give you a reasonable  representation of my eyes:  o_O    <– me.   So, I’m currently at an impasse.  I was told that after three or so days at sea, it’s not necessary to continue medication because your body adjusts to everything constantly moving.  I don’t know how I feel about that.  I also don’t know how I feel about looking like a crazy cartoon weasel for the next five days.   So, with that being said, I think I may resolve the issue by cutting the patch in half and reducing the medication amount.  It is my hypothesis that my pupils may return to regular, well matched sizes at that juncture.  It is also my hypothesis that I will remain an able-bodied sea girl in doing so.  I guess we’ll see what happens.

Trivia Question:  Where was the Oscar Dyson built?  In what year was she launched?

*Answer:  She was built in Mississippi, and launched in 2005.

Obed Fulcar, July 21, 2010

NOAA Teacher at Sea Obed Fulcar
NOAA Ship Oscar Dyson
July 27, 2010 – August 8, 2010

Mission:Summer Pollock survey III
Geograpical Area:Bering Sea, Alaska
Date: July 21, 2010

Weather from the Bridge:
Time: 0345 pm
Latitude: 57.23 degrees North
Longitude:173.33 degrees West
Wind: 12 knots
Direction: 257 degrees West
Sea Temperature: 8.5 degrees C
Air Temperature: 8.85 degrees C
Barometric Pressure: 1020.0 mb
Skies: Partly Sunny

Science and Technology Log:

Buddy Gould
Buddy Gould

Yesterday, Tuesday July 20, we finally left Dutch harbor, once all the delayed scientific equipment arrived. I was later told that it included some new and sophisticated technology to track and measure fish underwater. We climbed up to the “flying bridge” at the very top of the ship to see the view of Dutch harbor behind us and the open ocean ahead. After that we came down to the bridge where Acting Executive Officer XO Sarah Duncan, Ensign Amber Payne, and Buddy Gould from the Deck Department gave us a tour of the bridge. They explained that the panels of navigational instruments used to sail the ship included Radar screens, to detect any vessels or ships in the proximity, one for long range, and another for short range, showing any ships close by. The screens show the many readings from instruments on board such as wind speed (in knots), Wind direction (in degrees), Latitude, Longitude, and Air Pressure (in millibars).

Navigational Instruments

Next we received a demonstration in how to chart a course using the Electronic chart. I was surprised to understand the navigational terminology, (Iguess my Basic Sailing class is paying off), such as true wind, leeward, aft, forward, et…
I asked if they still used paper Nautical Charts and the answer was yes, they use them to plot the course of the ship using pen, ruler, and compass. I was surprised to know that even with all this technology even though the ship course and navigation is done completely electronically, they still rely on pen and paper charts as back up! On the bridge were also two scientists fro the US Fish and Wildlife service working on Seabird research, as part of the Bering Sea Integrated Ecosystem Project, a multidsciplinary study that is looking at how climate change is affecting the ecosystem of the Bering Sea. liz and Marty were both working from the bridge with binoculars, observing and counting all seabirds within 300 meters from the ship. armed with a laptop computer connected to the ship’s navigational system they were able to count and input the GPS location (latitude/longitude) of every sighting of a seabird, and plot a GIS graph in real time. I found this to be really cool! We saw seabirds found on the Bering sea such as Black-footed Albatross, Northern Fulmar, Tufted/Horned Puffin, Fork-tailed Storm Petrel, and Thick-bill Murre.

Personal Log:
Today is Day 4 of the mission and so far I have done pretty well in terms of motion sickness. A calm sea has been a great factor and has allowed me to get adjusted to life at sea. I am surprised to find myself at home in my my bunk bed, and haven’t had any difficulties sleeping at all, though I do miss my bed. The long schedule from 0400 to 1600 (4pm) full of activities has been of help keeping me busy. The food is great thanks to Floyd the master cook with a variety of international food and home baked pastries. I was also impressed by the international collaboration in this mission, with two Russian scientists on board conducting research on the fisheries of the Bering Sea since part of the transects or line passess done by the Oscar Dyson cover Russian territorial waters as well.
New Vocabulary Words;
Nautical charts, Radar, Latitude, Longitude, GPS (Global Positioning Satelite), Leeward (opposite to wind), Forward (front of ship), Aft (back of ship)

Animals seen today:
Black-footed Albatross, Northern Fulmar, Tufted/Horned Puffin, Fork-tail storm Petrel, Thick-bill Murre
Bitacora Marina #2: Ayer martes, 20 de Julio finalmente zarpamos hacia alta mar. Los oficiales del Oscar Dyson nos dieron un tour del puente explicandonos los sofisticados instrumentos de navegacion electronica como Radares, sonar acustico, y sistema global de ubicacion por satelite (GPS).A pesar de tanta tecnologia, todavia se grafica el curso de la nave usando Cartas Marinas, compas y lapiz!Tambien me presentaron a una pareja de biologos del Servicio de Pesca y Caza de los EEUU, haciendo un conteo de las aves marinas del Estrecho de Bering, graficando en tiempo real cada observacion en un ordenador laptop usando tecnologia GIS, o sistema de informacion geografica.

Dan Steelquist, July 21, 2009

NOAA Teacher at Sea
Dan Steelquist
Onboard NOAA Ship Rainier
July 6 – 24, 2009 

Mission: Hydrographic Survey
Geographical Area: Pavlov Islands, Gulf of Alaska
Date: July 21, 2009

Weather Data from the Bridge 
Latitude: 55°10.84’ N
Longitude: 161°41.87’ W
Visibility: 10+ Nautical Miles
Wind Direction: 220° true
Wind Speed: 16 knots
Sea Wave Height: 0-1ft.
Swell Waves: 1-2 ft.
Water Temperature: 9.4° C
Dry Bulb: 10.0° C
Wet Bulb: 9.4° C
Sea Level Pressure 980.0 mb  

Science and Technology Log 

NOAA Ship Rainier from the shore of Wosnesenski Island

NOAA Ship Rainier is an important workstation used for gathering hydrographic survey data. Rainier is able to cover large distances in order to get to remote places where charting information is needed, but there are no communities from which hydrographers and crew can work. Therefore Rainier herself is a compact city.  The science of operating a small city might seem simple enough, but a closer look at the major parts and it becomes obvious that there is much involved. Two of the areas I have found to be very interesting would be the bridge, where the ship is operated when underway, and the engineering department (the “public works department” of this small community).

The bridge is the command center of the ship. While tied to a pier or at anchor, there are many responsibilities for those on duty on the bridge. Weather data is gathered every hour and radios are monitored for any emergencies that might come up on other ships in the area. While at anchor, the ship’s position is closely watched using radar and GPS to be sure the anchor is holding fast. While underway, the bridge has direct control of the engines and steering. Safe navigation and following a predetermined sail plan are also the responsibilities of those on the bridge. Getting this small city safely and directly to the places it needs to work is critical to the mission of the Rainier.

The engine room is also a very important and interesting area on board this ship. Rainier has two large diesel engines each capable of producing over 1,200 horsepower. A typical automobile produces between one hundred and two hundred horsepower. Those two engines can push this 231 ft ship at a cruising speed of about thirteen knots per hour.  The engineering department can be compared to a public works department of a city because they provide many of the same services. All of the electricity used by Rainier is generated on board. The engineering department is also responsible for making fresh water from salt water using evaporators capable of producing one hundred fifty to one hundred seventy gallons per hour. Any wastewater created on the ship is also treated on board Rainier before it is discharged. The engineering department is also responsible for all of the heating and cooling systems onboard the ship including a large walk-in refrigerator and freezer. Rainier is capable of carrying a crew of over fifty people on hydrographic survey missions for up to three weeks at a time. To make that operation possible, this ship is a floating city complete with all the services and utilities any small town would need to function effectively.

Personal Log 

I’ve been on board Rainier now for almost three weeks. I have seen and learned many things. The work of the hydrographers is very important. The ship provides an excellent work platform from which to gather data and each of the different departments contributes greatly to the mission of the ship. There is quite a bit of quality science and mathematics going on everywhere on board. I have had a chance to watch these people work and I have seen science and math being applied everywhere. What has stood out to me the most over these weeks has been that even with the variety of types of work being done on Rainier everyone works together to get the mission completed. I am excited to share all my experiences on board with my students back home. Perhaps one day some of them will have a chance to be a part of a ship like this.

Something to Think About 
The Rainier has many different types of work on board that require many different types of knowledge. If you want to apply navigation interest, work with computers, become an engineer, work as a deck hand, become a cook, or become a scientist, why not do it on a NOAA ship like Rainier?

Mary Patterson, June 17-19, 2009

NOAA Teacher at Sea
Mary Patterson
Onboard NOAA Vessel Rainier 
June 15 – July 2, 2009 

Mission: Hydrographic Survey
Geographical area of cruise: Pavlov Islands, AK
Date: June 17-19, 2009

Weather Data from the Bridge 
Overcast
Wind 15 kts
8 mi visibility
Pressure 999.5 mb
Dry Bulb Temp 6.7◦ C Wet bulb 5.6◦ C
Seas 0-1 ft.
Water temp 6.7◦C, 44◦ F

Here I am getting ready to cast the CTD.

Science and Technology Log 

While the weather holds, we head out on the launches to survey areas that are not charted or were last charted probably back in the time of Captain Cook. After the boats are lowered using gravity davits, 4 boats head out to survey. Upon reaching the survey area, the first thing that gets done is a casting. This consists of lowering the CTD (Conductivity, Temperature and Depth) unit into the water at the surface for 2 minutes for calibration. Then it’s lowered to the sea floor (taking measurements as it goes) and brought back up to the surface with a winch and a pulley system. The sensor unit is cabled to the computer and the data is downloaded. This is a vital step in interpreting the sonar data. Since saltwater conducts electricity differently based on the salt concentration, using the CTD gives the hydrographer information about sound velocity at different depths.

Velocity of sound is most affected by temperature, which is also measure by the CTD.  Next, the hydrographer decides whether to use the high or low frequency transmitter depending on the depth. The hydrographer uses a lower frequency for deeper water.  Casting is often done again after lunch since temperatures can change, especially at the surface. Alaska is known for the confluence of fresh and salt water at the surface due to melting glaciers and fresh water runoff. The MVP (moving vessel profile), is another device used for sound velocity. It looks like a torpedo and it’s towed behind the boat allowing for continuous casting.

The shape of a plane has more points than a boat so is a good way to use points to line up a survey transect.

The plane you see on the picture is used instead of a boat because of the position of the GPS sensor relative to the shape. The coxswain can make the plane pivot on a point as they line up on a line to survey. On the survey, the map is broken down into polygons. Each sheet manager gets a sheet with their polygons to survey. Surveying consists of the coxswain driving the boat as they watch the computer screen. As they drive, the screen shows in real-time a swath of color indicating the swath of the beams. After surveying, the boats return to the ship and are hoisted back up onto the davits. All survey techs meet in the wardroom to discuss what happened on their survey. The Captain and FOO (Field Operation Officer) ask questions about what was surveyed and any problems they had with any equipment. This is a true community of scientists who share data and knowledge.

Worksheet with polygons completed

Personal Log 

We load the launches at 8:00 am and complete surveys until noon.  We break for lunch and unpack the ice chest packed by the cooks for us. It’s always a surprise to see what we have! Then we continue surveying until about 4:00 pm when we return back to the ship. I have had the opportunity to cast the CTD unit into the water, drive the launch and collect the data on the computers. The coxswains make driving the boat following the lines on the computer look so easy! Especially in rough seas, the coxswains do an amazing job of helping the survey techs collect data. Again, good communication is a key! I’ve also seen how the techs have to problem- solve on a daily basis.

One day we got into the launch and the engine wouldn’t start and the coxswain had to troubleshoot the problem. Another day, several boats had problems with their CTD units and they had to repeat trials several times. When you are 12 miles away from the nearest help, it’s crucial to have good problem-solving skills. After dinner, there’s time to finish writing journals, do laundry, fish off the fantail, watch a movie, play guitar hero or exercise in the gym area. Then, it’s time for bed and the day will start over again. If you are not on a survey launch, you work in the night processing lab compiling the data collected by the survey techs during the day’s launch. This includes applying various filters to clean up the “noise” or fuzziness from the sonar. The coolest part is seeing the data in three dimensions. After the data is cleaned up, the sheet managers write up a descriptive report that gets sent to Pacific Hydrographic Branch. This ship is a great example of a system: there are many separate parts that when combined with other parts, complete a task. 

Pavolf and Pavlof’s Sister are active volcanoes.

Each night at 10 pm, fellow Teacher at Sea –Jill Stephens and I go to the bridge and collect weather data that is transmitted directly to NOAA. Although the days have started off hazy and grey, by evening we often see sunshine that lasts until 11:00 pm. This part of Alaska is breathtaking! I love watching the volcanoes, Pavlov and Pavlov’s sister, in different types of light.

Animals Seen 

Whales, Puffins, and Sea gulls.

New Word of the Day 

Cavitation: The sudden formation and collapse of low-pressure bubbles in liquids by means of mechanical forces, such as those resulting from rotation of a marine propeller. 

Mary Patterson, June 16, 2009

NOAA Teacher at Sea
Mary Patterson
Onboard NOAA Vessel Rainier 
June 15 – July 2, 2009 

Mission: Hydrographic Survey
Geographical area of cruise: Pavlov Islands, AK
Date: June 16, 2009

The sonar processor and computers

Weather Data from the Bridge 
Overcast
Wind 19 kts
4-6 ft seas, 9-11 ft swells
10 nautical mile visibility
Sea Temp 6.1◦ C
Sea level air pressure 1001.0 mb
Dry Bulb 8.9 Wet Bulb 8.3

Science and Technology Log 

The day was spent in 17 hours of transit to our survey location. During the day the seas turned heavy with 4-6 foot seas and 9-11 foot swells. Even some of the crew and seaman had to hold onto the walls as they walked. The ship definitely rocked and rolled! This was a great test of the trans-derm scop patch to prevent sea-sickness. I was so surprised that it worked so well.

ET John Skinner checked my computer to be sure it was virus free and then set up access to the ship’s email and internet. The ship receives internet through a satellite signal. All ship personnel have to take a computer security test in order to login to the ship’s network.

The Rainier sails through 10-foot swells!

After completing my computer safety module, John took me and fellow Teacher at Sea, Jill Stephens, on a quick tour of the launch boats and described the technology installed on them. Each 29 foot launch boat is worth more than a million dollars with all the equipment aboard. John showed us the sound velocity meter, the high and low frequency multibeam echosounder transducers to send and receive the signal, and the computers that collect and store the data. (I’ll explain more about how these work in my next journal). Each boat also has GPS (Global Positioning System), Iridium satellite phone, AIS ship identification (Automatic Identification System that broadcasts in the VHF frequency), marine RADAR, VHF marine radio, fathometer, compass, life raft, fire extinguishers and fire suppression systems.

Here we see the low-frequency multibeam sonar on the left and the high-frequency multibeam sonar on the right.

Personal Log 

After dinner, the first POD (Plan of the Day) was posted. This is produced by the FOO (Field Operations Officer). I excitedly found my name on Launch # 5. Our mission tomorrow will be to find a safe anchorage for the ship on the south side of Ukolnoi Island. We will be surveying ocean floor that has not ever been charted before. It’s amazing how easy it is to fall into the ship’s routine here. Breakfast is at 7:00 am, lunch at 12 noon and dinner at 1700 (5:00PM). After dinner, I visit the Bridge and see the many instruments used to guide the ship safely. My favorite piece of equipment is the Clearview screen, or “rain spinner”. It has two pieces of glass that spin and keep the windshield clear of rain.

The Clearview screen, also called a “rain spinner”

I learn that all the weather data is taken here on the bridge and then submitted to NOAA for their meteorological database.  Next, I visit the chart room where the survey techs process the data collected by the launches. Tonight, they are anxiously planning the areas to survey tomorrow. The people on the ship are so very interesting and friendly. It’s great to hear their stories of how they came to the ship and how much they enjoy the work they do.

Did You Know? 

Sergio Taguba, our Steward, has been on the Rainier the longest of anybody? He’s been here for 36 years!