Jennifer Dean: Departures and Deep-Sea Devotion, May 22, 2018

NOAA Teacher at Sea
Jennifer Dean
Aboard NOAA Ship Pisces
May 12 – May 24, 2018

Mission: Conduct ROV and multibeam sonar surveys inside and outside six marine protected areas (MPAs) and the Oculina Experimental Closed Area (OECA) to assess the efficacy of this management tool to protect species of the snapper grouper complex and Oculina coral

Geographic Area of Cruise: Continental shelf edge of the South Atlantic Bight between Port Canaveral, FL and Cape Hatteras, NC

Date: May 22nd, 2018

Weather Data from the Bridge

Latitude: 32°54.0440 ’ N
Longitude: 78° 12.3070’ W
Sea Wave Height: 1-2 feet
Wind Speed: 10.29 knots
Wind Direction: 196.7°
Visibility: 10 nautical miles
Air Temperature: 25.5°C
Sky: Scattered clouds

Science and Technology Log

Interdependence and Energy Pyramids
Every ecology unit from elementary to high school incorporates these 2 essential learnings: matter cycles and energy flows. This flux of energy through biotic factors is depicted in diagrams like the one below. This survey work involving an inventory of biotic and abiotic factors in and outside the MPAs (Marine Protected Areas), reminds me of the relationships and connections between the organisms in these pyramids and food webs. Organisms with their niches (role or position in the environment) need to be counted and understood. These marine creatures play important jobs in a complex ecosystem of our oceans. I decided to dedicate this last blog to highlighting some of these underappreciated marine organisms and their contributions to both the marine ecosystems and mankind.

energy pyramid PHOTO CREDIT: https://www.sciencelearn.org.nz/resources/143-marine-food-webs

Seeing the beauty underneath the waves convinces me of my obligation to educate, protect and recruit the next generation of stewards for this fragile environment. Below are images of some of my favorite organisms photographed during the ROV (Remotely Operated Vehicle) dives and an explanation of a fraction of their significance to a healthy marine ecosystem. I insist that my students approach their labs in class with background research that addresses why we should care about any given topic of scientific study. So here are only a handful of the many reasons we should care about these critters of the sea.

Phylum Porifera – Sponges
What are they?
Phylum Porifera, considered one of the oldest animal groups, may have existed as far back as the Pre-Cambrian period (577-542 millions years ago). This group derive their name from a Latin root meaning “pore bearer”. These animals are filter feeders that have a unique body design made up of asymmetrical bodies of specialized cells. Although multicellular sponges do not have tissues, they are comprised of two layers of cells, epithelia and collar cells, with a jelly-like substance in between. Sponges are covered with tiny pores (ostia) that bring water into canals and that empty out to larger holes (oscula).

Why we should care?
Research indicates that sponges play huge roles in filtering the water column, recycling 10 times as much organic matter than bacteria and producing nutrition for both corals and algae. Studies have traced the matter from shed dead cells (choanocytes) of a certain species of sponge that appear (after ingestion) within 2 days in the tissue of snails and other invertebrates.

If their valuable ecosystem services are not enough, remember that over 5000 different excretions from sponges have demonstrated medical uses from fighting cancers to arsenic detoxification.

Phylum Cnidaria – Anemones, jellyfish, corals, and more
What are they?
Very diverse group with over 9000 species. Unlike the sponges, with their asymmetry, anemones possess radial symmetry and the ability to sting. Cnidarians includes organisms such as the jellyfish, box jellies, hydras, moon jellies, purple jellies, Portuguese man-of-war, corals and sea anemones. Their stinging cells (nematocysts) have Greek roots, “cnidos” means stinging nettle. Some of these organisms have nematocytes (stinging cells) that eject poison infused barbed threads when touched. Organisms of this phylum generally have a central gut surrounded by tentacles, but take on one of two body forms, either a medusa (free-floating with mouth down), or a polyp (attached to a surface with mouth up). Cnidarians in the polyp stage can live in colonies made up of many similar individual organisms (called zooids). In the case of corals, these zooids are connected by an exoskeleton of calcium carbonate which form coral reefs in the tropics. Cnidarians are diverse in form and function, serving as both predators and prey within many food webs and establishing critical habitat, like coral, for innumerable species.


Why we should care?
They provide homes for other organisms, such as shrimp and reef fish. Sea anemone venom has been found to have biomedical importance in treating conditions such as Multiple Sclerosis, other autoimmune conditions, gastrointestinal disorders and even chronic pain. Toxins from sea anemone are often bioactive compounds that interfere selectively with certain ion-channels in cell membranes. This specificity makes them good potential tools for therapeutic treatments for a variety of human ailments. Their physiology, and use of a nematocyst, is being studied as a potential drug delivery method. Scientists are studying the biomechanical method that Cnidarians evolved millions of years ago to deliver poison to their prey. Recently, Cnidarians role as biological indicator species has also made them a valuable tool for use in monitoring contaminants in aquatic environments.

Phylum Echinodermata – Sea Cucumbers, Starfish, Sea Urchins
What are they?
This phylum includes the sea cucumbers, sand dollars, brittle stars, crinioids, sea stars, and sea urchins and derives its name from Greek roots meaning spiny (echino) skin (derm). 8000 species make up this radial symmetrical group. All members have an internal skeleton made up of ossicles below a layer of skin that can possess pigment cells or mucus and toxin secreting cells. A water vascular system in starfish acts like a hydraulics system using canals networked though muscles and valves to control pressure to provide movement, respiration and the ability to deliver nutrients to tissues and remove waste products. Many starfish are featured in environmental science textbooks as keystone species. A keystone species is one that if removed, the ecosystem could change significantly or collapse.

Why we should care?
Echinoderms are used for food, from making certain soups to being considered a delicacy in some southeastern Asian countries. Echinoderms skeletons are even used in farming to provide lime for soils. The ability of the species for regeneration of muscle tissue is a feat of intense interest in the biomedical world. Echinoderm musculature most closely resembles human smooth muscle tissue (such as lining arteries, veins, and intestines) than skeletal muscles. Not to be out done by Cnidarians and Porifera, sea cucumbers also release toxins that have been demonstrated to slow the growth rate of tumors. Other bioactive compounds isolated from echinoderms have demonstrated potential anti-coagulant (blood clotting) properties.

These species of the marine world possess information that could be critical for the survival of humans and for the health of marine ecosystems. The United Nations Environment Programme reports that “Today’s massive loss of species and habitat will be slowed only when the human community understands that nature is not an inferior to be exploited or an enemy to be destroyed but an ally requiring respect and replenishment. We are part of the web of life. Many strands already have broken. We must act quickly to repair what we can. Our lives and livelihood depend on it.” I do hope we act quickly and that we can be dedicated and devoted to their protection for future generations.

Phylum Arthropoda – (Marine) Crabs, Shrimp, Sea Spiders
What are they?
Greek arthron meaning ‘joint’ and pous meaning ‘foot’ representing their segmented bodies and appendages. Fossils of some of the simplest jointed animals date back to the Cambrian (545 million years ago). Arthropods have a hard exoskeleton made of chitin (nitrogen-rich polysaccharide). This body armor protects the soft body, and provides attachment sites for muscles. Their bodes are made of 2 or 3 sections, the head (cephalum), chest (thorax), and an abdomen. This phylum is incredibly diverse and has the most individuals and number of species of animals on the planet. 10% of the roughly 1 million species are found in the marine environment. Subphyla include Crustacea (crabs and shrimp), Phycnogonida (sea spiders) and Merostomata (horseshoe crabs). In this blog I am going to focus on only a small subset of this phyla seen on the dives, like the especially creepy looking sea spider and squat lobster (found in a glacial scour area at a depth of 250 meters among phosphoric rock boulders on ROV dive 2 on 5/21/2018).

Why we should care?
First, many people find some species of this phylum very tasty, such as some of my favorites – shrimp, lobster and crab, which belong to the subphylum Crustacea. Crustaceans are considered an important link in the marine food web that provides a connection between the benthic (bottom) and pelagic (open sea). Some species filter water, others break down organic matter, while others are critical in the food chains of fish such as cod, eels and herring. Research shows that chitin particles in clam, lobster and shrimp shells may have anti-inflammatory properties. In the future, shellfish waste could be turned into medical ingredients for products that could reduce suffering from conditions such as inflammatory bowel disease.

For teaching about this Phyla check out the link to this
Arthropoda Lesson Plan.

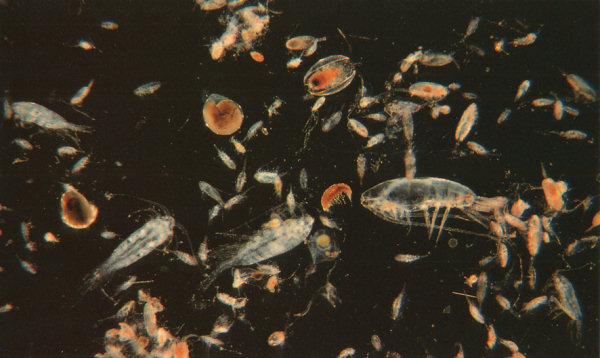
Other Cool Creatures Caught On Camera:

This slideshow requires JavaScript.

Personal Log

After looking through the photos of the organisms of these deep coral ecosystems I couldn’t help but want students and society at large to care about the protection of these biological communities. Not just because of the aesthetic value but for their roles in food webs, medical value and economic significance to our food industry. One major theme in environmental science is this idea of interdependence and interconnected systems. We are part of this system, but we also have a unique ability and obligation to preserve the stability and diversity of these areas.

What pictures I chose not to share on this farewell blog have another message, disturbing images and captions that could have spoken to fishing lines, trawl nets, coral rubble remnants (from shrimp trawling), red Solo cups, water bottles and plastic sheets that are scattered in even these deep reaches of the ocean floor. I like to hope these found their way to these deep locations because of ignorance not ambivalence. I hope to hear stories from my students on how they develop technologies to clean up our mess and lead their generation in establishing as a priority putting in place protections for these habitats.

A spotted dolphin A spotted dolphin

On break between dives these spotted dolphins put on a 15 minute show playing in the waves at the bow of the ship. It is easy to love these larger charismatic megafauna, performing their leaps and turns in the waves. But just like us, they are part of a complex food web and a delicate system of interdependence. I am reminded of the quote by John Muir, “when we try to pick out anything by itself, we find it hitched to everything else in the Universe.” We need to limit how much we are picking out of systems and through scientific knowledge assure our children and grandchildren inherit a healthy planet where these marine environments recover to their original thriving communities of marine organisms.

My time at sea passed quickly. I am thankful for the opportunity to experience jobs of those at sea that are collecting the information that contributes to better protections for these habitats. I appreciate all the lessons and stories that crew members and scientists shared throughout the trip. This experience awakens the scientist in me and inspires action in my classroom and community. I am extremely thankful for such an amazing experience.

What can you do to protect Marine Ecosystems?

Donate and participate in organizations that work for preservation and conservation

Know and follow the fishing and other marine life regulations

Seafood watch
Ocean Biogeographic Information System
https://www.fisheries.noaa.gov/rules-and-regulations
https://www.fisheries.noaa.gov/topic/laws-policies

Educate others – use your voice and your vote
A Census of Marine Life

To learn more: Habitat conservation for Deep-sea coral

Advice for other Teachers at Sea Aboard the NOAA Ship Pisces

Print a copy of all crew members full names, titles, emails (if possible) and pictures
For the first few days take your seasickness medicine early and keep your stomach full
Read a few of the articles or scientific studies published by the scientists on the cruise
Recheck that you packed your reusable water bottle and coffee mug

Did You Know?
Certain species of sea cucumber have a type of fish, a pearlfish, that have found a happy home inside the cucumber’s bum (cloaca).
You can determine the validity to this statement by checking out this video clip:

Fact or Fiction?
Certain species of fiddler crabs use a wave of their larger claw to entice the female crabs, and if you don’t have the right wave, you don’t get the girl.
Sexual selection for structure building by courting male fiddler crabs: an experimental study of behavioral mechanisms

What’s My Story? Andrew David

Andy Andrew David, Research Fish Biologist

The following section of the blog is dedicated to explaining the story of one crew member on Pisces.

What is your specific title and job description on this mission? Research Fisheries Biologist. For this study he is the co-principal investigator.

How long have you worked for NOAA? 28 years.

What is your favorite and least favorite part of your job? His favorite part of the job is getting to see things that most people never get to see in their life. Not many people get to see the fish and other invertebrates that live at 800 feet. His lease favorite part of the job is the government bureaucracy involved in being able to perform his job.

When did you first become interested in this career and why? In middle school, he also was inspired from watching the documentaries created by Jacques Cousteau. The discovery and adventure presented within the ocean in this series appealed to this son of a Navy diver. Growing up in central and northwest Florida, the ocean was always part of his life.

What science classes or other opportunities would you recommend to high school students who are interested in preparing for this sort of career? He recommends students take chemistry, biology and anything with math in it. He also stressed that English is important in his career or any STEM related job, so that you are able to express your science in writing.

What is one of the most interesting places you have visited? He found Australia, due to its unique flora and fauna, to be very interesting as evolution has allowed the adaptation of totally different species to fill niches found in other reef habitats. There are fishes which have evolved the same body plan to take advantage of certain feeding opportunities which are completely unrelated to fishes in other parts of the world that utilize those same feeding opportunities.

Do you have a typical day? Or tasks and skills that you perform routinely in this job? Half of his job involves being the diving officer for NOAA Fisheries and this always brings up unexpected action items. As a manager for diving supervisors, he makes suggestions to avoid accidents and incidents that arrive randomly and so there is a level of uncertainty to any given day. If a diving related issue arises he may spend a portion of his day on the telephone. With the diving officer duties he deals with situational incidents that aren’t written into policy already that need oversight and decision-making. He makes suggestions and recommendations in novel situations that are diving related. From the science side his time is involved in working on paper publications and the data analysis from ROV dives such as this one.

Has technology impacted the way you do your job from when you first started to the present? He mentioned that when he began this career he was using floppy disks and a 4 color monitor, now he has computing power that is incomparable. Internet and email did not exist when he began. The speed of data transfer and the ability to communicate information now occurs at a rapid rate. The science side with that of the ROV sophistication has improved with the ability to capture details with the high definition cameras, for example the ability to count tentacles on a polyp. These technical advances have allowed much more precise identifications and observations of the animals they study.

What is one misconception or scientific claim you hear about how the ocean and atmosphere works and/or NOAA’s mission that you wished the general public had a greater awareness of? On the broader scientific community, there are very few issues which foster a consensus of opinions. The public may think scientists all see the world from a liberal perspective, but there are many conservative scientists as well – they just don’t get as much media attention. From the fisheries perspective, he encounters the misconception that there are only 3 groups studied in fisheries; sharks, dolphins/whales, and turtles. The vast majority of fisheries work is done outside of these groups.

DJ Kast, Interview with Emily Peacock, May 25, 2015

NOAA Teacher at Sea
Dieuwertje “DJ” Kast
Aboard NOAA Ship Henry B. Bigelow
May 19 – June 3, 2015

Mission: Ecosystem Monitoring Survey
Geographical area of cruise: East Coast

Date: May 25, 2015, Day 7 of Voyage

Interview with Emily Peacock

Emily Peacock and her ImagingFlowCytobot. Photo by: DJ Kast

Emily Peacock is a Research Assistant with Dr. Heidi Sosik at the Woods Hole Oceanographic Institution (WHOI). She is using imaging flow-cytometry to document the phytoplankton community structure along the NOAA Henry B. Bigelow Route.

Why is your research important?

Phytoplankton are very important to marine ecosystems and are at the bottom of the food chain.  They uptake carbon dioxide (CO2) and through the process of photosynthesis make oxygen, much like the trees of the more well-known rain forests.

Ocean Food Chains. Photo by: Encyclopedia Britannica 2006 (http://media.web.britannica.com/eb-media/99/95199-036-D579DC4A.jpg)

The purpose of our research is “to understand the processes controlling the seasonal variability of phytoplankton biomass over the inner shelf off the northeast coast of the United States. Coastal ocean ecosystems are highly productive and play important roles in the regional and global cycling of carbon and other elements but, especially for the inner shelf, the combination of physical and biological processes that regulate them are not well understood.” (WHOI 2015)

What tool do you use in your work you could not live without?

I am using an ImagingFlowCytobot (IFCB) to sample from the flow-through Scientific Seawater System.

ImagingFlowCytobot. Photo: DJ Kast
Inside of the ImagingFlowCytobot. Photo by Taylor Crockford
The green tube is what collects 5 ml into the ImagingFlowCytobot. Photo by: DJ Kast

IFCB is an imaging flow cytometer that collects 5 ml of seawater at a time and images the phytoplankton in the sample. IFCB images anywhere from 10,000 phytoplankon/sample in coastal waters to ~200 in less productive water. Emily is creating a sort of plankton database with all these images. They look fantastic, see below for sample images!

Microzooplankton called Ciliates. Photo Credit: IFCB, from this Henry Bigelow research cruise.
Dinoflagellates Photo Credit: IFCB, from this Henry Bigelow research cruise.
Dinoflagellates
Photo Credit: IFCB, from this Henry Bigelow research cruise.

The IFCB “is a system that uses a combination of video and flow cytometric technology to both capture images of organisms for identification and measure chlorophyll fluorescence associated with each image.  Images can be automatically classified with software, while the measurements of chlorophyll fluorescence make it possible to more efficiently analyze phytoplankton cells by triggering on chlorophyll-containing particles.” (WHOI ICFB 2015). 

What do you enjoy about your work?

I really enjoy looking at the phytoplankton images and identifying and looking for more unusual images that we don’t see as often. I particularly enjoy seeing plankton-plankton interactions and grazing of phytoplankton.

Grazing (all photo examples are not from this research cruise but still from an IFCB):

Small flagellates on a Thallasiosira Photo Credit: MVCO
Small flagellates on a Thallasiosira (Diatom) Photo Credit: IFCB at MVCO
Diatom with a dino eating it from the outside (peduncle).Photo Credit: MVCO
Diatom with a dinoflagellate eating it from the outside using a peduncle (feeding appendage). Photo Credit: IFCB at MVCO
Engulfer- Gyrodinium will engulf itself around the diatom (Paralia consumed by Gyrodinium).Photo Credit: MVCO
Engulfer- Gyrodinium will engulf the diatom Paralia Photo Credit: IFCB at MVCO
Dinoflagellates Pallium feeder- feeding externally, the pallium wraps around the prey.Photo Credit: MVCO
Dinoflagellates pallium feeding externally, the pallium (cape-like structure, think of saran wrap on food) wraps around the prey. Photo Credit: IFCB at MVCO

What type of phytoplankton do you see?

I am seeing a lot of dinoflagellates in the water today (May 20th, 2015), Ceratium specifically.

Ceratium. Photo by IFCB at MVCO

The most common types of plankton I see are: diatoms, dinoflagellates, and microzooplankton like ciliates. The general size range for the phytoplankton I am looking at is 5-200 microns.

Colonial choanoflagellate. Photo Credit: MVCO
Colonial choanoflagellate. Photo Credit: IFCB at MVCO

Where do you do most of your work?

“The Martha’s Vineyard Coastal Observatory (MVCO) is a leading research and engineering facility operated by Woods Hole Oceanographic Institution. The observatory is located at South Beach, Massachusetts and there is a tower in the ocean a mile off the south shore of Martha’s Vineyard where it provides real time and archived coastal oceanographic and meteorological data for researchers, students and the general public.” (MVCO 2015).

Screen Shot 2015-05-20 at 1.54.39 PM
MVCO Photo from: http://www.whoi.edu/mvco

Most of my work with Heidi is at the Martha’s Vineyard Coastal Observatory. IFCB at MVCO has sampled phytoplankton every 20 minutes since 2006 (nearly continuously). This unique data set with high temporal resolution allows for observations not possible with monthly or weekly phytoplankton sampling.

Below is an example from the MVCO from about an hour ago at 1 PM on May 20th, 2015.

Photo Credit: MVCO
Photo Credit: IFCB at MVCO

Did you know??

IFCB at Martha’s Vineyard Coastal Observatory has collected photos of nearby phytoplankton every 20 minutes since 2006 (9 years, almost continuously). With this time series, you can study changes in temporal and seasonal patterns in phytoplankton throughout the years.

Helpful Related links:

Current Plankton at the MVCO:  demi.whoi.edu/mvco

Valerie Bogan: The Journey Ends, June 20, 2012

NOAA Teacher at Sea
Valerie Bogan
Aboard NOAA ship Oregon II
June 7 – 20, 2012

Mission: Southeast Fisheries Science Center Summer Groundfish (SEAMAP) Survey
Geographical area of cruise: Gulf of Mexico
Date
: Wednesday June 20, 2012

Weather Data from the Bridge:
Sea temperature 28  degrees celsius, Air temperature 26.4 degrees celsius.

 Science and Technology Log:

Well we have come to the end of the cruise so now it is time to tie it all the pieces together.  The Gulf of Mexico contains a large ecosystem which is made up of both biotic (living) and abiotic (nonliving) factors.  We studied the abiotic factors using the CTD which records water chemistry data and by recording information on the water depth, water color, water temperature, and weather conditions.  We studied the living portions of the ecosystem by collecting plankton in the bongo and neuston nets.  The health of the plankton depends on the abiotic factors such as water temperature and water clarity so if the abiotic factors are affected by some human input then the plankton will be unhealthy.  The trawl net allowed us to collect some larger organisms which occupy the upper part of the food web.  Some of these organisms eat the plankton while others eat bigger creatures which are also found in the trawl net.  Despite what they eat all of these creatures depend on the health of the levels below them either because those levels are directly their food or because those levels are the food of their food.

The Gulf of Mexico Ecosystem
An illustration of how the food web in the gulf works. (picture from brownmarine.com)

The ecosystem of the Gulf of Mexico has taken a couple of large hits in the recent past, first with Hurricane Katrina and then with the Deepwater horizon oil spill.  When an ecosystem has undergone such major events it is important to monitor the species in order to determine if there is an effect from the disasters.  Hurricane Katrina left its mark on the people of the Gulf coast but did minimal damage to the biotic parts of the ecosystem.  The effects of the deepwater horizon oil spill are still unknown due to the scope of the spill.

Today’s portion of the ship is the engine room.  I was recently taken on a tour of the engine room by William.  The ship is powered by two diesel engines which use approximately 1,000 gallons of fuel per day.  The ship obviously uses the engines to move from location to location but it also uses the energy to power generators which supply electrical energy, to air condition the ship and to make fresh water out of sea water.

The engines.
The twin diesel engines.
Generators
Generators

There are two vital positions on the Oregon II that I have not discussed, deck worker and engineer.  We could never have collected the samples that we did without the immense help of the deck workers.  They operated the winches and cranes that allowed us to deploy and bring back the nets which captured our samples.  The engineers kept the ship’s engines running, the electricity on, and the rooms cool.  Some of these men started out their careers as merchant marines.  A merchant marine is a person who works on a civilian-owned merchant vessel such as a deep-sea merchant ship, tug boat, ferry or dredge.  There are a variety of jobs on these ships so if you are interested in this line of work I’m sure you could find something to do as a career.  A few merchant marines work as captains of those civilian ships, guiding the ship and commanding the crew in order the get the job done.  More of them serve as mates, which are assistants to the captains.  These people are in training to one day become a captain of their own ship.  Just like on the Oregon II there are also engineers and deck workers in the merchant marines.  Engineers are expected to keep the machinery running while the deck workers do the heavy lifting on the deck and keep the ship in good condition by performing general maintenance.

During this cruise I have met a lot of people who have different jobs all of which are related to collecting scientific data.  The bridge is wonderfully staffed by members of the NOAA Corps.  These men and women train hard to be able to sail research ships around the world.  To find out more about a profession with the NOAA Corps go visit the Corps’ webpage.  There are a large number of scientists on board.  These scientists all specialize in the marine environment and there are many wonderful universities which offer degrees for this field of study.  Go here to get some more information on this scientific pursuit.  The engineers and deck crew keep the ship running. To learn about these professions go to The United States Merchant Marines Academy.  The stewards are instrumental in keeping the crew going on a daily basis by providing good healthy meals.  To learn more about working as a steward read about the Navy culinary school.  The ship could not continue to operate without each of these workers.  Nobody is more or less important than the next–they survive as a group and if they cannot work together the ship stops operating.

Personal Log

Well my journey has come to an end and it is bitter-sweet.  While I’m happy to be back on land, I’m sad to say goodbye to all of the wonderful people on the Oregon II.  When I was starting this adventure I thought two weeks was going to be a long time to be at sea, yet it went by so fast.  Although I’m tired, my sleep and eating schedule are all messed up, and I have some wicked bruises, I would do it again.  I had a great time and in a couple of years I have a feeling I will be once again applying for the Teacher at Sea Program.

It should be no surprise to those that know me best that I love animals which is why I volunteer at the zoo and travel to distant locations to see animals in the wild.  So my favorite part of the trip was seeing all the animals, both those that came out of the sea and those that flew to our deck.  So I’m going to end with a slide show of some amazing animals.

Pelican.
This pelican decided to stop and visit with us for a while.
angel shark
An angel shark
Moray eel
A moray eel
Bat fish
Two bat fishes of very different sizes.
Sand dollar
A sand dollar
Hitchhikers
A group of sea birds decide to hitch a ride for a while.

Cathrine Fox: Issue Twelve: Better than any alarm clock

NOAA TEACHER AT SEA
CATHRINE PRENOT FOX
ONBOARD NOAA SHIP OSCAR DYSON
JULY 24 – AUGUST 14, 2011


Mission: Walleye Pollock Survey
Location: Kodiak, Alaska
Date: August 11, 2011

Weather Data from the Bridge
Latitude: 57deg 22.630N, Longitude: 152.02° W
Air Temperature: 13.6° C
Water temperature: 9.0° C
Wind Speed/Direction: 12kn/240°
Barometric Pressure: 1020.1
Partly cloudy (5%) and sun

Science Log:

Stern of the Oscar Dyson

Somewhere back in my family history there must have been a fishmonger, because I’ve been channeling something or someone. The entire process of watching the acoustic footprint of the ocean under the ship, deciding where to physically sample (trawl) populations, and then seeing and processing the fish that live 100 meters or more below us? Fascinating. Add to this camera drops to get snapshots of the ocean floor (more amazing footage this morning), and interesting ‘Methot’ plankton tows to sample what is available for the fish to eat and give a more accurate and complete picture? How many adjectives can I use?

Before we dive too far into the depths, let me explain/refresh what plankton are. Plankton are any drifting organisms that inhabit the water columns of bodies of water. In fact, their name derives from the Greek for “wanderer,” and it would be helpful if you thought of them as drifters in the current…from deep in the ocean to up on the surface. They are generally broken down into plant-like-photosynthesizing plankton (phytoplankton) and animal-like plankton (zooplankton).
Phytoplankton are “photosynthesizing microscopic organisms that inhabit the upper sunlit layer of almost alloceans and bodies of water” (wikipedia). If you have taken biology or forensics with me, I have described some of them ad nauseam: diatoms? Those organisms that are in every body of water on the planet? Ah, yes. I can see it all coming back to you.
https://i0.wp.com/desalalternatives.org/wp-content/uploads/2010/10/zooplankton.jpg?resize=400%2C237
http://desalalternatives.org/wp-content/uploads/2010/10/zooplankton.jpg

Zooplankton encompass a diverse range of macro and microscopic animals. They generally eat the phytoplankton or one another. Examples include krill, copepods, jellyfish, and amphipods.

In the great food web of life, other organisms eat the zooplankton. Among them was a pod of 50+ Humpback whales in the Barnabas Trough off of Kodiak Island. They were exciting enough that I went from being sound asleep to dressed and on the bridge in less than five minutes. Issue 12, Humpback Whales: Better than any alarm clock I have ever known delves into these organisms (Cartoon citations 1, 2, 3 and 4).


Our chief survey technician, Kathy Hough, took a lot of photos the following day as we traveled from Barnabas Trough to Alitak Bay. The three photos that follow and descriptions are courtesy of Kathy.

Adventures in a Blue World, Issue 12


Whale tail: Individual humpback whales can be identified by the black/white pattern on the ventral side of the fluke (tail).  The pattern is like a human's fingerprint, unique to one animal.
Whale tail: Individual humpback whales can be identified by the black/white pattern on the ventral side of the fluke (tail). The pattern is like a human’s fingerprint, unique to one animal.
There is evidence of three whales in the photo above: the closest whale's rostrum (blow hole) is visible.  The second whale is diving and you can see the peduncle (the stocky part of the tail before the fluke).  The glassy area in the back of the photo is evidence of a recent dive and is called a "footprint."
There is evidence of three whales in the photo above: the closest whale’s rostrum (blow hole) is visible. The second whale is diving and you can see the peduncle (the stocky part of the tail before the fluke). The glassy area in the back of the photo is evidence of a recent dive and is called a “footprint.”
This Humpback was last seen in this area in 2004, and has not been seen since.  The white marks on its fluke are from a killer whale attack!  Kathy emailled photos of the whales to observers, and they were able to identify individuals!
This Humpback was last seen in this area in 2004, and has not been seen since. The white marks on its fluke are from a killer whale attack! Kathy emailled photos of the whales to observers, and they were able to identify individuals!
All hands on deck... 100+ Humpback Whales.  Darin and Staci.
All hands on deck… 100+ Humpback Whales. Darin and Staci.

Our team of scientists sample plankton using a Methot net, which is fine mesh and captures macroscopic organisms. We sample plankton for the same reason that we physically trawl for fish: we need to make certain what we are “hearing” is what is down there, with a focus on the types and sizes of the plankton. Additionally, knowledge about what and where plankton populations are will help with modeling the entire ecosystem. If you know where the food lives, its abundance and composition, by extension you have a much greater understanding of the predators, both pollock and whale.

(If you get a chance, check out this video about how whales hunt with bubble nets; fascinating!)

Personal Log

Bowditch
Bowditch

I try to spend time on the bridge every morning before breakfast. I bring up a cup of tea and watch the horizon lighten until the sun pushes its way up above the lingering clouds. This morning, I saw the green flash for the first time. The green flash is not a superhero. It is not a myth. It is not a sailor’s fish tail. It is real. Furthermore, if you still don’t believe me, the green flash is in the “bible” of maritime studies, The American Practical Navigator (Bowditch, if you are on a first name basis). I was told by Ensign David Rodziewiczthat “if it is in Bowditch, it must be true.” So there.

The green flash appears on the horizon just after the sun sets or just before it rises. For one moment on that spot the sky looks as if someone broke a green glow stick and smeared a distant florescent mark. As fast as it was there, it is gone. The name is appropriate: green flash. It occurs because light is bent slightly as it passes through the atmosphere (refraction); this bending is greatest on the horizon. Since light is made up of different colors with different wavelengths, the bending causes the colors to be seen separately. Bowditch says it is like offset color printing (nice metaphor, eh?). The red end of the spectrum is first to rise. The blue end of the spectrum is scattered the most by the atmosphere, leaving behind the momentary and memorable second of green.

Evidently, to see the green flash is considered very good luck. I already feel very lucky. I am in one of the most beautiful places in the world, on a ship with interesting and intelligent people, driving around the Gulf of Alaska learning about science and occasionally checking out whales. If I can get luckier than this… well… wow.

Tomorrow is the last day of our cruise, but I have a few more cartoons up my sleeves, so keep checking back. In the meantime, thank you to the incredible staff of the Oscar Dyson, the scientists of MACE, my rockin’ cohort Staci, and the NOAA Teacher at Sea program.

Until our next adventure,
Cat

p.s. Whales have the worst morning breath I have ever smelled. I know it isn’t really their fault–imagine having 270-400 baleen sheets on either side of your mouth that you could get krill stuck in…

Take it to the Bridge...
Take it to the Bridge…
Oscar Dyson, me mateys.

Barbara Koch, October 5, 2010

NOAA Teacher at Sea Barbara Koch
NOAA Ship Henry B. Bigelow
September 20-October 5, 2010

Mission: Autumn Bottom Trawl Survey Leg II
Geographical area of cruise: Southern New England
Date: Tuesday, October 5, 2010

Weather from the Bridge
Latitude 40.63
Longitude -72.92
Speed 4.80 kts
Course 293.00
Wind Speed 19.13 kts
Wind Dir. 139.69 º
Surf. Water Temp. 18.76 ºC
Surf. Water Sal. 31.62 PSU
Air Temperature 16.20 ºC
Relative Humidity 89.00%
Barometric Pres. 101.44 mb
Water Depth 28.52 m
Cruise Start Date 10/2/2010

Science and Technology Log

In addition to collecting data about fish species in the Southern New England Atlantic Ocean, NOAA Ship Henry B. Bigelow is also collecting information about the ocean’s climate and plankton numbers. lankton refers to microscopic plants (phytoplankton), animals (zooplankton), decomposers (bacterioplankton), and the fish eggs and larvae of larger fish (ichthyoplankton). Plankton forms the base of the ocean food web. Phytoplankton is the food source for zooplankton, which in turn is the food source for larger fish. Water salinity and termperature (climate) are directly related to the production of plankton. A change in climate can cause a decrease in the production of plankton, therefore, less food for developing fish species. Low numbers of fish at the bottom of the food web means less food for fish at the top of the food web.

Reviewing Data
Reviewing Data

Plankton samples are taken at random trawl stations during the cruise. I had the opportunity to observe and assist the Senior Survey Technician, Jim Burkitt, during one sampling. Burkitt uses a Bongo Paired Zooplankton net system, which consists of two stainless steel cylinders with instruments that measure water flow, and two cone-shaped, fine mesh nets attached. The nets are lowered into the ocean and dragged alongside the ship for a specified amount of time, and at all levels of the ocean column. Burkitt monitors the location of the nets via computer during the sampling to ensure that the nets do not touch the ocean floor, thus gathering sediment instead of plankton.

Sampling
Sampling

Retrieving the nets
Retrieving the nets

The crew retrieves the nets at the end of the sampling period and places it on the deck of the ship. Once the nets are back on deck, we rinse the plankton from the top to the narrow, tied end of the nets byspraying the nets from the top towards the bottom.

Rinsing the plankton

Plankton
Plankton
Finished Sample
Finished Sample

When the catch is located at the bottom of the nets, we untiethe bottom and continue rinsing the sample into metal strainers. The top strainer has a large mesh screen to trap jelly fish and other organisms trapped in the net and to allow the smaller plankton to fall through to the lower strainer, which has a very small mesh screen used to collect the plankton sample. Here is what the sample looked like.

Finally, we carry the samples into the lab where we rinse the plankton into jars, add formaldehyde as a preservative, and seal the jars. The jars will be taken to the lab in Woods Hole for further analysis.

Personal Log

Northern Stargazer
Northern Stargazer
Armored Searobin
Armored Searobin

Even though many of our towing days were lost to gale force winds, we did end the cruise by catching some interesting species. First, was the Northern Stargazer (Astroscopus guttatus). The Northern Stargazer is found in shallow waters along the eastern seaboard from North Carolina to New York. It has a large head, small eyes on top of its head, and a large upward turned mouth. The Northern Stargazer buries itself in the sand on the ocean floor and waits for prey to swim by. Northern Stargazers also have an electrical organ around the eyes that can give us a jolt if we touch it.

Another interesting catch was the Armored Searobin (Peristedion miniatum). This species is bright crimson and is totally covered with bony plates. It can grow to be 13-14 inches long. It is found in the warm waters along the outer edge of the continental shelf in waters from Georges Bank off of Cape Cod, Massachusetts all the way down the Atlantic to Charleston, South Carolina.

Monkfish
Monkfish

We also caught Monkfish or Goosefish (Lophius americanus). This fish is found along the eastern seaboard of the United States from Grand Bank down to Cape Hatteras, North Carolina. Monkfish live on the bottom of the ocean in sand, mud and shell habitats, and feed on whatever prey is abundant. The meat is said to taste a lot like lobster tail, and therefore is often referred to as “poor man’s lobster.”

striped sea bass
striped sea bass
More striped sea bass

Our most exciting catch came when we hauled in 212 striped sea bass! Striped bass occur along the Atlantic coast from the St. Lawrence River in Canada all the way down to Florida. They live near the coast, in bays and tidal rivers. Striped bass have been very important to the United States fishing industry for centuries. The largest one we caught was 103 cm long and weighed 11.26 kg!

I thoroughly enjoyed my time working and learning during the second leg of the Autumn Bottom Trawl Survey cruise. It was a great opportunity to see research at work in a real world setting, and I’m sure my students will benefit from everything I’ve experienced. I want to thank the scientists from the Northeast Fisheries Science Center (NEFSC), the NOAA Teacher at Sea Program, and the crew aboard NOAA Ship Henry B. Bigelow for allowing me to be a part of your lives for twelve days. If any of you teachers out there are interested in applying to the Teacher at Sea Program, I highly recommend it. Check out their website at http://teacheratsea.noaa.gov/.

Natalie Macke, August 28, 2010

NOAA Teacher at Sea: Natalie Macke
NOAA Ship: Oscar Dyson

Mission:  BASIS Survey
Geographical area of cruise: Bering Sea
Date: 8/28/2010
It’s Fish Feeding Time…
Weather Data from the Bridge :
Visibility :  <0.5 nautical miles  (Wondering what a nautical mile is??)
Wind Direction: From the W at 20 knots
Sea wave height: 2-3ft
Swell waves: WSW, 4ft
Sea temp:9.1 oC
Sea level pressure: 1013.0 mb
Air temp: 9.7 oC
Science and Technology Log:
Euphausiid Specimens (zooplankton)

We’re up to station #40 now and everyone certainly has their routine down.  One type of sampling I have yet to cover is the microscopic life; the base of the food web.  A look at the marine fisheries food web quickly reveals that in order to support the commercial fisheries as well as the vast number of marine mammals and ocean birds, there must be an abundance of phytoplankton and zooplankton available in the Bering Sea.  Evidence of this food chain is demonstrated by dissecting the stomach of a salmon.  The sample (in the picture below) revealed that the salmon had recently dined on euphaussids (commonly known as krill).   Before getting into how the zooplankton samples are collected, first let me go back and touch on the base of the food web; phytoplankton.  These samples are collected from the Niskin bottles on the CTD each cast.  The samples are preserved with formalin and will be brought back to the lab for further analysis.  Now, back to the critters..

Dissecting a salmon stomach

At every sampling station on the side deck and immediately after each CTD cast, zooplankton net tows are completed.  There are three different tows being used for the BASIS survey. The first two are vertical tows where nets that are weighted are dropped to the seafloor and then brought back to the surface thus sampling a vertical water column. The pairovet, named from the fact that is was designed as a “pair of vertical egg tows” (designed to collect pelagic egg samples) has a netting mesh size of 150 microns.  The net is simply deployed with a weight on the bottom.  When it reaches the deepest part of the water column it is brought back to the surface collecting its’ sample.  Another similar net with a 168 micron mesh size is named the Juday.  Once either of these nets is brought to the deck, it is washed down and anything caught is captured in the cod end (the name for the PVC bucket at the bottom of the net).

Cod end for Bongo
Deploying the Bongo nets off the starboard side

The last type of tow that is completed for the BASIS survey uses the Bongo nets.  This tow is considered an oblique tow since the nets essentially are lowered to about 5m from the ocean bottom and towed for a certain length of time.  If you remember from the acoustics, in daylight hours the zooplankton migrate to the ocean bottom to hide from their prey.  Since our sampling is done in daylight hours, the deep sampling depth is where we expect to find the highest density of zooplankton sample.  The mesh sizes on the two nets of the Bongo are 335 and 505 microns.  This allows for sampling of zooplankton of different sizes.   The samples are collected on board and then taken back to the lab for analysis.  They are separated by species, counted and weighed.  Biomass and species composition is determined for each sample.  The majority of the zooplankton we have seen this cruise have been euphaussids and copepods of varying types.

Oh where, oh where does the Internet go??

So as August winds down and the school year gears up, my connection to the Internet is becoming more and more important.  Since my Oceanography class is with the Virtual High School, I have to essentially set up my virtual classroom in these upcoming days.  I’ll assume my esteemed colleagues will assist me in unpacking lab equipment back at home at my physical classroom. (Even though I know.. all my orders will mysteriously wind up in other labs, I’m assured they’ll be safely placed away.)

So I tracked down Vince Welton, our Electronic’s Technician for some help understanding why sometimes I can surf, and why sometimes I can’t….

Simple…

Our Internet connection is via the geostationary satellite GE 23 at 172 degrees East. This satellite transmits over most of the Pacific Ocean (see a coverage map).  Since this satellite is positioned on the equator, that means our receiver must look essentially due south for a signal.  When our ship is northbound, the mast and stack of the Oscar Dyson simply gets in the way.  Therefore… no Internet on northbound travels.

The Oscar Dyson also has access to two Iridium satellites for communication as well as the GE 23.   These are the SAT-B which can transmit both data and voice communications and the VSAT which only allows voice transmission.  The ship can access this set of orbiting satellites when the GE 23 is unavailable due to course of travel or weather conditions.

  Personal Log
Jeanette videotaping

Yesterday, I got permission to stay on the trawl deck during one of our station trawls.  It was fun to be outside down with the net.  Jeanette helped do some taping which I hope to(during a few Internet-less days ahead) compile to a video for my classes.  Of course as fate would have it, our catch for the day (shown below) was not one for the record books or even worth remembering at all..  I guess that’s what the editing process is for hmmm…

Today’s catch

In the Oceanography lab, we have started our primary productivity experiments and chlorophyll analysis so learning these new procedures has been interesting and given me lots of ideas for some research topics for Edelberg’s class.  All in all, I am enjoying watching, learning and doing science here in eastern Bering Sea.  One week left..

Justin Czarka, August 15, 2009

NOAA Teacher at Sea
Justin Czarka
Onboard NOAA Ship McArthur II (tracker)
August 10 – 19, 2009 

Mission: Hydrographic and Plankton Survey
Geographical area of cruise: North Pacific Ocean from San Francisco, CA to Seattle, WA
Date: August 15, 2009

Weather data from the Bridge

This picture shows what happens to an 8 fluid ounce Styrofoam cup after experience water pressure at 1000 meters down. The colorful cup was sent down attached to the CTD

Sunrise: 6:29 a.m.
Sunset: 20:33 (8:33 p.m.)
Weather: patchy mist
Sky: partly to mostly cloudy
Wind direction and speed: north-northwest 15-20 knots (kt), gust to 25 kt
Visibility: unrestricted to 1-3 nautical miles in mist
Waves: northwest 6-9 feet
Air Temperature: 18°C high, 12°C low
Water Temperature: 17.5°C

Science and Technology Log 

Today we made it out to 200 miles off the Oregon Coast; the farthest out we will go. The depth of the ocean is 2867 meters (9,406 feet).  It is pretty interesting to imagine that we are on the summit of a nearly 10,000-foot mountain right now!  Last night the CTD was deployed 1,000 meters (3,281 feet).  Even at this depth, the pressure is immense (see photo, page one). When taking the CTD down to this depth, certain sensors are removed from the rosette (the white frame to which the CTD instruments are attached) to prevent them from being damaged.

Justin Czarka taking observational notes while aboard the McArthur II.  These notes preserve the knowledge gained from the NOAA officers and crew, as well as the researchers
Justin Czarka taking observational notes while aboard the McArthur II. These notes preserve the knowledge gained from the NOAA officers and crew, as well as the researchers

The crew aboard the McArthur II is such an informative group. Many possess a strong insight into NOAA’s research mission.  Today I spoke with Kevin Lackey, Deck Utility man.  He spoke to me about the cruises he has been on with NOAA, particularly about the effects of bioaccumulation that have been studied.  Bioaccumulation is when an organism intakes a substance, oftentimes from a food source, that deposits in the organism at increasing levels over time.  While sometimes an intentional response from an organism, with regards to toxins, this bioaccumulation can lead to detrimental effects.  For example, an organism (animal or plant) A on the food web experiences bioaccumulation of a toxin over time.  Imagine organism B targeting organism A as a food source. Organism B will accumulate concentrated levels of the toxin. Then, when organism B becomes a food source for organism C, the effects of the toxins are further magnified.  This has serious effects on the ocean ecosystem, and consequently on the human population, who rely on the ocean as a food source.

While aboard the McArthur II, Morgaine McKibben, a graduate student at Oregon State University (OSU), shared with me her research into harmful algal blooms (HABs), which potentially lead to bioaccumulation.  Certain algae (small plants) accumulate toxins that can be harmful, especially during a “bloom.” She is collecting water samples from the CTD, as well as deploying a HAB net, which skims the ocean surface while the ship is moving to collect algae samples.  She is utilizing the data in order to create a model to solve the problem of what underlying conditions cause the algae blooms to become toxic, since they are not always as such.

Personal Log 

Sunset over the Pacific Ocean from the flying bridge off the coast of Heceta Head, Oregon (N 43°59, W 124°35) a half hour later than two nights ago!

The weather has cleared up allowing grand ocean vistas—a 360° panorama of various blues depending on depth, nutrients, clouds overhead, and so forth.  At first glance, it just looks blue.  But as you gaze out, you see variance. A little green here, some whitecaps over there. As the ship moves on, the colors change. Wildlife appears, whether it is a flock of birds, kelp floating by, or an escort of pacific white-sided dolphins. I wondered if the ocean would become monotonous over the course of the eleven days at sea.  Yet the opposite has happened. I have become more fascinated with this blue water.

It was interesting today to notice how we went back in time.  Two nights ago the sun had set at 20:03 (8:03 p.m.)  But because we went so far out to sea, last night the sunset had changed to 20:33 (8:33 p.m.).  While this happens on land as well, it never occurred to me in such striking details until out to see.

Animals Seen from the Flying Bridge (highest deck on the ship) 

  • Rhinoceros Auklet – closely related to puffins
  • Whale (breaching)
  • Common Murres
  • Western Gull
  • Hybrid Gull – We are at a location off the coast of Oregon where different species interbreed
  • Leech’s Storm Petrel – Mike Force, the cruise’s bird and marine mammal observer, found the bird aboard the ship by in an overflow tank.  It will be rereleased.

Did You Know? 

NOAA has a web page with information especially for students?

Kathryn Lanouette, July 28, 2009

NOAA Teacher at Sea
Kathryn Lanouette
Onboard NOAA Ship Oscar Dyson
July 21-August 7, 2009 

Here I am sorting different zooplankton species

Mission: Summer Pollock Survey
Geographical area of cruise: Bering Sea, Alaska
Date: July 28, 2009

Weather Data from the Ship’s Bridge 
Visibility: 8 nautical miles
Wind direction:  015 degrees (N, NE)
Wind speed:  7 knots
Sea wave height: 1 foot
Air temperature: 7.6˚C
Seawater temperature: 7.3˚C
Sea level pressure: 29.8 inches Hg and falling
Cloud cover: 8/8, stratus

Science and Technology Log 

In addition to studying walleye pollock, NOAA scientists are also interested in learning about the really tiny plants (phytoplankton) and animals (zooplankton) that live in the Bering Sea.  Plankton is of interest for a two reasons. First, phytoplankton are the backbone of the entire marine food chain. Almost all life in the ocean is directly or indirectly dependent on it. By converting the sun’s energy into food, phytoplankton are the building blocks of the entire marine food web, becoming the food for zooplankton which in turn feed bigger animals like small fish, crustaceans, and marine mammals. Second, zooplankton and small fish are the primary food source for walleye pollock. By collecting, measuring, and weighing these tiny animals, scientists are able to learn more about the food available to walleye pollock. In addition, every time the scientists trawl for walleye pollock, the stomachs of 20 fish are cut out and preserved. Back at a NOAA lab in Seattle, the contents of these fish stomachs will be analyzed, giving scientists a direct connection between walleye pollocks’ diet and specific zooplankton populations found throughout the Bering Sea.

A simplified marine food chain  (Note: A complete marine food web involves hundreds of different species.)
A simplified marine food chain (Note: A complete marine food web involves hundreds of different species.)

Two important zooplankton groups in the Bering Sea are copepods and euphausiids (commonly referred to as krill). Euphausiids are larger and form thick layers in the water column. In order to catch euphausiids and other zooplankton of a similar size, a special net called a Methot is lowered into the water. This fine meshed net is capable of catching animals as small as 1 millimeter. The same sonar generated images that show walleye pollock swimming below the water’s surface are also capable of showing layers of zooplankton. Using these images, the scientists and fishermen work together, lowering the net into the zooplankton layers.

The Methot net is the square shaped net in the background. It was just brought up and is filled with hundreds of zooplankton.

Once the Methot net is back onboard the boat, its contents are poured through fine sieves and rinsed. All species are identified. A smaller sub sample is weighed and counted. This information is applied to the entire catch so if there were 80 krill, 15 jellyfish, and 5 larval fish in a sub sample, then scientists would approximate that 80% of the entire catch was krill, 15% was jellyfish, and 5% was larval fish. Having only seen photos of some of these zooplanktons, it was interesting to hold them in my hands and look at them up close. They seemed better suited for space travel or a science fiction movie than the Bering Sea!

Personal Log 

The day before, I caught my first glimpse of Dall’s porpoises. This pod of porpoises came swimming alongside the boat. It was awesome to see their bodies rise and fall in the water. I was surprised at how quickly they were swimming, darting in and out of the Oscar Dyson’s wake. Today, I also got my first glimpse of a whale! It was a fin whale, a type of baleen whale, about 20 meters from the boat. It was exciting to watch such a large mammal swimming in such a vast expanse of water. I’m hoping to see a few more marine mammal species before we return to port. The seas have been very calm for the last five days, at times as smooth as a mirror. I’m surprised that I’ve gotten used to falling asleep in the early morning hours and waking around midday. Now that I’ve adjusted to the 4pm to 4am shift, I’m wondering how strange it will be to return to my regular schedule back on the east coast.

Answer to July 25th Question of the Day: Why are only some jellyfish species capable of stinging? 
As I picked up my first jellyfish in the wet lab (asking at least twice “Are you sure this won’t sting?”), I wondered why some jellyfish don’t sting.  So I did some reading and asked some of the scientists a few questions. Here is what I found out: All jellyfish (called “gelatinous animals” in the scientific world) have stinging cells (nematocysts) in their bodies. When a nematocyst is touched, a tiny barb inside fires out, injecting toxin into its prey.  It seems that in some jellyfish, the barbs are either too small to pierce human skin or that nematocysts don’t fire when in contact with human skin.

One euphausiid and two different species of hyperiid amphipod (They are between 1-3 cm long)
One euphausiid and two different species of hyperiid amphipod

Animals Seen 
Capelin, Dall’s porpoise, Euphausiid, Fin whale, Hyperiid amphipod, and Slaty-backed gull.

New Vocabulary: Baleen whale – a whale that has plates of baleen in the mouth for straining plankton from the water (includes rorqual, humpback, right, and gray whales). Methot net – a square framed, small meshed net used to sample larval fish and zooplankton. Phytoplankton – plankton consisting of microscopic plants. Plankton – small and microscopic plants and animals drifting or floating in the sea or fresh water. Trawl – to fish by dragging a net behind a boat. Zooplankton – plankton consisting of small animals and the immature stages of larger animals

Question of the Day: How has the walleye pollock biomass changed over time?


Elise Olivieri, May 17, 2009

NOAA Teacher at Sea
Elise Olivieri
Onboard Research Vessel Hugh R. Sharp 
May 9 – 20, 2009 

Mission: Sea Scallop Survey
Geographical area of cruise: Northwest Atlantic
Date: May 17, 2009

Weather Data from the Bridge 
Air Temperature: 13.61 Degrees Celsius
Barometric Pressure: 1012 mb
Humidity: 97 %

Here you can see the many different sizes of sea scallops.

Science and Technology Log 

So Far the sea scallop survey has collected 76,170 sea scallops which can also be expressed as 9,251 kilograms.  This is a tremendous amount of scallops and the survey is not even a third of the way complete.  At stations where crabs and starfish were sampled we have collected 8,678 cancer crabs and 279,768 starfish (Asterias) so far. Without a reliable database like FSCS it would be impossible to keep up with such a large amount of information.

Today I got a chance to talk with Shad Mahlum.  He is a seagoing technician for NOAA and was born and raised in Montana. He has experience working with freshwater surveys.  In the past years he has studied how beaver dams influence native and non-native species of freshwater fish.  Shad also spent some time looking at various cattle grazing strategies and how they affect food chains. Shad loves working on the open ocean and the physical process of sea scallop surveys.  Shad hopes to work with freshwater and saltwater projects in the future.

Here I am holding a scallop and a Red Hake.

As I was gazing out into the deep blue sea a very large animal caught my eye.  I was so excited to see another Finback Whale.  They are the second largest animal on earth after the Blue Whale.  They are known to grow to more than 85 feet. Finbacks are indifferent to boats. They neither approach them nor avoid them.  Finback Whales dive to depths of at least 755 feet. They can grow anywhere from 30-80 tons. Finbacks eat Krill, fish and squid and their population numbers are approximately 100,000 or more.  The only threats Finbacks have are polluted waters.  It is incredible to see such a large animal breaching out of the water.  I will never forget it.

Animals Seen Today 

Wrymouth Squid, Eelgrass Slug, Razor Clam, Lobsters, Green Sea Urchin, Macoma clam, Sea Stars (Asterias), Horseshoe Crab, Fourbeard Rockling, Palmate Sponge, Hermit Crab, Black Clam, Golden Star, Tunicate, Winter Flounder, Surf Clam, Yellowtail Flounder, and Sea Mouse. 

Methea Sapp-Cassanego, July 21, 2007

NOAA Teacher at Sea
Methea Sapp-Cassanego
Onboard NOAA Ship Delaware II
July 19 – August 8, 2007

Mission: Marine Mammal Survey
Geographical Area: New England
Date: July 21, 2007

Weather Data from Bridge 
Visibility: 7nm
Wind Direction: West-northwest
Wind Speed: 5-10 mph
Swell height: 6 to 8 feet

Peter Duley stands with the vertical profiling package, which is the property of Dr. Mark Baumgartner, Woods Hole Oceanographic Institution.

Science and Technology Log 

Yesterday and today were spent traveling down 3 transect lines. Each transect line is a total of 18 miles long and sits 5 miles apart from its neighboring transect. The 3 transects are further divided into stations so that each transect contains 6 stations which are evenly spaced by three miles. The boats captain and crew ensure that the boat is correctly positioned according to the transects and stations. Upon arrival at a given station the bridge radios the dry lab and preparations begin in order to launch an instrument called a vertical profiling package.  The vertical profiling system on board the DELAWARE II is the property of Dr. Mark Baumgartner of the Woods Hole Oceanographic Institution and is operated by Melissa Patrician, Oceanographic Technician at Woods Hole Oceanographic Institution.

This trio of instruments is bolted to the inner rim of a round aluminum cage that helps protect the sensitive instruments and allows multiple instruments to be lowered in one convenient package. Three instruments are on this particular cage: One is a conductivity, temperature, depth (CTD) sensor which also happens to measure phytoplankton concentrations via a fluorometer. The second implement is an optical plankton counter (OPC). This instrument functions by projecting a beam of light against a sensor plate.  When particles (marine snow, copepods, krill, or other types of plankton) pass in front of the sensor plate they block the beam of light and are thus recorded by a remote computer. The computer software then enables the scientist to sort these light-interrupting events by particle size. The third instrument is a video plankton recorder (VPR), which may take as many as 30,000 photo frames per sample. The resulting images help to give researchers a visual confirmation as to the various life forms inhabiting the water column.

After each instrument has been checked and is in sync with its perspective computer the vertical profiling package is lowered from the deck via a motorized cable. The instruments are lowered to within a meter of the seafloor and then are immediately lifted back to the surface. During the down-and-back journey all points of data collected by the 3 instruments are loaded onto three computers for later analysis.

Researchers hope that by sampling the water column they can gain a better understanding of the biotic and abiotic factors that affect copepods and their distributions. Copepods are of particular interest as they are a primary food source for a multitude of marine animals from fish fry to whales.

Vince Rosato and Kim Pratt, March 22, 2006

NOAA Teacher at Sea
Vince Rosato & Kim Pratt
Onboard NOAA Ship Ronald H. Brown
March 9 – 28, 2006

Mission: Collect oceanographic and climate modeling data
Geographical Area: Barbados, West Indies
Date: March 22, 2006

Preparing the sounder

Science and Technology Log: The Echo Sounder

For the past few days, we’ve been transiting back and forth picking up (recovering) and launching (deploying) a special kind of buoy called an Inverted Echo Sounder (IES).  This buoy is attached to a weight and sinks to the bottom of the ocean.  There it sends out a sound pulse to the surface and measures the travel time of that pulse to hit the surface and return to the unit on the bottom of the ocean. Using the travel time of the sound, scientists use it with a historical profile of the water to estimate temperature and salinity of the water. They obtain the historical profile by doing repeated CTD casts and especially the cast before deploying the IES. Sound speed is proportional to salinity/density and scientists use the density and temperature estimations to identify water mass and current movement.  Remember, these currents are moving all over the world! The buoy we deployed also had a current sensor as well as a pressure and temperature sensor.  When scientists are ready to get the information from the buoy, they travel to the site of the buoy, and park the ship right on top of it, and the buoy sends the information to them.

The buoy at night.
The buoy at night.

The buoys stay down in the bottom of the ocean sometimes as long as 6 to 7 years but usually they’re picked up after 5 years. They cost between $25,000 and $45,000 each! When scientists are ready to pick up the buoy, they send a signal that tells the buoy to detach from the weight holding it down and then it floats to the surface attached to a large yellow float. At night, it sends a strobe light flashing across the water so it can be easily found. Also in the past week, all the Styrofoam cups that have been decorated by students at Cabello, Searles Elementary, Key Biscayne Community School, and members of the crew of the RON BROWN were lowered into the ocean at about 5000 meters, or a little more than 3 miles below sea level.  The effect of pressure can be as great as 70,500 pounds of pressure! This rids the cups of all the air and shrinks them to 75% of their original size. It’s sort of like when you dive into a swimming pool, and while going down you feel your ears get tight— that is the effect of pressure.

The buoy deployed
The buoy deployed

Finally, although we’ve been out to sea for over two weeks, we’ve seen very little wildlife.  We’ve seen pilot whales, two or three squid, flying fish and some little fish called Ballyhoo that dance on top of the water with a long snout.  They look like mini swordfish.  The reason we haven’t seen much wildlife is that there is very little life in the middle of the ocean.  In fact, if you look at the middle of the ocean from space, it almost looks purple because there is no phytoplankton, (green plant material that is the base of the food chain). You’ll find life near the coasts or in the North Atlantic because all animals need nutrients to live and you need currents or up welling to move the nutrients around to feed the phytoplankton (plants) which feed the zooplankton (little animals), which feed the fish, which feed the dolphins, which feed the sharks!  This is an example of the food chain.


The cups before pressure…

Interview with Chris Churylo – Chief Electronics Technician 

An important person on any cruise is the Chief Electronics Technician or Chief ET as they are called. Their main job is to make sure that all the electronics are working – that means sonar, networks, navigation, radio and all the things that keep the ship going to where it needs to go, and people talking to whom they need to talk.  On board the RON BROWN, the Chief ET is Chris Churylo. Chris is multi-talented—not only is he a Chief ET, he’s also a Licensed Practical Nurse, an Emergency Medical Technician, a truck driver, a fireman, a pilot, has a real estate license and is a Notary. Chris likes working on the RON BROWN because he works two months on and gets two months off. While he’s at sea and not working, he likes to play chess, learn guitar and work out in the gym.  During his off-time he likes to fly his plane, a Cessna 150, explore local places and hang out with his girlfriend of 18 years.  Chris, who grew up in Philadelphia now calls a farm in West Virginia his home.  During his career he has traveled all over the world, notably to the South Pole and Barrow Alaska during his 20 years of government service.  Chris’s attitude on board the RON BROWN is contagious.  He is a happy spirit, energetic and genuinely likes what he does.

Assignment:  In your logs, illustrate the effect of pressure.  Step one – Draw your decorated Styrofoam cup at the surface.  Step two – draw it on the CTD in a bag ready to go to the bottom of the ocean.  Step three – draw it now 2/3 smaller than when it started.

…and the cups after pressure!

Personal Log – Kimberly Pratt 

Yesterday was a quiet day.  We headed back to Marsh Harbor, Bahamas so the science staff had most of the day off with CTD casts in the evening.  I got to do some reading about Great White Sharks off the Farallones Islands – outside of San Francisco Bay.  One of the main researchers in the book is Peter Pyle, who I sailed with last year on the MCARTHUR II. I’ve really met some great people being a Teacher at Sea.  This trip feels like it is winding down with less than a week to go.  The weather is still beautiful.  Sorry to hear about all the rain and hail back home.  Keep writing I love hearing from you all.

Personal Log – Vince Rosato 

Sad news came on three fronts today.  First, a crewmember heard by ship’s phone of a tragedy in the family and had to be brought to shore to catch a plane back home.  If you noticed the ship tracker had us going back and forth from Abaco Island, one of those trips was to bring a crewmate ashore.  Second, I heard from my home that a neighbor friend had a stroke and is under observation in the hospital.  And third, from my school, a teacher friend is taking the rest of the year off for health reasons.  Those things drained my energy. Work doesn’t stop whether we are happy or sad, so I continued becoming proficient at salinity analysis.  If counting time, however, I spent most of the day replying to your wonderful emails and working on logs.  I got to call out on the radio set the depths to the winch driver, and fire the CTD bottles on the late night cast.  That boosted my morale with Dallas, the author, and Mick, the father of Dr. Beal.  We have formed a bond with Carlos, our CTD team leader, through our tradition of after-shift snack time in the galley.


Joan Raybourn, August 25, 2005

NOAA Teacher at Sea
Joan Raybourn
Onboard NOAA Ship Albatross IV
August 14 – 25, 2005

Mission: Ecosystem Productivity Survey
Geographical Area: Northeast U.S.
Date: August 25, 2005

Personal Log

Today was the last day of our two-week adventure at sea. At dawn this morning, we paused for a while before entering the north end of the Cape Cod Canal. While we have been within sight of land for a day or two, it was strange to see land on both sides of us. The canal was built in the 1930s, and using it to get back to Woods Hole saves at least half a day’s sailing time. Without it, we would have to sail all the way around the “arm” of Cape Cod. We slipped into the canal and eased our way south, back into civilization. We stood on the bow of the ship and watched fish playing in the water, seabirds hovering hopefully over them. People walked their dogs on the path beside the canal, and sailboats passed silently. All was quiet. When a siren split the air, we knew we were back.

The trip through the canal took about an hour and a half, and we were in Buzzards Bay. We made our way through the islands and back around to Woods Hole, to the pier where our trip began. We cleaned the labs and packed our gear and samples to go ashore. At the pier, a gangplank was attached to the ALBATROSS IV so that we could move “all ashore that was going ashore”. We lugged boxes and crates over it to the NOAA warehouse, the EPA truck, and the NOAA van that would take the samples back to the lab in Rhode Island. It was a strange feeling to be back on land. At the beginning of the trip, my body had to adapt to the motion of the ship, and for the first two days I staggered around until I got my sea legs. Back on land, my body had to adapt again; even though my brain knew I was on solid land, the sensation of motion persisted.

And then it was over. By 2:30, everyone who was leaving was gone, and our shipboard community was dissolved. Since my flight home is not until tomorrow, I will stay one more night aboard the ALBATROSS IV. It’s a little lonely now, with everyone gone and no work to do. But I’ve been up since midnight, when my last watch began, and an early bedtime tonight will be welcome. What an adventure this has been! I will never forget my days out on the wide blue sea, with nothing to see but sky and wind and ocean. Whenever city life hems me in, I’ll be able to go back in my mind’s eye, feeling the wind and the sunshine, and watching the endless play of the sea, all the way to forever.

14

15

Joan Raybourn, August 24, 2005

NOAA Teacher at Sea
Joan Raybourn
Onboard NOAA Ship Albatross IV
August 14 – 25, 2005

Mission: Ecosystem Productivity Survey
Geographical Area: Northeast U.S.
Date: August 24, 2005

Weather Data from the Bridge

Latitude: 43°32’ N
Longitude: 69°55 W
Visibility: 8 miles
Air Temperature: 17° C
Wind direction: E (99 degrees)
Wind speed: 5 knots
Sea wave height: 1’
Sea swell height: <1’
Sea water temperature: 18.8°C
Sea level pressure: 1018.0 millibars
Cloud cover: 7/8 Cumulus

Question of the Day: At what degrees on the compass would you find the intermediate directions? (Use information below to help you and look for the answer at the end of today’s log.

Yesterday’s Answer: GMT stands for “Greenwich Mean Time”. GMT is the time at the Prime Meridian, which passes through Greenwich, England. People around the world can use this time as an international reference point for local time. We are on Eastern Daylight Time (EDT), which is four hours behind GMT. At 1:33 a.m. GMT, it was already August 24 in Greenwich, but our local time was 9:33 p.m. EDT, still August 23, so that is the date I used in the log.

13

Science and Technology Log

Over the last eleven days, the ALBATROSS IV has zigzagged back and forth across southern New England waters, Georges Bank, and the Gulf of Maine. The collection stations were chosen in advance of the trip and plotted on an electronic chart. So how does the crew drive the boat to the next station?

Ship navigation is a combination of automated and manual tasks. Based on the ship’s current position and the latitude and longitude of the next station, the navigator determines what heading to take. That is, he decides in exactly which direction to go using a compass. The ship has an electronic gyroscope as well as a manual compass similar to the ones you may have seen, only larger. It has a magnetic needle that points north, and is divided into 360 degrees. The cardinal directions are these: 0° is north, 90° is east, 180° is south, and 270° is west. The navigator enters the heading into the ship’s navigation computer, and if conditions are normal, he can set the ship on Autopilot. Then the computer will automatically adjust the ship’s direction to keep it on course.

The fact that the ship is running on Autopilot does not mean that the crew can take a break. The crew sets the ship’s speed depending on weather and sea conditions, and on how much other ship traffic there is in the area. In open water, the ALBATROSS IV cruises at about ten to twelve knots, which means we cover about 10 to 12 nautical miles per hour. The crew must constantly monitor to make sure the ship is operating safely and efficiently. They plot the ship’s course on paper, monitor weather conditions, watch for other ships and communicate with them, and adjust the ship’s course and speed. At the collection stations, they are able to put the ship at the exact latitude and longitude called for, and keep it there during water casts and sediment grabs, or moving at just the right speed for plankton tows.

Navigators keep a constant watch out for other ships, using a combination of visual and radar data. They use radar to pinpoint the ships’ locations, and often can be seen scanning the sea with binoculars. Signal lights on ships help with navigation, too. Ships have a red light on the port (left) side and a green light on the starboard (right) side. This helps navigators know which side of a ship is facing them and in which direction it is headed. Of course, radio communication makes it possible for ships’ crews to talk to each other and make sure they are passing safely.

Personal Log

Tonight will be the last night of the cruise. We expect to be back in Woods Hole by midday tomorrow, two days earlier than planned. We’ve been blessed with excellent weather, and have made good time cruising between stations. I was very excited last night to see fireworks in the toilet! Toilets on the ship are flushed with sea water, which often contains some bioluminescent phytoplankton. Sometimes the swirling action of the water will excite them, and we’ll see blue-green sparkles and flashes as the water washes down. (Sewage and waste water are biologically treated on board so that they are safe to release into the ocean.)

I want to thank the crew of the ship, especially the NOAA Corps officers who have welcomed me on the bridge and answered many questions about ship operations. I am particularly grateful to Capt. Jim Illg, who reviewed all of my logs, and Ensign Patrick Murphy, who answered many questions about weather and navigation.

Finally, I want to thank the scientists who willingly shared their knowledge and patiently taught me protocols for their work. Jerry Prezioso, a NOAA oceanographer, served as chief scientist on this cruise. He helped me prepare ahead of time via telephone and email, and has been endlessly helpful to this novice seafarer. His enthusiasm is infectious, and he has a knack for turning any event into a positive experience. Jackie Anderson, a NOAA marine taxonomist, taught me to operate the CTD unit and helped me identify the kinds of zooplankton we captured in the bongo nets. Don Cobb, an EPA marine environmental scientist, helped me understand the kinds of research the EPA is doing to monitor the health of our oceans and estuaries. Thanks to all of them for their  work in keeping Planet Earth healthy, and for making this an experience I can take back to my classroom and use to help make science real for my students.

Today’s Answer: The intermediate directions are those that fall between the cardinal directions, so to find their degree equivalents, find the halfway point between the numbers for each cardinal direction. Northeast would be at 45°, southeast would be at 135°, southwest would be at 225°, and northwest would be at 315°.

Joan Raybourn, August 23, 2005

NOAA Teacher at Sea
Joan Raybourn
Onboard NOAA Ship Albatross IV
August 14 – 25, 2005

Mission: Ecosystem Productivity Survey
Geographical Area: Northeast U.S.
Date: August 23, 2005

Weather Data from the Bridge

Latitude: 44°23’ N
Longitude: 66°37’ W
Visibility: 10 miles
Wind direction: W (270 degrees)
Wind speed: 12.7 knots
Sea wave height: 1’
Sea swell height: 1’
Sea water temperature: 11.1°C
Sea level pressure: 1014.7 millibars
Cloud cover: 1/8 Clear with a few cumulus clouds low on the horizon

Question of the Day: What does “GMT” stand for and how does it affect the date in the log information above?

Yesterday’s Answer: The clock shows 9:17 a.m. There are 24 hours around the clock face. The hour hand is pointing a little past the 9, so that is the hour. To read the minute hand, notice its position. On a twelve-hour clock, this position would indicate about 17 minutes past the hour. Since this clock counts off 24 hours instead of counting to 12 twice, the afternoon and evening hours have their own numbers. For example, 4:00 p.m. on a twelve-hour clock would be 16:00 on a twenty-four-hour clock. There is no need to indicate a.m. or p.m. since each hour has its own unique number.

12

Science and Technology Log

Today I spent some time up on the bridge talking to the crew about weather. The ship collects all kinds of weather data from on-board sensors, including air temperature, air pressure, wind speed and direction, and relative humidity. It also receives weather data from sources outside the ship via satellite link and email. I was especially interested in how the crew determines visibility, cloud cover, sea wave height, and sea swell height, since these represent subjective data. “Subjective” means that someone uses known data and their own experience to make a judgment. Here are some examples.

Visibility just means how far you can see into the distance. This is very hard to judge on the sea because there are no reference points – no objects to “go by” to decide how far away something is. Radar gives an accurate distance from the Albatross IV to objects such as other ships, and on a clear day, the horizon is about twelve miles away. A navigator learns to estimate visibility by combining radar information with how far away objects look in relation to the horizon. It takes a lot of practice to be able to judge visibility using only your eyes!

Cloud cover just means the amount of the sky that is covered by clouds. This is expressed in eighths. Today the cloud cover was about 1/8, meaning about one eighth of the sky had clouds and seven eighths was clear. To make the estimate, mentally divide the sky in half and ask yourself if about half of the sky is cloudy. If you see that less than half the sky has clouds, then mentally divide the sky into fourths, and then eighths. This can be tricky if the clouds are scattered around because it is hard to see a fraction that isn’t all “together”. Once again, this skill takes a lot of practice.

Sea swell height and sea wave height are both descriptors of how the ocean surface is behaving. These are important to observe because they affect the motion of the ship. Swells are large rolling humps of water that are created by the winds from storms. Navigators can tell how far away the storm is by observing the speed of, and length between, the swells. The ship might rock with long, slow swells caused by a storm hundreds of miles away, or with the shorter, faster swells of a storm that is closer. Waves, on the other hand, are caused by local wind; that is, the wind that is blowing right at your location. Waves might just be rippling the water if the wind is light, but can be large if the wind is strong. Both swell height and wave height are estimated in feet from the trough (bottom) to the crest (top) of the wave. Again, this skill takes lots of practice.

Personal Log

Yesterday we got word that a pod of about seventy right whales had been sighted in the Bay of Fundy. This represents a large fraction of this endangered species’ entire population of fewer than 300. Our route has taken us up a little way into the bay, and we have been eagerly watching for whales. We’ve seen several blows in the distance, and occasionally a glimpse of a long back breaking the water. Most of them have been fin whales, but we did see two or three right whales before it was completely dark. It’s exciting to see these giants of the ocean and we hope to see more when the sun comes up.

Joan Raybourn, August 22, 2005

NOAA Teacher at Sea
Joan Raybourn
Onboard NOAA Ship Albatross IV
August 14 – 25, 2005

Mission: Ecosystem Productivity Survey
Geographical Area: Northeast U.S.
Date: August 22, 2005

Weather Data from the Bridge

Latitude: 42°17’ N
Longitude: 69°38’ W
Wind direction: SE (130 degrees)
Wind speed: 10.3 knots
Air Temperature: 19°C
Sea water temperature: 21.8°C
Sea level pressure: 1016.5 millibars
Cloud cover: High, thin cirrus

Question of the Day: What time does the 24-hour clock in picture #7 show?

Yesterday’s Answer: Sediment is composed of all the small particles of “stuff” that sink to the ocean floor. Near the coast, fresh water is flowing into the ocean from rivers and streams, and human activity creates more matter that is flushed into the ocean. Because there are more sources of sediment near the coast, it collects more quickly there than it does in the open sea.

10

11

Science and Technology Log

Advances in computer technology have made the process of collecting plankton and water samples much easier than it was in the past. During a plankton tow or a water cast, many different people are working together from different parts of the ship, and technology makes it easier to communicate, obtain plankton and water samples from precise locations, and protect equipment from damage. The ship’s crew navigates the ship to the exact station location and maintains the location while the samples are collected, there are scientists and crew members on the aft deck handling the collection equipment, a crew member operates the winch to lift and move the equipment, and a scientist operates the computer system that collects data from the Conductivity, Temperature, and Depth instrument (CTD).

The stations, or places where we will collect samples, are designated in advance of the trip and plotted on a computer map. A computer chooses the stations randomly so that we get information from all over the area with no accidental human pattern. The ship’s commanding officer and the head scientist work together to determine the course the ship will take to visit each station. Many factors must be considered, including efficiency, fuel conservation, and weather. Once the course is set, the chief scientist “connects the dots” on the computer map. Then it is easy to see where we are going next, how far away it is, and when we can expect to be there. “Are we there yet?” is a question asked not only by children on vacations, but by scientists and crew at sea!

When the ship approaches a station, the bridge crew makes an announcement so that everyone knows to get ready. “Ten minutes to bongo” means that it is time for the CTD operator to fire up the computer, for the winch operator to get set, and for the deck crew and scientists to get into their gear and make sure the equipment is ready to go. There is a video camera on the aft deck that enables everyone inside to see what is happening on the deck. This makes it easier to coordinate the collection process and to act quickly if there is an emergency.

When the ship is at the exact position of the station, the bridge radios the winch operator. He in turn lets the CTD operator know that we are ready to begin. The CTD person starts the computer program and tells the deck crew to turn the CTD on. The winch operator lifts the equipment and casts it over the side of the ship into the ocean. The “cast” might have just the CTD unit, or water bottles to collect water samples, or the bongos to collect plankton samples. The CTD goes down on every cast since it is collecting data that is important for the success of the tow as well as for further study.

During the cast, the CTD operator watches the computer display to make sure collections are made at the correct water depths. He or she talks to the winch operator over a walkie-talkie so that he knows how far to drop the line and when to pull it back up.  Plankton is collected at about 5 meters above the ocean floor. The ship’s computer tells us how deep the water is and the CTD tells us how deep the instrument itself is. By comparing these two numbers, the CTD person can make sure the equipment doesn’t drag the bottom, which would damage it and contaminate the samples. Once the CTD and the collection equipment are out of the water, the unit is turned off and the CTD operator finishes up the data collection process by entering information such as date, time, latitude, longitude, station and cast numbers. We just finished Station #75, and will be doing our 100th cast at the next station. (More than one cast is done at some stations.) Sample collections at each station can take anywhere from about 20 minutes for a relatively shallow plankton tow to about 2 hours if we are in deep water and collecting plankton, water, and sediment.

During the cast, the CTD operator can watch as the computer creates line graphs showing the data that is being recorded by the CTD unit. In picture #6 above, the line graph on the right shows the depth, while the graph on the left shows the sea temperature in red, the density of the water in yellow, salinity in blue, and fluorescence in green. Density is kind of like how “thick” the water is, salinity is how salty it is, and fluorescence is a measure of phytoplankton. Line graphs show change over time, so we can see how these values change while the CTD is in the water.

Personal Log

Some adaptations take longer than others. Since I switched watches, I have never been completely sure of what day it is, and when I get up in late morning, I’m always surprised to see lunch being served instead of breakfast. However, I have learned to use the physics of the ship’s motion to make everyday tasks easier. Carrying a heavy load up the stairs is easier if you wait for a swell to lift the ship and give you a little boost, and opening doors and drawers, standing up, and even drinking water is easier if you do it with, rather than against, the roll of the ship. As much as I staggered around for the first two days of the cruise, I wonder now if dry land will feel odd when we get there at the end of the week.

Joan Raybourn, August 21, 2005

NOAA Teacher at Sea
Joan Raybourn
Onboard NOAA Ship Albatross IV
August 14 – 25, 2005

Mission: Ecosystem Productivity Survey
Geographical Area: Northeast U.S.
Date: August 21, 2005

Weather Data from the Bridge

Latitude: 42°17’ N
Longitude: 69°38’ W
Wind direction: SE (130 degrees)
Wind speed: 10.3 knots
Air Temperature: 19°C
Sea water temperature: 21.8°C
Sea level pressure: 1016.5 millibars
Cloud cover: High, thin cirrus

Question of the Day: Why does sediment collect on the ocean floor more rapidly near the coast than it does further out in the ocean?

Yesterday’s Answer: The stern of the ship is at the back, and the sun rises in the east, so the ship must have been heading west.

9

Science and Technology Log

On this cruise, there are actually two separate but complementary kinds of research going on. We have two scientists from the Environmental Protection Agency (EPA) who are collecting samples of the sediment on the ocean floor, which will be analyzed both biologically and chemically. Biology is the study of living things, so the scientists will look to see what organisms are living in the top layer of the ocean floor. The chemical analysis will show what non-living substances, mainly nitrogen and phosphorus compounds, are present. Chemicals may occur naturally, or may be a result of pollution. This work gives us information about human influence on the ocean ecosystem.

To collect the ocean floor sample, scientists use a sediment grab (picture #1). The “grab” is lowered into the ocean until it hits the bottom, where the container closes and “grabs” a sample of whatever is down there. Then it is hauled back to the surface and opened to see what has been collected. There could be sand, silt, mud, rocks, and any creatures living at the bottom of the ocean. There are two chambers in the grab. From one chamber, the top 2-3 cm of sediment are scooped into a pot, mixed up, and put in jars for later chemical analysis. This thin top layer will yield information about the most recent deposits of sediment. Near the coast, that sample may represent matter that has settled to the ocean floor over a year or so. Further out, that much sediment would take several years to deposit. The contents of the other chamber are dumped into a bucket and washed through a sieve to remove the sediment and leave only the biological parts.

The sieves used for the sediment sample are very much like the ones used for the plankton samples, but bigger and with larger mesh at the bottom (picture #4). The bigger “holes” in the mesh allow silt and sand to be washed out. Whatever is left in the sieve is put into jars and stored in coolers for later analysis. The sample contains evidence of what lives in the benthic layer, the top layer of the ocean floor. This evidence could be plankton, worm tubes, or remains of once-living animals.

At each station where a sediment grab is performed, three water samples are taken, one each from the bottom, the middle, and the surface of the ocean. One liter of each water sample is filtered (picture #6) to analyze its nutrient content. This process is somewhat similar to the chlorophyll filtering I described in yesterday’s log. The filters are saved to be analyzed in laboratories, which will look for both dissolved nutrients and particulate matter. Dissolved nutrients are like the sugar that dissolves in your cup of tea – you can’t see it, but it’s still there. Particulate matter consists of tiny bits (particles) of things such as plankton, whale feces, plants, anything that might be swirling around in the ocean.

The EPA is primarily concerned with human influences on natural environments. By collecting sediment and water data, scientists can see what substances humans are putting into the ocean, and what effects they are having on the plants and animals living there. This work meshes well with the plankton research work, since the health of the plankton is directly influenced by the health of its environment. Everything in the natural world is connected, and we humans must learn how to balance our wants and needs with the needs of all other living things. If we are not careful about how we use our Earth, we will upset the balance of nature and create negative consequences that we may not see for years. For example, if chemicals dumped into the ocean (on purpose or accidentally) kill large numbers of phytoplankton, then the entire food web will be disrupted in a kind of ripple effect, like a stone dropped into a pond. The zooplankton (who eat phytoplankton) will starve, and the animals that eat zooplankton will either starve or move to a different part of the ocean, which in turn changes that part of the ecosystem. From this very small example, maybe you can see how huge our responsibility is to keep our oceans (and other environments) clean.

Personal Log

I am so grateful to Jerry Prezioso, our NOAA chief scientist, and Don Cobb, our EPA scientist. They have included me in all of their operations from Day 1, and have been infinitely patient with my many questions. They have explained things over and over until I “got it”, from procedures for collecting samples to the science behind all their work. It has been eye-opening to be on the student side of learning. Many times I have not even had enough background knowledge to know what questions to ask, or have been almost paralyzed with fear that I might do something wrong and skew someone’s data. I know this experience will help me better understand my students who go through these same feelings of anxiety and joy when they are learning something new.

Joan Raybourn, August 20, 2005

NOAA Teacher at Sea
Joan Raybourn
Onboard NOAA Ship Albatross IV
August 14 – 25, 2005

Mission: Ecosystem Productivity Survey
Geographical Area: Northeast U.S.
Date: August 20, 2005

Weather Data from the Bridge

Latitude: 42°17’ N
Longitude: 69°38’ W
Wind direction: SE (130 degrees)
Wind speed: 10.3 knots
Air Temperature: 19°C
Sea water temperature: 21.8°C
Sea level pressure: 1016.5 millibars
Cloud cover: High, thin cirrus

Question of the Day: Based on the caption for photo #6 above, in which direction was the ALBATROSS IV traveling when the picture was taken?

Yesterday’s Answer: Our location at 41.39 N and 67.11 W means our goldfinch was 160 nautical miles from Woods Hole. A nautical mile is equal to one minute of latitude and is slightly longer than an ordinary land mile.

99

Science and Technology Log

In addition to collecting zooplankton samples, we also collect water samples and measure the amount of chlorophyll they contain. Phytoplankton are too small to see, but an instrument called a flourometer can measure their presence. The flourometer shines a beam of light through the water sample and measures how much blue light (fluorescence) is present.

This process is fairly delicate and great care must be taken to get a good representative water sample, and then not to contaminate it during processing. Water samples are collected in two ways: some are collected in water bottles that are attached to the bongo cable, and others are collected from a hose that is pumping sea water into the plankton lab.  In picture #1 above, our chief scientist, Jerry Prezioso, is collecting a sample from the plankton lab hose. The sample itself is poured through a filter into the bottle to remove any large particles that may be present. Then 200 ml of the sample water is pumped through a fiberglass filter (picture #2). The filter traps chlorophyll as the water passes through. Even though the large amounts of chlorophyll in land plants gives them their bright green color, the small amounts present in phytoplankton are not visible, so you can’t see it on the filter. In picture #3, Jerry uses tweezers to remove the filter (a small white circle) and place it into a cuvette, which is a small test tube. The cuvette contains acetone, which preserves the sample. Then it is placed upside down in the cooler for 12 to 24 hours, which allows the chlorophyll on the filter to wash out into the acetone.

When the sample is ready to be measured, it is taken out of the cooler along with a “blank”, a cuvette of plain acetone with no chlorophyll present. The two cuvettes must warm up a little before they are read, because water condensation on the outside of the cuvette can result in a false reading. We use the flourometer to take three separate readings. When we do science investigations at school, we determine which factors are constant (kept the same for each trial) and which are variable (the thing you are changing in each trial). In this case, the variable is the amount of chlorophyll on the filter. In order to make sure we are measuring only chlorophyll, we also “read” two constants: a solid standard, which is contained in its own tube and used for every trial, and the blank containing only acetone. After the chlorophyll sample is read, we can compare the three sets of data to see how much chlorophyll is really there. In picture #4, I am putting a cuvette into the flourometer, which will shine a light through it and display a number value. The numbers for the solid standard, the blank, and the chlorophyll sample are all recorded on the clipboard along with data such as date, time, and where the sample was collected. Later, the data will be entered into a computer for further analysis.

Why do we want to know about chlorophyll in the ocean? Well, chlorophyll is produced by plants, in this case, phytoplankton. By measuring the amount of chlorophyll in the water samples, scientists are able to determine how much phytoplankton is present. Since phytoplankton is the base of the ocean food web, it is one more piece of the ocean ecosystem puzzle.

Personal Log

Today I switched from the day watch to the night watch, but the timing was good because we had a long steam between stations and I was able to get a little extra sleep before doing a double watch. While all the scientists usually eat meals together, we work in teams to cover the watches, so I will be working with a different set of people. I am now on watch from noon to 6:00 p.m. and from midnight to 6:00 a.m. We will be working our way north for the next week, and the probability of seeing whales is increasing. That will be exciting!

Joan Raybourn, August 19, 2005

NOAA Teacher at Sea
Joan Raybourn
Onboard NOAA Ship Albatross IV
August 14 – 25, 2005

Mission: Ecosystem Productivity Survey
Geographical Area: Northeast U.S.
Date: August 19, 2005

Weather Data from the Bridge

Latitude: 40’ 17” N
Longitude:  70’ 08” W
Wind direction: NNE (29 degrees)
Wind speed: 19.6 knots
Air temperature: 19° C
Sea water temperature: 22.8°C
Sea level pressure: 1018.1 millibars
Cloud cover: cloudy

Question of the Day: Yesterday a goldfinch visited us, but we are far out to sea. When I took the picture above (#6), our position was 41.39 N and 67.11 W. About how far was this little guy from Woods Hole, Massachusetts?

Yesterday’s Answer: Qualitative data is the “what” that your doctor can observe but not necessarily measure. She might look in your ears, eyes, and throat, feel your internal organs through your abdomen, observe your spine, test your reflexes, have you balance on one foot with your eyes closed, and ask general questions about how you feel. Quantitative data is the “how much”; it is something that can be measured. Your doctor will probably measure how tall you are and how much you weigh, and take your temperature and your blood pressure. If she takes blood or urine samples, they will be analyzed for both qualitative and quantitative properties. We are observing and recording similar kinds of data about the ocean, so scientists can get a good picture of the health of this ecosystem.

8

Science and Technology Log

We are very fortunate on this cruise to be able to deploy a drifter buoy. The NOAA Office of Climate Observation (OCO) established the Adopt-a-Drifter program in December 2004. The program makes buoys available to teachers who are participating on cruises as Teachers at Sea. Our drifter has been adopted by my school, Greenbrier Intermediate School of Chesapeake, Virginia, and by Julie Long’s school, Farnsworth Middle School of Guilderland, New York. We named him (It’s a buoy!) Moose in honor of the fact that he was deployed in the Georges Bank area of the Gulf of Maine, which has a number of GOMOOS (Gulf of Maine Ocean Observing Systems) buoys. Moose is the fourth drifter buoy to be deployed as part of the NOAA program, and joins over 1,000 drifter buoys collecting data worldwide.

The buoy itself is a blue and white sphere about the size of a beach ball. It is attached to a drogue, a long “tail” that hangs below the buoy and ensures that it is drifting with the surface currents and not being pushed along by the wind. The buoy is equipped with a water temperature sensor, and a transmitter so that its position and temperature data can be beamed to a satellite, which relays this information to a ground station that will place it on a website. Julie and I decorated the buoy with our school names and signatures – it even has a Greenbrier Intermediate School sticker and a picture of our panther mascot. Then we deployed the buoy on August 18 by tossing it over the side of the ship while it was moving slowly. It was a little sad to see Moose drifting off without us, so small on the huge ocean, but we can follow his adventures for the next 410 days by checking the Adopt a Drifter website. You can begin tracking it here. You can find Moose by clicking on his WMO number, which is 44902. The website will give you the location of the buoy (latitude and longitude) and the date, time, and temperature of the surface water at that location.

What can scientists do with the data about surface water currents that buoys such as Moose are collecting? Of course it can be used to track major ocean currents. Knowledge of currents is useful for understanding the ocean ecosystem and for navigation. But this data will also be used to build models of climate and weather patterns, predict the movement of pollution spills, and even to assist with forecasting the path of approaching hurricanes.

Personal Log

I finally feel like I am becoming useful as a scientist on this cruise, not just an interested observer. Although I have been busy helping from Day 1, I am gaining confidence about conducting some parts of the work on my own. I have learned to collect and preserve the plankton samples, process water samples for chlorophyll, and operate the CTD (Conductivity, Temperature, and Depth), a computer linked instrument that measures oceanographic data. This morning I was up in time to watch a beautiful sunrise and had time to do a load of laundry during a long steam between stations. We had a raft of seabirds sitting hopefully off the stern while we were stopped for some work, and the weather is cool and sunny. It’s a beautiful day in the neighborhood!

Joan Raybourn, August 18, 2005

NOAA Teacher at Sea
Joan Raybourn
Onboard NOAA Ship Albatross IV
August 14 – 25, 2005

Mission: Ecosystem Productivity Survey
Geographical Area: Northeast U.S.
Date: August 18, 2005

Weather Data from the Bridge

Latitude: 41.36 N
Longitude:  67.11 W
Wind direction: N (343 degrees)
Wind speed: 2.6 knots
Sea water temperature: 17.9°C
Sea level pressure: 1019.3 millibars
Cloud cover: 00 Clear

Question of the Day: What kind of quantitative and qualitative data does your doctor take when you go in for a checkup? (Read the science log below for explanations of these terms.)

Yesterday’s Answer: Phytoplankton are eaten by zooplankton, which are in turn eaten by penguins, sea birds, fishes, squid, seals, and humpback and blue whales.

7

Science and Technology Log

On some of the plankton tows, we attach a set of “baby bongos”, which are a smaller version of the big bongos. Their nets are made of a much finer mesh, so they catch even smaller kinds of plankton. The samples retrieved from the baby bongos are sent to scientists who are working on genetic analysis. By examining the DNA present in the samples, they can discover new species and determine how known species are distributed in the water.

After the nets are washed down, and their contents are in the sieves, we bring the sieves inside to preserve the samples. The plankton from each net go into separate jars, two jars for each big bongo haul, and two more if we do a baby bongo haul. The plankton are carefully washed out of the sieve and into the jars with a small stream of water. Then we add formaldehyde to preserve the samples in the big bongo jars, and ethanol to preserve the genetic samples in the baby bongo jars. Each jar is labeled to show where it was collected, and stored until we get to shore. The big bongo samples each have a special purpose. One will be analyzed to see what kinds of ichthyoplankton, or tiny baby fish, are present. The second jar will be analyzed both qualitatively and quantitatively. Qualitative data tells what kind of plankton you have. Quantitative data tells how much plankton the jar contains. You can think of these as “the what (qualitative) and how much of the what (quantitative)”.

All of this data is an indicator of the health of the ocean ecosystem. It’s kind of like when you go to the doctor for a checkup. Your doctor takes your pulse and your temperature, looks in your mouth and ears, tests your reflexes, and takes other kind of data to see how healthy you are. The scientists involved in this project are giving the ocean a checkup. We are collecting data on the water itself (salinity and temperature at different depths), on the plankton that live in it, and on the weather. Over the years, patterns develop that help scientists know what is “normal” and what is not, how weather influences the ocean ecosystem, and how to predict future events.

Personal Log

I decided not to take a nap yesterday afternoon, and I can feel the difference this morning. It was hard to get up! Sometimes it is hard to remember what day it is because of the six-hour watch schedule. Instead of a nap yesterday, I went up on the hurricane deck with my book and just sat. I read a little, watched the other crew do a bongo haul, dozed a little, but mostly just watched the sky and the ocean. The sea stretches all the way to the horizon in every direction, the sun sparkles on the water, a few feathery clouds float in the sky. Very occasionally, a far away fishing boat or cargo ship slips by. Life is good. We are planning to deploy our drifter buoy this afternoon. More about that tomorrow.

Joan Raybourn, August 17, 2005

NOAA Teacher at Sea
Joan Raybourn
Onboard NOAA Ship Albatross IV
August 14 – 25, 2005

Mission: Ecosystem Productivity Survey
Geographical Area: Northeast U.S.
Date: August 17, 2005

Weather Data from the Bridge

Latitude: 40’ 17” N
Longitude:  70’ 08” W
Wind direction: NNE (29 degrees)
Wind speed: 19.6 knots
Air temperature: 19° C
Sea water temperature: 22.8°C
Sea level pressure: 1018.1 millibars
Cloud cover: cloudy

Question of the Day: What kinds of animals depend on plankton as a major food source?

Yesterday’s Answer: Phytoplankton are producers, since they make their own food.

6

Science and Technology Log

On this cruise aboard the ALBATROSS IV we will be taking plankton samples at 90 stations off the coast of New England. The stations are randomly chosen by a computer, so some are close together and some are further apart. The idea is to get a broad picture of the ecological health of the entire region.

The actual process of plankton collection is called a plankton tow, because the nets are towed through the water while the ship is moving slowly, collecting plankton as the water moves through them. Can you guess why the collection apparatus is called a bongo? (Look at picture #2 above.) The frame looks just like a pair of bongo drums! Attached to the frame are two long nets that collect the plankton. The bongo isn’t heavy enough to sink into the water evenly on its own, so a lead ball is added to help pull it down to the bottom smoothly. (See pictures 3 & 4.) The bongo is attached to a cable, which is in turn attached to a pulley system that lowers the bongo into the water and pulls it back up again. Since we only want floating plankton, we have to be sure the bongo doesn’t scrape the bottom. We lower the bongo to about 5 meters above the bottom, and then bring it back up.

The nets bring in all kinds of zooplankton, very small but big enough to see. (Most phytoplankton are so tiny they slip right through the net!) There are lots of copepods, which are related to lobsters, and sometimes arrow worms, which are tiny predators that love to eat copepods! There are other species as well, including some jellyfish. We have to be very careful to save the entire sample so that scientists back on shore can see exactly what was living near each station. When the nets are back on board, we use a hose to wash the plankton down to the bottom of the net. Then we untie the net, dump the plankton into a sieve, and spray some more to be sure nothing is left in the net. At the end of this process, we tie the bottoms of the nets again (so they are ready for the next tow) and take the sieves with the plankton inside to the wet lab for the next step. I’ll describe the process of preserving the plankton samples in tomorrow’s log.

Several kinds of data (besides the plankton itself) are collected on each tow. For example, we take water samples to analyze for salinity and chlorophyll, and the EPA scientists are collecting samples of the ocean floor. In the days to come, I will describe them and explain how computers are used to make all of this work easier. Stay tuned!

Personal Log

I am becoming much more comfortable with the routine tasks of the trip. I can handle the bongo pretty well, and can preserve the plankton samples we get. I am learning to operate the computer end of the process and will soon be able to do that on my own. I can use the tracking system to see where we are going next and how long it will be until we get there. Do I have time to take some pictures? How about to grab a snack? I enjoy talking with the crew, and have discovered that “it’s a small world after all” – our navigator grew up in Virginia Beach and another crew member just built a house in Chesapeake. I can now walk without too much trouble, and this morning I awoke before my alarm went off because I heard the engines slow down as we approached a tow station. There is rumor of a cookout on the deck tonight, so I’d better go get in a nap before then!

Joan Raybourn, August 16, 2005

NOAA Teacher at Sea
Joan Raybourn
Onboard NOAA Ship Albatross IV
August 14 – 25, 2005

Mission: Ecosystem Productivity Survey
Geographical Area: Northeast U.S.
Date: August 16, 2005

Weather Data from the Bridge

Latitude: 40’ 17” N
Longitude:  70’ 08” W
Wind direction: NNE (29 degrees)
Wind speed: 19.6 knots
Air temperature: 19° C
Sea water temperature: 22.8°C
Sea level pressure: 1018.1 millibars
Cloud cover: cloudy

Question of the Day:  What is phytoplankton’s place in the food chain? (producer or consumer)

Yesterday’s Answer: Factors that could influence the depth to which sunlight penetrates the sea water include amount of cloud cover and how clear the water is. If the weather is clear, more sunlight makes it through the atmosphere to the surface of the sea. If the water is clear, the sunlight can go deeper than if the water is murky with a large mass of surface plankton, excess nutrients, pollutants, or silt.

5

Science and Technology Log

In yesterday’s log I talked about phytoplankton. The other group of plankton is zooplankton. Phytoplankton are plants, and zooplankton are animals. If you think of the sea as a bowl of soup, the zooplankton are the chunky parts. They include organisms that spend all of their lives as plankton, as well as the baby forms of other seas animals, such as crabs, lobsters, and fish. Most zooplankton eat phytoplankton, making them the second step up the ocean food chain.

While you would need a microscope to see most phytoplankton, you can see most zooplankton with an ordinary magnifying glass. Many are big enough to see with the naked eye. While phytoplankton need to stay near the surface of the sea in order to absorb the sunlight they need for photosynthesis, zooplankton can live at any depth. Zooplankton have structural adaptations that help them float easily in the ocean currents. Some have feathery hairs to that can catch the current. Others have tiny floats filled with air, and still others contain oil that helps them float. There are even behavioral adaptations that zooplankton have developed to help them survive. One kind of snail makes a raft of air bubbles and floats on that. Some even link together and float through the ocean looking like skydivers holding hands.

Many animals go through several physical changes as they go through their life cycles. For example, a butterfly begins life as an egg, hatches into a caterpillar (larval stage), makes a chrysalis, and finally emerges as a beautiful adult. Many marine animals go through similar changes, and during their larval stage they are part of the mix of plankton in the ocean. These “temporary” zooplankton are called meroplankton. These include baby crabs, lobsters, clams, snails, sea stars, and squid. Permanent plankton are called holoplankton, and include copepods, krill, sea butterflies, and jellyfish.

One of our deck hands joked about having sushi for breakfast right after we completed a very productive plankton tow. We might not like that kind of sushi, but many ocean animals love it, and depend on it as their food source. Krill (shrimp-like zooplankton) are a very popular menu item with penguins, sea birds, fishes, squid, seals, and humpbacks and blue whales. “A single blue whale may devour up to eight tons of krill a day.” (from Sea Soup: Zooplankton by Mary M. Cerullo)

Most of the plankton we are collecting on this cruise are zooplankton. We preserve them in jars, and when the cruise is over they will be sent to laboratories where other scientists will analyze the samples. We also analyze water samples for chlorophyll, though, which is made by phytoplankton and is therefore an indicator of their health. In the days to come, I will describe the procedures used for the plankton collection, as well as those used for the EPA research.

Personal Log

Life on board a research vessel is not all work and no play. During down time, people rest, read, play games, watch movies, work on needlework, or get a snack, much like life at home. When I am not on watch, I write my logs, take and organize pictures, take a shower, do laundry, send email, and sleep. The scientists are usually able to eat meals together around the time we switch watches. We gather for breakfast around 5:30 a.m., for lunch around 11:30 a.m., and for dinner around 5:30 p.m. It’s nice to have a chance to catch up with each other while one group comes to work and the other goes off to bed.

John Sammons, August 4, 2005

NOAA Teacher at Sea
John Sammons
Onboard NOAA Ship Albatross IV
July 25 – August 4, 2005

Mission: Ecosystem Survey
Geographic Region: Northeast U.S.
Date: August 4, 2005

Screen shot 2014-02-02 at 10.26.11 PMWeather Data from the bridge

Latitude: 42° 5’ N
Longitude: 67° 28’ W
Visibility: undetermined
Wind direction: E ( 107 degrees)
Wind speed:  12 knots
Sea wave height: 3’
Swell wave height: 0’
Sea water temperature: 14°C
Sea level pressure:  1022.2 millibars
Cloud cover: 30% Partly cloudy,cumulus

Question of the Day: Last day at sea

Yesterday’s Answer: Scallops are categorized as invertebrates. Scallops belong to the animal kingdom.

Science and Technology Log

On Thursday, we got word that our ship would be back in port by early Friday morning between 4 and 7 a.m. Once we complete the last 20 or so stations, it will be time to clean up and prepare the ship for docking. A large spider crab was brought in at station 454.

The chart below shows a selected number of species and the total and average catch weights from July 25–August 3.

LOGGED_SPECIES_NAME

TOTAL # CAUGHT

TOTAL MASS (grams)

AVERAGE MASS (grams)

OBJECTS WITH SIMILAR MASS

HAGFISH ATLANTIC

41

3230

79

SPINY DOGFISH

1

1560

1560

BARNDOOR SKATE

31

35342

1140

WINTER SKATE

183

196116

1072

LITTLE SKATE

1,628

638483

392

SMOOTH SKATE

19

9517

501

THORNY SKATE

32

7739

242

ATLANTIC HERRING

3

402

134

SILVER HAKE

1,018

117103

115

COD

32

11498

359

HADDOCK

348

64742

186

WHITE HAKE

9

8180

909

RED HAKE

2,941

407185

138

SPOTTED HAKE

2

310

155

FOURBEARD ROCKLING

23

296

13

AMERICAN PLAICE

102

30261

297

FLUKE

18

28240

1569

FOURSPOT FLOUNDER

798

126633

159

YT FLOUNDER

463

111390

241

WINTER FLOUNDER

61

48560

796

WITCH FLOUNDER

47

18300

389

WINDOWPANE FLOUNDER

126

27576

219

GULF STREAM FLOUNDER

344

9189

27

BLACKBELLY ROSEFISH

1

8

8

SCULPIN UNCL

6

18

3

MOUSTACHE SCULPIN

31

33

1

LH SCULPIN

571

88391

155

SEA RAVEN

29

21468

740

ALLIGATORFISH

4

2

1

NORTHERN SEAROBIN

1

47

47

CUNNER

2

493

247

ROCK GUNNEL

18

75

4

NORTHERN SAND LANCE

26

37

1

OCEAN POUT

290

71883

248

FAWN CUSKEEL

11

382

35

GOOSEFISH

389

1046990

?

AMERICAN LOBSTER

22

34552

1571

CANCER CRAB UNCL UNSEXED

1,138

123203

108

STARFISH UNCL

78,925

161850

2

ASTERIAS BOREAL

36,851

243218

7

ASTROPECTEN SP

2,833

15623

6

ICELAND SCALLOP LIVE

18

447

25

SCALLOP ICELAND CLAPPER

3

56

19

CONGER EEL UNCL

1

200

200

SEA SCALLOP CLAPPER

1,980

227126

115

SEA SCALLOP LIVE

114,868

20960122

?

SNAKE EEL UNCL

5

59

12

ILLEX SQUID

12

1442

120

LOLIGO SQUID

3

186

62

SPOONARM OCTOPUS

8

201

25

SCORPIONFISH AND ROCKFISH

1

4

4

1) Use a calculator to find the average masses of the goosefish and sea scallops. You can find these averages by dividing the total mass by the total number caught.
2) Which species had the most average mass?
3) Which species had the least average mass?
4) Which two or three species have about the same mass?
5) Complete the last column in the table by finding everyday objects that have similar masses. Choose at least ten.
6) Select the top ten heaviest species and create a bar graph comparing their masses.

Personal Log

A Fond Farewell 

The time has come to say goodbye to all our friends for now,
The night watch worked from 12 til six, it’s time to take a bow.
Larry crunched the numbers and helped it make more sense,
Vic was the head scientist who made things seem less tense.
KB shared her knowledge in a very caring way,
While Lara measured up the scallops quickly every day.
Erin took the sign and camera to the pile to pose,
It was Kris who was in charge and kept us on our toes.
Nikolai had a funny way of helping us all learn,
And with that said I, John, must conclude, it’s over, let’s adjourn!

Ode to the ALBATROSS IV 

By John Sammons

Arrived on early Sunday eve to find the ship was docked,
Passing through the metal gate that I only thought was locked.
Resting from her recent trip, she makes a humming sound,
Waiting for her crew to board and get a look around.
The sun reflects and sparkles in the ever choppy sea,
I wonder what this exciting adventure will bring to me.

The waves come toward the ALBATROSS and into the lengthy side,
Feel the rocking back and forth, so hold on for the bumpy ride.
Prepare the dredge and send it forth to bring up another load,
Bring out the baskets and buckets and pads to get in a sorting mode.
Place the containers on the scale then measure the scallop’s shell,
Soon the shift will come to an end with only stories left to tell.

Steaming forward to the station that is just right up ahead,
Six hours is up, and our shift will end, so it’s time to go to bed.
Before I rest and take a nap, some chow I would like to eat,
It will be good to rest a little while and get off from my feet.
The food is great, so many choices that we are able to choose,
Just fill ‘er up and head to bed and settle for a snooze.

Time to muster and be alert for another shift begins,
Shells and starfish wait for us, along with things with fins.
Pull up a bucket and a pad to sample and to sort,
It’s been three days since ALBATROSS steamed from the distant port.
Ouch! I bellowed as a scallop clamped onto my finger,
Upon the deck you sort and scoop, but dare not stand and linger.

Let me stop and ponder now about the time I’ve spent,
It seems like days and nights have passed, they’ve come, they’ve gone, they went!
Zigging left and zigging right, we have sailed right out to sea,
It seems so wide and open, such an awesome sight for me.
There’s so much to learn from everyone who works upon this ship,
It’s hard to think that soon we’ll be halfway through our trip.

Stand in awe as the sun begins to finally set,
Awash in orange and red and yellow, it is hard to forget.
What a lasting beauty as the sky begins to glow,
Its splendor in the many colors that it will show.
Waiting for its lasting blaze of light to end the day,
Now I lay me down to sleep, I ask of Him, I pray

The heavy dredge is ready for another timely tow,
Expect to catch the scallops, to the surface they will go.
Dropping to the bottom where its 80 meters deep,
Spending fifteen minutes dragging and bringing in the keep.
Then they’re sorted on the surface while hiding in their shell,
The aging/growth ridges on their outside’s what they tell.

Working two shifts makes it hard to fully stay awake,
But ignoring the wakeup call could be a big mistake.
So much to choose from when it’s finally time for us to eat,
Better be there when it is your time to get a decent seat.
Take a minute or two to rest while the ship is on a steam,
When it’s time to go to bed, enjoy that time to dream.

Ten minutes to go before it’s time for another CTD,
When the crew will set and drop it down into the sea.
It only takes a moment for the thing to take a dash,
To the bottom it will go, watch that it doesn’t crash.
Then it’s time to drop the dredge and ready for the tow,
Soon you’ll hear them haul it in, and it’ll be time to go.

With just a few days left before we enter the home port,
We still continue to collect and sample and we sort.
The number of each species catch continues to go up,
We even brought a dogfish in that was only just a “pup”.
What more can we expect to find within the capture net,
From this station to the next one, we’ll take what we can get.

The time has come to say goodbye to all our friends for now,
The night watch worked from 12 til six, it’s time to take a bow.
Larry crunched the numbers and helped it make more sense,
Vic was the head scientist who made things seem less tense.
KB shared her knowledge in a very caring way,
While Lara measured up the scallops quickly every day.
Erin took the sign and camera to the pile to pose,
It was Kris who was in charge and kept us on our toes.
Nikolai had a funny way of helping us all learn,
And with that said I, John, must conclude, it’s over, let’s adjourn!

John Sammons, August 3, 2005

NOAA Teacher at Sea
John Sammons
Onboard NOAA Ship Albatross IV
July 25 – August 4, 2005

Mission: Ecosystem Survey
Geographic Region: Northeast U.S.
Date: August 3, 2005

Weather Data from the Bridge

Latitude: 42° 5’ N
Longitude: 67° 28’ W
Visibility: undetermined
Wind direction: E ( 107 degrees)
Wind speed:  12 knots
Sea wave height: 3’
Swell wave height: 0’
Sea water temperature: 14°C
Sea level pressure:  1022.2 millibars
Cloud cover: 30% Partly cloudy,cumulus

Questions of the Day: In what group is the scallop categorized – vertebrates or invertebrates? What kingdom does the scallop belong – monerans, protests, fungi, plants, or animals?

(You may need to use a dictionary to look up these words before deciding the correct answer.)

Screen shot 2014-02-02 at 10.25.09 PM

Yesterday’s Answer: If the sea scallop population were to change drastically, then the population of starfish and crabs might change, too. Other organisms that are in the same community as the scallop are little skate, red hake, yellow tail flounder, and goosefish.

Science and Technology Log:

On Wednesday, the ALBATROSS IV began surveying the western edge of Georges Bank. Typically dense fog, cool temperatures, low visibility dominate the scene. We are currently about 55 miles offshore as we continue to meander between stations and conduct a sampling of the various strata. This morning we caught a dogfish shark in the dredge and took a photo opportunity. It is exciting when a new species (one we have not seen yet on this survey) appears in the dredge. The biggest excitement came when hagfish started to appear in the dredge. These snake-like fish tried to squirm their way off the deck. Several adjustments were made in the trackline (or stations we will visit) to account for time and problems with the tow.

The chart below shows a selected number of species and the total catch weights from July 25 – August 2.

Species Names

Catch Weight (grams)

HAGFISH ATLANTIC

3,230

SPINY DOGFISH

1,560

BARNDOOR SKATE

33,462

WINTER SKATE

152,976

LITTLE SKATE

608,663

SMOOTH SKATE

5,303

THORNY SKATE

6,199

ATLANTIC HERRING

402

SILVER HAKE

116,339

COD

11,498

HADDOCK

59,354

WHITE HAKE

7,140

RED HAKE

399,512

SPOTTED HAKE

310

FOURBEARD ROCKLING

191

AMERICAN PLAICE

30,250

FLUKE

27,660

FOURSPOT FLOUNDER

124,973

YT FLOUNDER

108,054

WINTER FLOUNDER

46,980

WITCH FLOUNDER

15,660

WINDOWPANE FLOUNDER

27,576

GULF STREAM FLOUNDER

9,189

BLACKBELLY ROSEFISH

8

SCULPIN UNCL

18

MOUSTACHE SCULPIN

33

LH SCULPIN

80,691

SEA RAVEN

21,468

ALLIGATORFISH

2

NORTHERN SEAROBIN

47

CUNNER

493

ROCK GUNNEL

75

NORTHERN SAND LANCE

40

OCEAN POUT

68

FAWN CUSKEEL

382

GOOSEFISH

933,330

AMERICAN LOBSTER MALE

34,550

CANCER CRAB UNCL UNSEXED

122,684

STARFISH UNCL

161,477

ASTERIAS BOREAL

242,902

ASTROPECTEN SP

15,623

ICELAND SCALLOP LIVE

450

SCALLOP ICELAND CLAPPER

56

CONGER EEL UNCL

200

SEA SCALLOP CLAPPER

222,600

SEA SCALLOP LIVE

19,863,690

SNAKE EEL UNCL

59

ILLEX SQUID

1,313

OCTOPUS SPOONARM

109

SPOONARM OCTOPUS

200

SCORPIONFISH AND ROCKFISH UNCL

4

UNKNOWN 01

19

1) Order the 10 highest amounts from greatest to least.
2) Order the 10 lowest amounts from least to greatest.
3) Which species has a total with a 9 in the millions place?
4) Which species has a total with a 6 in the ten thousands place?
5) Which species has a total with a 9 in the hundred thousands place?
6) Choose a species to research. Why do you think their numbers are higher or lower than the others are?

Personal Log

A Few Days Left 

With just a few days left before we enter the home port,
We still continue to collect and sample and we sort.
The number of each species catch continues to go up,
We even brought a dogfish in that was only just a “pup”.
What more can we expect to find within the capture net,
From this station to the next one, we’ll take what we can get.

John Sammons, August 2, 2005

NOAA Teacher at Sea
John Sammons
Onboard NOAA Ship Albatross IV
July 25 – August 4, 2005

Mission: Ecosystem Survey
Geographic Region: Northeast U.S.
Date: August 2, 2005

Weather Data from the bridge

Latitude: 42° 5’ N
Longitude: 67° 28’ W
Visibility: undetermined
Wind direction: E ( 107 degrees)
Wind speed:  12 knots
Sea wave height: 3’
Swell wave height: 0’
Sea water temperature: 14°C
Sea level pressure:  1022.2 millibars
Cloud cover: 30% Partly cloudy,cumulus

Questions of the Day: Explain what might happen if the sea scallop population were to change drastically. What other organisms are in the same community as the scallop?

(You may want to look at the Day 8 food web and the graph below.)

Yesterday’s Answer:

Scallops are predators because they eat something else, that is phytoplankton and zooplankton. They are primarily herbivores. Scallops are mostly prey to, or eaten by, sea stars and crabs.

Science and Technology Log

Screen shot 2014-02-02 at 10.24.04 PM*CTD = Conductivity, Temperature, Depth instrument is used to measure salinity, temperature, and depth at selected stations. This is important because different species of marine animals (including the sea scallop) have tolerances for certain temperatures and depths.

On Tuesday, the ALBATROSS IV continued surveying the northern edge of Georges Bank as it makes its way west toward Woods Hole. The weather has been very cooperative with a ridge of high pressure overhead, despite the routine early dense fog. Scallop counts are very low while other newer species are being observed, including various species of sea stars and the hagfish. The chart below shows a selected number of species and the stations in which they were found.

Sea Scallop Survey Leg II: Stations Where Species Were Found

Screen shot 2014-02-02 at 10.24.16 PM

Questions:

1) Which of these species was caught at the most stations?

2) Which of these species was caught at the least number of stations?

3) At how many more stations were the sea scallops caught than the red hake?

4) What might explain why sea scallops were found at the most number of stations on this survey?

5) What is the difference between the number of stations that the yellow tail flounder were located and the sea scallop?

Personal Log

Measuring Up 

Ten minutes to go before it’s time for another CTD,
When the crew will set and drop it down into the waiting sea.
It only takes a moment for the thing to take a dash,
To the bottom it will go, but watch that it don’t crash.
Then it’s time to drop the dredge and ready for the tow,
Soon you’ll hear them haul it in, and it’ll be time to go.


John Sammons, August 1, 2005

NOAA Teacher at Sea
John Sammons
Onboard NOAA Ship Albatross IV
July 25 – August 4, 2005

Mission: Ecosystem Survey
Geographic Region: Northeast U.S.
Date: August 1, 2005

Weather Data from the bridge

Latitude: 42° 5’ N
Longitude: 67° 28’ W
Visibility: undetermined
Wind direction: E ( 107 degrees)
Wind speed:  12 knots
Sea wave height: 3’
Swell wave height: 0’
Sea water temperature: 14°C
Sea level pressure:  1022.2 millibars
Cloud cover: 30% Partly cloudy,cumulus

Questions of the Day: What makes a scallop a predator? Is a scallop a carnivore, herbivore, or omnivore?  What is the scallop prey to?

Screen shot 2014-02-02 at 10.23.14 PM

Yesterday’s Answer:

Scallop Answers

Science and Technology Log

Facts About Sea Scallops* 

  • Largest wild scallop fishery in the world
  • Most valuable fishery in Northeast US
  • 2004 landings were about 28,000 meats (63 million lbs) worth over $300 million
  • Most landings come from about 300 vessels with “limited access” permits
  • Principal ports are New Bedford MA, Cape May NJ, Hampton Roads VA
  • Typical vessel is 70-90’ and uses two 15’ dredges
  • Most fishing occurs in the Mid-Atlantic area (Virginia to Long Island) and on Georges Bank
  • Sea scallops have an upper temperature tolerance of about 21 C.
  • Most important scallop predators are: sea stars, crabs and other decapods
  • Because they are filter-feeders, their main source of food is phytoplankton in the floor to surface water column.

*Thanks to Dvora Hart, Northeast Fisheries Science Center, for supplying the scallop information. 

On Monday, the ALBATROSS IV began surveying more open areas. Sunday’s 6 – midnight watch experienced very large catches as they sampled the closed areas from the Canada line westward. I got an opportunity to operate on a Goosefish in order to take a vertebrate sample. This will be used to determine the age of the fish. The catches are significantly small since we entered an open area for fishing.  With beautiful weather ahead of us, we should be able to continue to enjoy the sorting time as well as time on deck to relax. The weekly fire and abandon ship drills were held today.

Personal Log

Life at Sea 

Working two shifts makes it hard to fully stay awake,
But ignoring the wakeup call could be a big mistake.
So much to choose from when it’s finally time to eat,
Better be there when it is your time to get a decent seat.
Take a minute or two to rest while the ship is on a steam,
When it’s time to go to bed, enjoy that time to dream.

Melissa Fye, April 20, 2005

NOAA Teacher at Sea
Melissa Fye
Onboard NOAA Ship Hi’ialakai
April 4 – 25, 2005

Mission: Coral Reef Ecosystem Survey
Geographical Area: Northwest Hawaiian Islands
Date: April 20, 2005

Location: Latitude: 23*36.3’North, Longitude: 164*43.0’W

Weather Data from the Bridge
Visibility: 10
Wind Direction:90
Wind Speed: 14 knots
Sea Wave Height: 2-4 feet
Swell Wave Height: 5-7 feet
Sea Level Pressure: 1018.8
Cloud Cover: 2/8 Cu, As, Si
Temperature outside: 24.4

Science and Technology Log

Early before daybreak we arrived at Nihoa island to conduct a CTD cast (conductivity, temperature, and depth measurements).  By three o’clock a.m., the HI’IALAKAI began running north/south and east/west survey lines of the ocean floor. The ship continued throughout the day, surveying the ocean floor using the multibeam system for benthic habitat mapping.

Personal Log

The trip is winding down and as the end approaches, I am finishing my interviews with the crew of the HI’IALAKAI.  I sent out word that I would take anything that anyone has to give away. Several of the officers and crew have been kind enough to give me CDs of past diving trips, maps, and photographs taken on board that I may have missed. I have been reading some of the weather and ocean resources aboard also. We did have an unexpected visitor aboard today. A four foot Wahu fish was caught on the chief steward’s fishing line and filleted for dinner. Its scales were a silvery blue/green color and it had rows of very sharp teeth. I’ve included pictures of it in this log.  I also concluded some interviews with other members of the scientific team. Information on scientists Scott Ferguson, Kyle Hogrefe, Emily Lundblad, Jonathan Weiss, and Rob O’Connor are included in this log.

Lead Scientist Scott Ferguson works for the University of Hawaii and acts as a contract scientist for NOAA. He is originally from Colorado and Tennessee and went to college in Boston. While in high school, he remembers becoming interested in oceanography and also recalls opening a National Geographic Magazine as an adolescent, which contained hand drawn maps of the ocean and may have subsequently planted the seed for his current specialization in benthic habitat mapping. He obtained a degree in biology, specializing in genetics, while an undergraduate student in Boston. His current assignment is based on grant work submitted by a group of scientists to collect data, based on the most available science, about the sea floor in the Northwestern Hawaiian Island chain. The data collected from this trip, which in turn will be made into maps, will be made available to any managers of the various resource management groups (including the Fisheries Department, state agencies, agencies which protect sea turtles, monk seals, etc.). Nautical charts available at this time are inadequate for use for management of resources in the area, so the multibeam sonar and the scientists aboard have been collecting much more detailed data about the ocean floor for these agencies.  The information gathered will determine fishing guidelines, etc., and will help determine boundaries for sanctuary designation of this ecological system. Mr. Ferguson finds this career interesting because it is not routine and provides opportunities for problem solving. The tool he uses most is the computer to collect data.  He comments that someone interested in this field of science should build knowledge through mathematics courses, computer classes, and be able to express themselves well through written medium. Persons who consistently pay attention to detail and are inquisitive are well suited to this work, according to Mr. Ferguson.  Mr. Ferguson and his wife, scientist Joyce Miller, will spend 3-4 months a year on assignment in the Pacific Ocean.  As an added side note, he, his wife, and their cat take up permanent residence on a boat when not working in the office or out to sea!

Marine Ecosystem Specialist, Kyle Hogrefe, spoke to me in an earlier log about the Ghost Net Project and marine debris trips he has taken part in. I took the time today to interview him more thoroughly about the work he does.  Mr. Hogrefe is originally from Medina, Ohio and obtained an undergraduate degree from the University of Colorado in environmental science.  He has worked as a debris specialist, fisheries observer in Alaska, and taken jobs related to data management and mapping to increase his knowledge base. His duties on this cruise involve the deployment and retrieval of oceanographic data platforms.  His job is important because these devices collect long term data about ocean currents, temperatures, etc. which may effect populations of aquatic species of plants and animals over time. Mr. Hogrefe comments that the best part of his job involves the sense of adventure, travel, and diving he gets to do. He comments images from childhood watching Jacques Cousteau may have led to his career choice.  He will spend roughly 6 months at sea this year and the drawbacks of his career involve time away from friends and family. The tool he uses most often is his brain to make decisions and a physical piece of equipment he utilizes often is a lift bag. Patience and an ability to put personal differences aside while working with colleagues are attributes one should possess; according to Scientist Hogrefe.

GIS (Geography Information Systems) scientist Emily Lundblad is originally from the state of Texas and has a master’s degree in Marine Resource Management. Her interest in mapping was sparked from a guest speaker who spoke at her high school. It is a very math/science oriented field and the computer is her most important tool.  She believes the best part of her job is the travel and the ability to see the application of her work. She enjoys going to sea to help collect the data, whereas she would normally just edit and process it. Miss Lundblad will take part in three cruises at sea this year to help collect mapping data.  She mentions that her job on land requires normal eight hour days, but time at sea is different , requiring 12 hour shifts.

Sea floor mapping specialist Jonathan Weiss is a Northern Virginia native, originally from Alexandria, and a graduate of William and Mary. His undergraduate degree is in Geology and he received a graduate degree in Marine Geology from the University of Hawaii. He comments that he has always been curious about the earth and its structure and that research on plate tectonics has revolutionized this field of scientific research. His job requires him to work on backscatter to process the imagery data about the sea floor texture and his most important tool is the computer.  He encourages anyone interested in this line of work to take lots of math courses and a broad overview of the sciences. He enjoys his first post graduate job because the hours are flexible enough for hobbies (like surfing), his bosses are encouraging, and he works with many people his own age. He will spend roughly four months at sea this year in the field.

Rob O’Connor, GIS specialist, originates from Texas but has spent most of his life in Maui, Hawaii. His educational background includes an undergraduate degree in Geography from the University of Hawaii. He comments that the computer is also his most important tool for his job and that he became interested in aspects of the earth after taking some introductory geography courses in college. His duties include data processing and cartography (map making). The travel is an added benefit for this line of work and Mr. O’Connor adds that a person should possess good interpersonal skills and computer knowledge to be successful in this occupation.  This is his first cruise of the year as a GIS specialist.

QUESTION OF THE DAY: I have seen many sea creatures around the Northern Hawaiian Islands coral reef ecosystem. Animals such as the whitetip shark,  sea turtles, and monk seals. These animals are all living things that eat other living things for energy. In a food web, they are called _______________________.

ANSWER TO YESTERDAY’s Question: Ms. Fye saw a humpback whale near the starboard side of the ship the other day. It was performing an adaptive behavior.  Fill in the blank to find out what adaptation the whale was performing.  The movement of an animal from one region to another and back again is called migration.