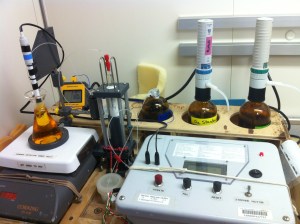
Christina Peters: Update on Our Plankton Survey, July 16, 2013

NOAA Teacher at Sea
Chris Peters
Onboard NOAA Ship Oregon II
July 10 – 19, 2013

Weather and Location:
Time: 21:24 Greenwich Mean Time (5:24 p.m. in Rockville, MD)
Latitude:  29.1970
Longitude:  -85.9904
Speed (knots):  3.00
Water temperature:  28.10 degrees Celsius
Salinity (PSU = Practical Salinity Units): 34.07
Air temperature:  29.00 degrees Celsius
Relative Humidity:  68%
Wind Speed (knots):  17.15
Barometric Pressure (mb): 1018.96
Depth (m) = 187.2

As you can see if you have been following the Ship Tracker website, we have been making our way back towards Pascagoula.  We still have some stations to work, and won’t be reaching the dock until Friday morning, but we will continue to head in that direction.  The weather has gotten a bit windier, with much larger swells over the last couple of days.  This has made collecting the plankton even more interesting.  With the wind frequently above twenty knots, handling the equipment becomes much more dangerous.  Some procedures need to be changed a bit for the sake of safety.  Luckily, the deck crew, Tim, James, and Chuck, are on top of things.  They are pretty funny to work with, too!

Our deck crew
Our deck crew – James, Tim (chief boatswain), and Chuck

Science and Technology Log

Water Titrations to Check Cissolved Oxygen Levels

The plankton stations have continued, with the biggest changes being how much sargassum (seaweed) we have needed to rinse out and go through, and the different kinds of tiny animal life we have observed.  I mentioned in an earlier blog that the scientists must periodically do water titrations to verify that the readings taken from the CTD are correct and nothing is malfunctioning.  I had an opportunity to perform some real chemistry as Kim Johnson, the chief scientist, walked me through the water titration steps.

First we had to collect the water samples from the CTD.  Remember, we are testing the oxygen levels, so it is important to collect the water samples without allowing bubbles to form, which might add oxygen to the sample.  You would be surprised at how hard this is!  A flexible tube is attached to one of the three Niskin Bottles on the CTD tank, and before any water is put into the jars, all of the air bubbles in the tube must be squeezed out.  This is an art!  Then the water can be transferred to the jars through the tube, holding the end of the tube against the side of the beaker to avoid making bubbles.  The stoppers are then gently put into the glass jars, again to avoid the addition of oxygen to the samples.  It is important to keep the water samples from getting too hot if you are not going to do the titrations right away.  Can you think of why heat might create a problem when doing a titration?  Also, we test three samples.  Why do you think testing three beakers is important?

Now we are ready to start the mad chemist part!  The chemicals used, and their amounts, are very specific, and the directions are posted in the lab so that you can always check your memory.  First, two milliliters of manganous sulfate is added to each sample.  The stopper is replaced after adding each substance, and the jars are turned upside down and back several times to mix the solution. The second substance added is two milliliters of azide-iodide solution.  After the solution is gently mixed, the jars need to stand for ten to twenty minutes.  When you come back after twenty minutes, you will see that there is a cloudy substance in each jar.  This first part of the process causes the chemical bond between the hydrogen and the oxygen to break, and the oxygen forms new bonds with the added chemicals.

Adding chemicals
Using the pipettes to add the chemicals to the water
After initial chemicals are added
A cloudy substance forms after the manganous sulfate and azide-iodide are added and mixed.

At this point, the oxygen is fixed and we don’t need to worry about introducing more oxygen to the samples.  Next, we added two milliliters of sulfuric acid to each jar.  This must be done very carefully because sulfuric acid is very harmful.  However, once it is added, the sulfuric acid is neutralized and the solution in the sample jars is not harmful.  (Remember the acid/neutral/base tests we did in class with lemon juice, vinegar, and Alka Seltzer, using a pH scale?)

Sulfuric acid
The sulfuric acid changes the color, and after mixing, causes the cloudiness to disappear.

Now we have a yellowish liquid and I will be adding phenylarsine oxide, drop by drop. This is the titration part. When the color turns clear, we can look at how much phenylarsine oxide was needed and that will tell us how much dissolved oxygen was present in the sample. This new chemical will bond with the oxygen molecules and cause a color change. However, because the change from yellow is hard to see, I added one milliliter of a starch solution for the only purpose of turning the sample blue.  This way the color change back to clear is easier to see.

Starch is added
Notice the color change after the starch is added (the blue beaker).

The sample is poured into a wide-mouthed beaker and a magnetic stirrer is added to the beaker.  This is a small, magnetic bar that spins when it is on the metal stand.  Drops of the phenylarsine oxide are allowed to slowly drip from a burette into the sample.  A burette is a very tall, thin, glass pipe-like container that allows easy adjustment of the flow of liquid, and allows for easy reading of very small amounts.

Titration 1
The burette is allowing the phenylarsine oxide to mix with the water solution, one drop at a time.

Once the sample starts to lose its color, you know you are close. One or two more drops and you will shut the valve on the burette and read the amount that was mixed into the sample.

Titration 2
Notice the color change towards the end of the titration.
Titration complete
Once the color change is complete, the titration is finished, and the burette is read for the dissolved oxygen content.

My samples showed dissolved oxygen amounts of 6.4, 6.5, and 6.5 milligrams per liter.  The CTD showed dissolved oxygen of 6.4 mg/l.  Since our results were very close, we are confident that the CTD is working well.

Remember, levels below 2% are considered hypoxic.  6.4% is a very healthy dissolved oxygen reading. This is what we expect as we move further from developed land, but it is still reassuring to see the healthy levels.

Later I tried another titration without supervision and found consistent readings of 4.9 mg/ mg/l oxygen.  However the CTD reading was 4.35 mg/l.  I guess I need more practice! 

Buoy Rescue Mission

 Yesterday we had the opportunity to participate in a buoy rescue mission.  Another organization had deployed a wave buoy, or a wave runner, in the middle of the Gulf of Mexico that had been damaged, and was no longer able to give correct readings on things like current and wave height.  We were in the area, and agreed to retrieve the buoy.  As we got closer to the GPS signal, we spotted a large orange ball with an eight foot (about) antenna sticking out of it.  Oregon II’s small motor boat was launched and we set about collecting the buoy.

As we reached it, the deck crew and the CO noticed some things about the buoy that were inconsistent with the description.

Wrong buoy
Wrong buoy!

After making a telephone call, the CO told the crew to come back to the ship.  We had come across the wrong buoy!  Off we went in search of the correct one, which we found about half a mile away.  This one looked more like a surfboard and was fairly easy to get aboard the ship, using the crane.  That mission was accomplished, but we all marveled at the odds of finding two wave buoys within half a mile of each other in the middle of the Gulf of Mexico!

Weather buoy rescue
Using the crane to lift the wave runner onto the deck.
Chuck Godwin and Officer Matt , who helped rescue the wave runner
Chuck Godwin and LTJG Matthew Griffin, who helped rescue the wave runner
Both parts of the wave runner
The part of the wave runner that looks like a surfboard sits on top of the water and has solar panels. It is attached to the slatted part that acts as a glider, and uses wave energy as it rises and falls to propel the board through the water.

Personal Log

 A Week at Sea

While I am still enjoying the cruise and the work, I have had a few days of queasiness.  Taking the seasick medicine helps a lot, so I am sticking with that for a few days.  Nights have been fine, and the rocking of the ship really is like being rocked in a cradle.  I hope I’ll be able to sleep when I am in a stationary bed back home!

Being on a cruise on a small ship brings me back to my days of living in a college dormitory.  You are living in very close quarters, eating every meal together, spending large amounts of time together, and really getting to know the people who are on your watch.  I have had a great group to work with – people with a lot of knowledge, and great senses of humor!  Victoria, a college intern, has been a newbie with me.  We have learned a lot from the other scientists, Andre and Joey, on our watch, as well as from our chief scientist, Kimberley Johnson.  Tim, James, and Chuck are the deckhands on our watch, and they do most of the heavy work, like lifting the equipment and running the J frame, winches and cranes.  Sometimes we are working with the equipment for forty-five minutes at a time.  The deckhands, while very serious about safety, keep us laughing the entire time.  As I am finishing this entry, we are heading towards home.  It will be nice to be on land again, but I will also miss the many different personalities I was lucky enough to get to know. 

Did You Know?

The Gulf of Mexico covers an area that is about 615,000 square miles.

An area named “Sigsbee Deep” is located in the southwestern part of the Gulf.  It is more than 300 miles long and more than 14,383 feet deep at its deepest point.  It is often referred to as the “Grand Canyon under the sea”.

Sigsbee Deep
The Sigsbee Deep is the darker blue area in the Gulf of Mexico.
Photo credit to http://www.worldatlas.com/aatlas/infopage/gulfofmexico.htm

The Gulf’s coastal wetlands cover over five million acres, which is an area equal to about one-half of the area of the U.S.  It is the home to twenty-four endangered and threatened species and critical habitats.

It is estimated that 50% of the Gulf’s inland and coastal wetlands have been lost and that up to 80% of the Gulf’s sea grasses have been lost in some areas.  The continual loss of wetlands (about a football field a year) around the Mississippi Delta, a large land area near where the Mississippi River flows into the Gulf of Mexico, changes how hurricanes impact the coast of the Gulf.  With fewer wetlands to absorb the impact of the hurricane, the hurricanes hit the populated areas with much greater force.

For more facts about the Gulf of Mexico, visit http://www.noaanews.noaa.gov/stories2012/20120516_okeanusexplorer.html or

www.habitat.noaa.gov/media/news/pdf/gulf-of-mexico-review_final.pdf‎

Thank you for visiting my blog.  I hope you will check back in a few days for an update!
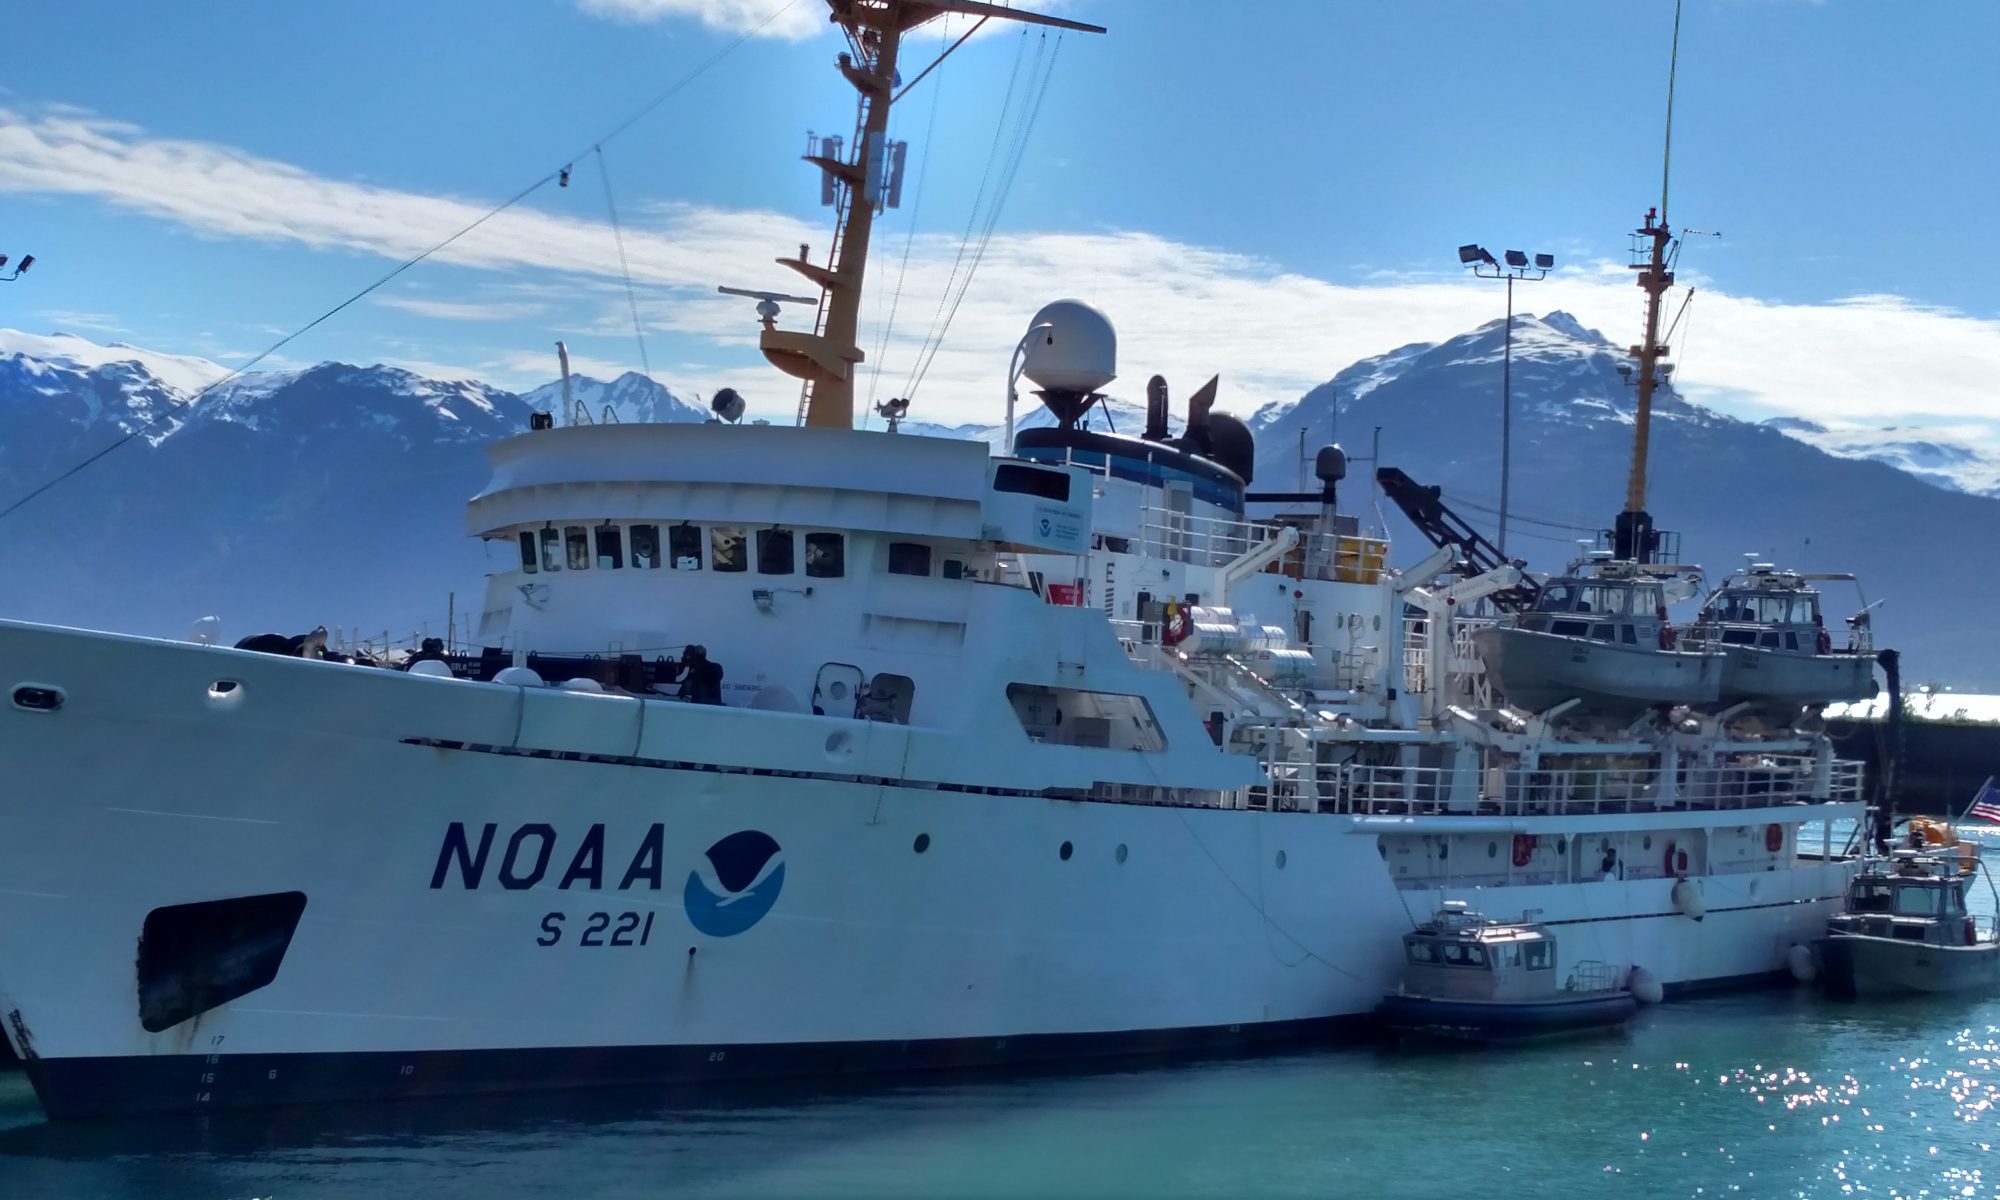
Amanda Peretich: Sad Times With This, My Final Blog, July 22, 2012

NOAA Teacher at Sea
Amanda Peretich
Aboard Oscar Dyson
June 30 – July 18, 2012

Mission: Pollock Survey
Geographical area of cruise: Bering Sea
Date: July 22, 2012

Bottles
Water collection bottles with samples from CTDs throughout the cruise.

Location Data
Myself: airports, airplanes, and Maryland
Oscar Dyson: Crowley pier in Dutch Harbor, AK

Science & Technology Log
On July 17, as we were “cruising” around 12 knots back to Dutch Harbor, Alaska, I had one more GREAT tie in to chemistry class that I just wanted to share because it was that cool to me! Every few CTDs, a water sample would be collected to later be tested for levels of dissolved oxygen. At the end of the cruise on our way back, Bill allowed me to watch him test those samples using a Winkler titration.

Why do we care how much dissolved oxygen is in the water in the first place? Dissolved oxygen levels provide an excellent indication of the underwater biological activity. If levels are extremely low (2 mg/L or lower), animals fail to survive during this “hypoxia”. If there is no dissolved oxygen at all (0 mg/L), this is known as “anoxia”, meaning without oxygen. Areas that are hypoxic or anoxic are known as “dead zones”. Luckily there aren’t really any reported dead zones around Alaska, but knowing the level of dissolved oxygen is important to the scientists as another piece of data to analyze from this cruise.

How does the Winkler titration work and why did I find it so cool? First off, in chemistry class, we use a buret to add a titrant manually drop by drop into a solution containing a phenolphthalein indicator that turns from clear to pink to signify the endpoint of the titration. On board, the actual titration is automated and there is no indicator! It was nice to see chemistry in action, and even nicer to see the process automated, removing any human error in the actual titration.

Winkler titration
Set-up for the Winkler titration on the Oscar Dyson.

Steps to performing the Winkler titration on the Oscar Dyson:
1. Collect water sample during CTD and add manganese chloride (MnCl2) and sodium iodide/sodium hydroxide solution (NaI/NaOH) to sample. Stopper and mix well.
2. Store all water samples for testing at the end of the cruise (this is how it’s done on the Oscar Dyson to test all samples at once, although you could test them each individually after collection).
3. When ready to test all samples, remove stopper and add magnetic stir bar and 1mL of sulfuric acid (H2SO4). Mix well. If precipitate does not completely dissolve, add more sulfuric acid.
4. Titrate and record results!
5. Repeat steps 3 and 4 for each sample 🙂

Winkler titration bottles
(a) The addition of excess manganese, iodide, and hydroxide ions added to each water sample forms a precipitate (solid), which is then oxidized by the dissolved oxygen in the water sample.
(b) and (c) A strong acid acidifies the solution and converts the iodide ion (I-1) into an iodine molecule (I2), causing the precipitate to dissolve (b) and the solution to turn brownish-orange (c).
(d) The solution is put on top of a stir plate and titrated with a thiosulfate solution. The titration is complete when the solution is neutralized, or there are no more ions remaining in solution. This is determined by measuring the conductivity of the solution because ions allow conductivity so when the solution is neutralized, there will be no conductivity. You can see the conductivity probe in the top of the solution on the right and the thiosulfate being added into the solution through the tube on the left.

Personal Log
My final days/adventures in Dutch Harbor? Enjoy the brief descriptions and photos below!

July 18
– arrived in Dutch early morning to beautiful blue skies all day and I watched as the Dyson docked at Crowley pier
– another Alaskan water adventure when Brian and I donned arctic survival suits, got in Captain’s Bay, and yelled up drafting readings of the water level from various points on the outside of the ship to Neal (while Chelsea took photos)
– went for a run over to Unalaska to see the Russian Orthodox church, walk along the beach, go to Memorial Park, check out some gravestones, and jog around town
– hung out in Dutch with some people off the Dyson, where Brian turned into Billy Idol, Chelsea got a new ‘do, and Kevin got a haircut

July 18: Dutch Harbor, Alaska

July 19
– the day started off looking bleak, and I got covered in mud running back into Captain’s Bay to check out the gigantic oil rig barge
– then it turned into another afternoon of beautiful blue skies to allow me to hike with Brian to the back of Captain’s Bay and up to a really pretty waterfall
– hung out in Dutch with some locals I’d met the night before, including an Aleut with the nose ring and face tattoo

July 19: Dutch Harbor, Alaska

July 20
– was supposed to fly out this afternoon but lo and behold, the skies turned gray, the fog rolled in, all flights in and out of Dutch were cancelled for the day, and I headed back to the ship
– hung out in Dutch with some people off the Dyson and celebrated Patrick’s birthday

July 20: Dutch Harbor, Alaska
July 21: Anchorage airport

July 21
– attempted to get on flights from standby multiple times throughout the day, and finally got on a flight at 8:45pm that got me to Anchorage after midnight, where I slept on a bench in the airport until about 4am

July 22
– no flights out of Anchorage available until almost 9pm! luckily I called Delta, got on standby for a 6am flight where enough people took a later flight (and everyone on standby ahead of me was in pairs) that I got out of Anchorage and to Minneapolis, where I had about 35 minutes to get on standby for another flight that I was able to get on as well; the flight goddesses were with me today
– arrived home to Maryland about 20 hours after leaving Dutch, happy to be back but sad this adventure is officially over

THANKS THANKS THANKS
I’d just like to say one last time how AMAZING this adventure was on the Oscar Dyson and how incredibly BLESSED I was to meet such great people and learn some many new and EXCITING things. I owe a huge amount of thanks to plenty of people:
* Thanks to the chief scientist Neal along with Bill and Anatoli for all of the fun science and fish stuff I learned during my shift
* Thanks to the rest of the science party (Scott, Denise, Carwyn, and Nate) for more science and technology that I learned and for the card games I played after my shift and to Kathy for doing her survey tech thing (and helping me find my luggage and get to the airport on time)
* Thanks to the CO CDR Mark Boland for allowing me to be on the OD in the first place and for always seeming to have a smile on your face when I was around
* Thanks to the XO 1M Kris Mackie for all of his help in getting me to the ship, for never sugar-coating life, for a great espresso machine in the galley, and for life lessons, knowledge, and personal growth he probably doesn’t even know he taught me

* Thanks to the OPS LT Matt Davis for reading and approving all of the blogs and for the vast amount of knowledge I gained from him in multiple aspects of ship life
* Thanks to ENS Libby, Kevin, and Chelsea for plenty of information, stories, good laughs, and great memories
* Thanks to LTJG Dave for recommending thought-provoking movies and answering all my questions
* Thanks to the engineering crew (Brent, Tony, Vincente, Garry, Robert, Terry, Joel) for all of their hard work that kept the ship running during the entire trip and for everything you guys taught me
* Thanks to Vince for keeping the internet up and running so I could update my blogs, get on facebook, and let my parents know I was still alive with the VOIP
* Thanks to the stewards Tim and Adam for some of the best cooking I’ve had in a long time and for “encouraging” me try things I didn’t think I liked but wound up enjoying because you made them so delicious
* Thanks to the deck crew (Willie, Patrick, Deeno, Jim, Brian, and Rick) for putting up with my incessant chatter, photo taking, curiosity, and questions, for letting me crash your table at mealtimes, and for every little thing that you’ve each taught me, even if you didn’t know you were teaching me something at the time
* Thanks to GVA Brian for all the photos he took whenever I asked, for the awesome headphones he let me borrow most of the trip, for the knowledge he shared about everything he knew related to boats and fishing, and for adventures kayaking, taking draft readings, and hiking in Dutch
* Thanks to the NOAA Teacher at Sea program for providing this incredible opportunity in the first place
* Thanks to everyone that has been reading (and sometimes commenting on) my blogs

NOAA Oscar Dyson in Captains Bay, Dutch Harbor, AK

Stacey Jambura: The Salty Seas, July 11, 2012

NOAA Teacher at Sea
Stacey Jambura
Aboard NOAA Ship Oregon II
July 6 – 17, 2012

Mission: SEAMAP Summer Groundfish Survey
Geographical Area of Cruise: Gulf of Mexico
(You can view the NOAA ShipTracker here: http://shiptracker.noaa.gov/shiptracker.html)
Date: July 11, 2012

Weather Details from Bridge: (at 19:45 GMT)
Air Temperature: 29.90 ◦C
Water Temperature: 29.40 ◦C
Relative Humidity: 64%
Wind Speed: 3.56 kts
Barometric Pressure: 1,014.90 mb

.

Science and Technology Log

The CTD

Deploing the CTD
Deploying the CTD

This device is the first to be deployed at every sampling station. CTD stands for *Conductivity *Temperature *Depth. The salinity (the amount of salt in the water) is measured by looking at the conductivity. Salt has ions. Ions are like little electrical charges that are either positively charged or negatively charged. By measuring how many electrical charges (ionic charges) there are in the salt, we can measure how conductive the water is which will also tell us how much salt is in the water. This data is measured by the CTD and is transmitted by an electrical pulse. The depth is measured by the amount of pressure being pressed upon the device as it is lowered into the water. The temperature is measured by a temperature gauge. All of the data collection devices are attached to a large metal rosette wheel.

J-Frame
The J-Frame

The frame is lowered into the water using a thick cable that is attached to a J-Frame (a large yellow arm that can be raised and lowered.) The cable runs through a pulley attached to the J-Frame to make sure the deployment of the CTD runs smoothly.

The CTD also measures dissolved oxygen levels (the amount of oxygen in the water). There is also a fluorometer which measures the amount of chlorophyll (phytoplankton activity) in the water.

As soon as the CTD is released into the water it begins collecting data. Data is collected continuously as it is lowered toward the ocean bottom. The data is sent through a very thin wire that transmits the data to one of the computers in the dry lab where it is documented for later analysis.

CTD Water Testing
Here I am collecting water samples from the CTD.

The CTD has three water collection Niskin bottles (large grey cylinders). Niskins are named after Shale Niskin who developed this bottle. Water collections using the Niskins are controlled by a computer in the dry lab. One click on a computer and the CTD will automatically snap shut the bottles. Older versions that were not controlled by computers had heavy metal messengers that were lowered down a string toward the collection bottle. When the messenger reached the top of the bottle, it would hit a trigger and snap the bottle shut.

Water collection does not occur at every sampling station, but when it is planned, the water is collected at the bottom. This is because we are focusing on the bottom of the ocean during this survey. We want to test the water at this depth to better understand the environment in which the organisms we are collecting live in and make predictions as to how human and nonhuman influences may harm this benthic (bottom) community. The water can be used for several different tests, but we use it to test the dissolved oxygen levels of the water.

Measuring dissolved oxygen levels is important because if it is extremely low — called “hypoxia” (2 mg/L or lower) — animals fail to survive. If dissolved oxygen is not present (0 mg/L) it is called “anoxia”. Hypoxic or anoxic areas are frequently referred to as “dead zones”.

Digitally measuring dissolved oxygen levels

Although the CTD has a digital device that measures the dissolved oxygen (DO) levels, we manually test the water for DO once a day to make sure that the CTD is calibrated correctly and that there are no malfunctions that need to be fixed. There are two different ways we manually test the water. One is by using a hand-held dissolved oxygen meter. This meter digitally calculates the dissolved oxygen levels. We lower this meter directly into one of the Niskins.

Chief Scientist, Brittany Palm, Running Titration Tests
Chief Scientist, Brittany Palm, running titration tests to measure dissolved oxygen levels

We also collect water samples from each of the three Niskins in glass beakers. We use these samples to run what’s called a Winkler’s tritration test. This is a chemical-based test that tells us how much dissolved oxygen is in the water.It is important to run so many different tests because if we only used one method, we couldn’t know if it was accurate or not. By running three different tests, we can compare the results from all three. If the result from one test comes up differently than the others, we know that test was not accurate but the other two tests were.

After the CTD is brought back up on deck, it is important to rinse it off with fresh water. This is because the salt from the ocean can damage the equipment and corrode (eat away at) the metal. Once a day we also run Triton-X (a type of soap) through the hoses of the CTD to keep the sensors clean and salt-free.

Personal Log

Day 5 – July 9th

Today was a bit slower because our sampling sites were father apart than they were on previous days. We continued collecting and preserving plankton, but trawling is the most exciting because you get to see so many different species. We conducted only one trawl today and it was a very small catch. It didn’t take long to collect all of the data we needed before we were back to waiting for our next plankton collection site. We had some interesting fish in our trawl including a small bat fish, a couple of starfish, several sea urchins, and a honeycomb moray eel. The highlight of my shift was during our last plankton trawling. It was around 21:00 (or 9:00 pm) so it was pitch black out with the only light coming from the ship and the stars. We started seeing a lot of flying fish jumping out of the water. We soon realized it was because a pod of spotted dolphin had found them. It was fun watching them jump and fly though the water to catch the fish. The group also had a couple young dolphins that stuck close to their mothers. I’d seen dolphins before, mostly in captivity or ones too far away from a boat to see clearly, so it was really neat to see them so close up!

Day 6 – July 10th

Today started out great. I woke up to get ready for my shift by heading down to the mess for lunch. It was one of my favorite meals – Mexican! When I read about other teacher’s experiences on NOAA ships and how great the food was I now understand what they were talking about! There is so much yummy food at all of the meals that it is frequently hard to decide what NOT to eat! And there is so much food available at each meal that you’ll never go hungry! I always end up walking away stuffed!

Stormy Seas
Stormy Seas

The weather was great up until the sun set. We were stuck in quite the thunderstorm. When there are storms with lightning in the area, no one is allowed out on deck for safety reasons.

We had to postpone a couple of our sampling stations until the storm passed over us, so we tried our best to keep ourselves occupied until the storm passed. Our internet went down for length of time, so we were left with books, movies, or just some relaxation time.

By the time the storm had passed, we had only one sampling station to complete before it was time for the next watch team to switch in.

.

Day 7 – July 11th

Storms
Storms on the horizon

The first thing I noticed today was the panoramic view of large cumulus and cumulonimbus clouds – those are the clouds that produce thunderstorms. We managed to steer clear of them, but they certainly made some pretty skies.

We had a couple trawling stations which was great because it is always fun to discover and examine more species. While the trawls were small, we had some cool finds including a frogfish, a butterfly fish, and a black-nose shark.

Toadfish
Holding a frogfish
Black-Nose Shark
Holding a black-nose shark

A highlight from today was the full rainbow that graced our skies after dinner. I can’t recall ever seeing a full rainbow before so it was really cool to see one!

Rainbow
Rainbow across the bow of the Oregon II

Did You Know?

Our CTD weighs about 200 pounds. On its current settings it can be deployed to a depth of up to 5,000 meters, but if we adjusted the settings it could go as far down as 10,000 meters! With all of the attachments and the steel cage, our CTD costs roughly around $100,000 to purchase. That’s why we have to handle it with care!

CTD
The CTD

Wes Struble: Analysis of Water Samples, March 4, 2012

NOAA Teacher at Sea
Wes Struble
Aboard NOAA Ship Ronald H. Brown
February 15 – March 5, 2012

Mission: Western Boundary Time Series
Geographical Area: Sub-Tropical Atlantic, off the Coast of the Bahamas
Date: March 4, 2012

Weather Data from the Bridge

Position:30 deg 37 min North Latitude & 79 deg 29 min West Longitude
Windspeed: 30 knots
Wind Direction: North
Air Temperature: 14.1 deg C / 57.4 deg F
Water Temperature: 25.6 deg C / 78.4 deg F
Atm Pressure: 1007.2 mb
Water Depth:740 meters / 2428 feet
Cloud Cover: 85%
Cloud Type: Cumulonimbus and Stratus

Science/Technology Log:

In the previous log I described a CTD cast in detail from start to finish. Now that the CTD platform is on the deck of the Ron Brown the actual sampling process can begin. The CTD has a number of Niskin bottles holding a little more than 10 liters of water each. Water samples from each bottle must be collected and analyzed for various parameters which could include: Salinity, Oxygen content, Inorganic carbon, and others. On this cruise most of the CTD casts were sampled for both salinity and dissolved oxygen.

The first step in measuring salinity involves a careful rinsing of the sample bottles. After a standard three rinses, the bottle is filled and the depth from which the water was sampled is recorded for each bottle.

As a beautiful western Atlantic sunset falls on the Ron Brown another night of CTD's begins
I prepare a water sample for dissolved oxygen analysis after a CTD Cast at 2:00 am
The dissolved oxygen analysis lab station in one of the science labs on the Ron Brown

The full sample bottles are then either taken to the dissolved oxygen lab station or the Salinity lab station for analysis.

A close-up of the amperometric titration apparatus for analysis of dissolved oxygen in one of the science labs on the Ron Brown. A solution of Manganese Chloride and a combination of Sodium Hydroxide/Sodium Iodide is added to the water sample to sequester the oxygen and then when the temperature is stable the solution is amperometrically titrated with thiosulfate.
The Ron Brown off the starboard stern from the workboat
The "climate airlock" leading to the salinity analysis lab. The airlock helps keep the water samples under constant temperature and humidity conditions.
The two Autosals in the Salinity lab. These are precision instruments for measuring the salinity of seawater
A east-west cross-section across the eastern Atlantic Ocean. The eastern US coast is at left. The diagram illustrates north (reds)-south (blues) movement of the Antilles and Deep Western Boundary Current. Vertical scale in meters horizontal scale in 100,000 meter units (100 kilometers)

Lindsay Knippenberg: Oceanography Day! September 11, 2011

NOAA Teacher at Sea
Lindsay Knippenberg
Aboard NOAA Ship Oscar Dyson
September 4 – 16, 2011

Mission: Bering-Aleutian Salmon International Survey (BASIS)
Geographical Area: Bering Sea
Date: September 11, 2011

Weather Data from the Bridge
Latitude: 58.00 N
Longitude: -166.91 W
Wind Speed: 23.91 kts with gusts over 30 kts
Wave Height: 10 – 13ft with some bigger swells rolling through
Surface Water Temperature: 6.3 C
Air Temperature: 8.0 C

Science and Technology Log

On a calm day letting out the CTD is easy.

Today Jeanette and Florence took me under their wing to teach me about the oceanographic research they are conducting onboard the Dyson. At every station there is a specific order to how we sample. First the transducer, then the CTD, then numerous types of plankton nets, and then we end with the fishing trawl. The majority of the oceanographic data that they collect comes from the CTD (Conductivity, Temperature, Depth). The CTD is lowered over the side of the ship and as it slowly descends to about 100 meters it takes conductivity, temperature, and depth readings. Those readings go to a computer inside the dry lab where Jeanette is watching to record where the pycnocline is located.

The results from the CTD. Can you spot where the pycnocline is?

The pycnocline is a sharp boundary layer where the density of the water rapidly changes. The density changes because cold water is more dense than warm water and water with a higher salinity is more dense than water that is lower in salinity. So as the CTD travels down towards the bottom it  measures warmer, less salty water near the surface, a dramatic change of temperature and salinity at the pycnocline, and then colder, saltier water below the pycnocline. Once Jeanette knows where the pycnocline is, she tells the CTD to collect water at depths below, above, and at the pycnocline boundary. The water is collected in niskin bottles and when the CTD is back on deck Florence and Jeanette take samples of the water to examine in the wet lab.

Filtering out the chlorophyll from the CTD water samples.

Back in the lab, Jeanette and Florence run several tests on the water that they collected. The first test that I watched them do was for chlorophyll. They used a vacuum to draw the water through two filters that filtered out the chlorophyll from the water. As the water from the CTD passed through the filters, the different sizes of chlorophyll would get stuck on the filter paper. Jeanette and Florence then collected the filter paper, placed them in labeled tubes, and stored them in a cold, dark freezer where the chlorophyll would not degrade. In the next couple of days the chlorophyll samples that they collected will be ran through a fluorometer which will quantify how much chlorophyll is actually in their samples.

Jeanette collecting water from the CTD.

Besides chlorophyll, Jeanette and Florence also tested the water for dissolved oxygen and nutrients like nitrates and phosphates. All of these tests will give the scientists a snapshot of the physical and biological characteristics of the Eastern Bering Sea at this time of year. This is very important to the fisheries research because it can help to determine the health of the ecosystem and return of the fish in the following year.

Personal Log

One of the high points for me so far on the cruise has been seeing and learning about all the new fish that we catch in the net. We have caught lots of salmon, pollock, and capelin. The capelin are funny because they smell exactly like cucumbers. When we get a big catch of capelin the entire fish lab smells like cucumbers…it’s so weird. We have also caught wolffish, yellow fin sole, herring, and a lot of different types of jellyfish. The jellies are fun because they come in all different shapes and sizes. We had a catch today that had some hug ones and everyone was taking their pictures with them.

Now that is a big jelly fish.

Today we also caught three large Chinook or king salmon. Ellen taught me how to fillet a fish and I practiced on a smaller fish and then filleted the salmon for the cook. What is even cooler was that at dinner we had salmon and it was the fish that we had caught and I had filleted. Fresh salmon is so good and I think the crew was happy to get to enjoy our catch.

The catch of the day was a 8.5 kg Chinook salmon.
Salmon for dinner, filleted by Lindsay.

What else did we catch?
Walleye Pollock
Walleye Pollock
A juvenile Wolffish
A juvenile Wolffish
Yellow Fin Sole
Yellowfin Sole
 A squid
A squid
Herring
Herring
Lots of little Capelin

Heather Haberman: Gulf Water Health, July 12, 2011 (post #4)

  • NOAA Teacher at Sea
    Heather Haberman

    Onboard NOAA Ship Oregon II
    July 5 — 17, 2011

Mission:  Groundfish Survey
Geographical Location:  Northern Gulf of Mexico
Date:  Tuesday, July 11, 2011

Weather Data from  NOAA Ship Tracker
Air Temperature: 29.5 C   (85.1 F)
Water Temperature: 29.8 C  (85.6 F)
Relative Humidity: 76%
Wind Speed: 2.09 knots

Preface:  Scroll down the page if you would like to read my blog in chronological order.  If you have any questions leave them for me at the end of the post.

Question of the Day:  Are you seeing any oil rigs on your trip?

Answer:   There are so many oil rigs out here in the Gulf of Mexico that I can’t recall a time when I couldn’t see one.  Some are small and some are enormous.  I never realized that there were so many different engineering designs for oil rigs.  At night they are all lit up and it looks like a city in the sea out here.  All of the bright lights do pose some problems for migrating birds especially during bad weather when the are attracted to the lights.  The birds will often circle the lights to exhaustion or hit the structure so hard that it kills them.

Science and Technology Log

Topic of the Day:  How do researchers determine the health of the Gulf waters?

Science and Technology log:

You wake up in the morning and you don’t feel well.  What do you do?  Some people may stick a thermometer in their mouth to see if they have a fever.  Body temperature is a good indicator of illness or infection.  If you still don’t feel well after a few days you could visit a doctor who may check your eyes, ears, throat, blood pressure, etc.   Doctors can often figure out what’s making you sick by using certain tools and running tests.  Researchers do the same thing with the ocean.  In order to see how “healthy” the ocean is, measurements need to be taken.  Can you tell which trawl was from healthy water and which was from “sick” water?

0.5 kg (1.1 lbs) is all we got from this 30 minute trawl
Over 500 kg (1,100 lbs) of fish were collected in this 30 minute trawl.

Why aren’t we seeing a lot of marine life in certain parts of the Gulf of Mexico?  You don’t have to be a doctor to answer this question, but you do have to have some scientific tools to diagnose the problem.

On the Oregon II, a device called a CTD is used to take measurements such as conductivity (salinity), temperature, chlorophyll concentration, and dissolved oxygen (DO).  These water quality measurements let researches know what’s happening in the water just like a doctor would look at your test results to gage your health status.  Sometimes a doctor may need to do a second test just to confirm the results.  NOAA’s fisheries biologists do the same thing with their water quality assessments.  Winkler titrations and a hand-held Hack Dissolved Oxygen meter are used to confirm the dissolved oxygen readings from the CTD.  Scientists need to make sure the data they collect is accurate and the more tests they perform the better their data will be.

This large piece of equipment is a CTD sensor. The top portion of the machine contains three gray vertical cylinders which are used to collect water samples. Under the machine are sensors that test the water quality while it is submerged. Here I am washing out the sensors once it was brought back on board from a test.
When comparing data from this device to our trawl samples, it’s obvious that water with low levels of dissolved oxygen can not support much life.

Dissolved Oxygen: Marine animals need oxygen to survive just like land animals do.  The main difference is that most marine animals have gills which are able to diffuse oxygen molecules from the water directly into their blood.  Diffusion is the process of a molecule moving from an area of high concentration to low concentration.

Have you ever sprayed air freshener and noticed how the smell moves from where you sprayed it (high concentration) throughout the entire room (low concentration) until the smell is equally distributed throughout the room (equilibrium)?  That’s how diffusion works.

It’s very important to understand that the amount of dissolved oxygen MUST be higher in the water then inside of the animal’s body or diffusion of oxygen into the blood won’t take place.  This means the animals will either have to move or die.  This is what’s happening in the “Dead Zone” in the Gulf of Mexico.

The reason levels of oxygen are so low in the Gulf of Mexico are due in part to human actions.  The overuse of fertilizers that are high in nitrates and phosphates are one of the major problems.  When it rains or floods, these extra nutrients wash off of our lawns and into storm drains which then drain into the rivers.  Most of the Mississippi watershed consists of agricultural land in the breadbasket of the Midwest where a lot of fertilization takes place during the spring and summer months. All of the nutrients from the rivers in the Mississippi watershed eventually empty out into the Gulf of Mexico.

Mississippi Watershed: The area of land that drains into the Mississippi River and out into the Gulf of Mexico.

These nutrients help the aquatic plants grow, just as they helped our lawns and crops grow.  Now you may be thinking “In the last blog you talked about how important aquatic plants are when it comes to oxygen production.”  Indeed they do make oxygen, but as all of these plants die and sink to the bottom of the sea, bacteria feed on (decompose) their remains and use up the available oxygen in the process.  More oxygen is consumed by these aerobic bacteria than was made by the plants which is why oxygen levels can get so low.

Hypoxia is the term used when dissolved oxygen is below 2 mg/l or 2 parts per million.  That means for every one million molecules, only two of them are oxygen molecules.  Most marine life try to avoid water that’s this low in oxygen because they will become stressed or die.  The hypoxic zone in the Gulf occurs in one of the most important commercial fishery zones in the United States during the spring and summer months.  Why during the spring and summer?  There are a couple of answers to this question.  One is because of the fertilizer runoff which I mentioned earlier.  The other has to do with water temperature.

As water temperature increases, it naturally looses it's ability to hold gas molecules like oxygen. Cooler water naturally holds more oxygen. Source: Koi Club of San Diego
This is a map of the data we have been collecting during the Groundfish Survey. Our data gets sent in everyday and the maps are updated weekly. Check back at http://www.ncddc.noaa.gov/hypoxia/products/ for a complete map of Bottom Dissolved Oxygen after July 17th 2011.

When the data collection is complete you will notice that the “dead zone” is larger than the state of New Jersey.  It is bigger this year than in previous years due to the flooding that’s occurred in the Great Plains and Midwest this spring and summer.

Salinity (salt level):  This measurement is extremely important to the fish that live in the ocean because each species has an optimal salinity level that it requires.  Remember osmosis?  Osmosis is how cells move water in or out depending upon their environment.  If a fish ends up in an environment that’s too saline (salty), the water will begin to leave the cells of the fish through osmosis and they could “dehydrate”.  If they are in water that’s too fresh, then their cells will start to fill with water and they could “bloat”.  All of this cellular work is done by the body in order to maintain homeostasis.  Homeostasis refers to the ability of a living thing to keep its body in balance with the ever-changing environment in which it lives.

Salinity also affects the levels of dissolved oxygen in the water.  The saltier the water, the lower the oxygen levels will be.  It also creates a problem with waters ability to “mix”.

Notice how the heavier salt water settles to the bottom of the sea. The red dots represent the amount of dissolved oxygen during a hypoxia event. Notice that due to a lack of water mixing, the concentration of oxygen is much lower in the saltier bottom layer of water.

Chlorophyll Concentrations:  As the last blog mentioned, chlorophyll is a green pigment that phytoplankton and other aquatic plants have.  By calculating the concentration of chlorophyll in an a region, researchers can determine how productive the area may be for fishing.  Remember that zooplankton eat phytoplankton and bigger fish eat zooplankton, which are then eaten by bigger fish. A good general rule of thumb is that if the water is clear and blue then there won’t be as much living in it as green cloudy (turbid) water. Areas of hypoxia can also be predicted if the levels of chlorophyll get too high.

Now that you know some of the basics about ocean health, try to do your part.

*   If you must use fertilizer, do so sparingly.

*  Purchase soaps and detergents that are labeled phosphate free.

*  Be sure to make sustainable choices when purchasing seafood (visit Seafood Watch)

Personal Log

Today I found out why fishermen do not like dolphins.  A pod of dolphins were following us on a trawl and when we brought up the catch there were holes in the net.  We had to dump the sample back into the sea and try again after the holes were patched.  We went back to do a second trawl in the same area and the dolphins did the same thing.  We decided to try to “outrun” the dolphins on our way to the next station.

The reason we can’t collect data on the trawls with net holes is because we won’t get an accurate representation of the actual number of species living in that area.  In science it’s very important to make sure we collect good data.

A pod of dolphins following our ship.

Obed Fulcar, July 24, 2010

NOAA Teacher at Sea Obed Fulcar
NOAA Ship Oscar Dyson
July 27, 2010 – August 8, 2010

Mission:Summer Pollock survey III
Geograpical Area:Bering Sea, Alaska
Date: July 24, 2010

Science & Technology Log:
Thursday, July 22: After a night of swinging and swaying from the waves at high seas, I am somewhat used to it already. Today is the start of my new shift from 0400 in the morning until 4:00 pm in the afternoon, 12 hours on, 12 hours off. Since yesterday we left the continental shelf and we are heading to deeper waters. There was a scheduled trawl to be done early this morning, but the Acoustic Lab reported no fish at all on the screens. As part of the survey it is necessary to perform a CTD launch every morning at sunrise. CTD stands for Conductivity, Temperature, and Depth, explained Darin Jones, one of the young scientists in charge of the Pollock survey.
CTD
CTD
The CTD unit is made up of a series of bottles used to collect water samples at different depths, and also includes remote sensors to collect data such as sea temperature, salinity, depth, water pressure, and fluorescence. Fluorescence is the presence of Chlorophyll in the water which depends on the amount of sunlight that penetrates the ocean, indicating the presence of Phytoplankton (algae and other microscopic plants). They rely on sunlight to produce the energy that zooplankton growth is dependent upon. Zooplankton is the foundation of the Bering Sea food chain,since is made up of krill, small shrimp like crustaceans that are the primary source of food for commercial fish such as Pollock, Cod, Salmon, and pretty much any other fish in the North Pacific Ocean.
CTD
CTD
As the CTD is dropped the ship needs to stop in order lower the unit, which is attached by cables to an A-Frame crane, including one to transmit data. The CTD can only be used to depths of 600 meters, so another device called the XBT for Expendable Bathy-Thermograph (for depth and temperature) is used for depths up to 700 meters. It can also be launched manually while the ship is in motion, and data is transmitted through a thin copper wire that splits, hence the name “Expendable”. Once the CTD is hauled back onto deck, the water bottles are drained and samples taken for dissolved oxygen (DO)analysis. DO is sequestered using chemicals that react with the oxygen taking a solid form that preserves it for lab analysis.
XBT
XBT
Personal Log:
Last night I took motion sickness pills to keep me from getting seasick. After breakfast weather got really bad, with waves up to 6 feet, battering the Oscar Dyson. These conditions, combined with a heavy breakfast, made feel really dizzy, and next I know I was throwing up. My roommate, Vince Welton, who is also the ship’s tech guy, got me some very tasty saltine crackers, and medication, that help me feel better. I laid down on my bunk bed and doze off while listening to some Jazz by Michel Camilo.
While trying to rest the waves were crashing into the hull of the ship with a loud noise, while the ship kept going up and down. I was thinking about how seafarers of the past and the conditions aboard were so much different than today. Ocean going trips now are made much easier by the technology and modern amenities commonly found on board. Staterooms with bath, galleys or kitchens fully equipped with fridge, microwave oven, and entertainment rooms with flat TVs and DVD players are the norm. I kept thinking that the next 2 weeks on board the Oscar Dyson will be a lot like space travel, will all the walking up and down stairs from deck to deck, closing of hatches, and not been able to step outside the ship for a walk until reaching port.
The connection I can make about the CTD is that it reminds me a lot of the citizen science data collection and water quality monitoring I conduct with my students after school on the Harlem River, as part of “A Day in the Life of the Hudson River” a yearly event sponsored by NYSDEC (NY State Dept of environmental Conservation) and Columbia University Lamont-Doherty Laboratory. just like in the CTD we collect samples of water from the river to test for Dissolved Oxygen, Chlorophyll, PH, Salinity, Nitrates, plus soil samples from the mudflats.
When we collect the chlorophyll samples we use the same methods just as it’s done on the Oscar Dyson, squirting the water through a circular paper filter until it turns brownish. I am planning a lesson for next school year called “NOAA in the Classroom:Student CTD Activity” where using a student water sampling bottle my Environmental Science Club class will collect water from the Harlem River at different depths with the help of our wooden boat “Boca Chica” built after school. We test the samples for DO, Salinity, PH and other protocols using a LaMotte water quality test kit to monitor the health of the Harlem/Hudson River Estuary. This data will be reported to the GLOBE.gov Program website to be used by scientists and schools all over the world. My middle schoolMS319 is a GLOBE Program partner school, and also we will be reporting data from our new Wireless Weather Station. I strongly believe that students learn science by doing science!
Boca Chica
Boca Chica
“Navegando en Alta Mar”
Jueves, 22 de Julio: Hoy comence my primera guardia de las 0400 am a las 4pm. Desde que zarpamos del puerto de Dutch Harbor hacia aguas profundas me habia librado del mareo, pero finalmente me agarro.
El mal tiempo de hoy temprano, con violetas olas que golpeaban la nave de hasta 18 metros, mas un desayuno muy pesado me provocaron unas nauseas que termine en mi camarote vomitando y tirado en la cama. Despues de tomarme una medicina y de comerme unas galletitas de soda, me tome una siesta y me levante mucho mejor. El Sonar Acustico de la nave no detecto presencia de peces por lo que fui a ver el lanzamiento de un CTD o unidad de Conductividad y Profundidad Termal. El CTD contiene botellas para recoger muestras de agua y sensores para medir la temperatura y salinidad del mar hasta 600 metros.
Para medidas mas profundas de hasta 700 metros se usa una unidad manual desechable llamada XBT. Ambas unidades son usadas para obtener datos cientificos como el nivel de Oxygeno disuelto, Salinidad, Profundidad, y Florescencia (nivel de clorofila), la ultima es muy importante pues refleja la abundancia de algas microscopicas de las que depende elZooplankton. El zooplankton esta compuesto de minusculos crustaceos que son la base del ecosistema alimenticio del Estrecho de Bering, del cual dependen especies comerciales como el Bacallao, Salmon y Arenque, asi como casi toda especie de pez en el Oceano Pacifico Norte. El uso del CTD es muy parecido al trabajo que hago con mis estudiantes analizando las aguas del Rio Harlem. Estos jovenes cientificos tambien toman muestras de agua y practican analisis de campo para Oxygeno disuelto, PH, Nitratos, Salinidad e incluso pruebas de Clorofila, como parte de un evento anual llamado “Un dia en la Vida del Rio Hudson” .
En este evento organizado por el Laboratotio Lamont-Doherty de la Universidad Columbia, y el Depto de Conservacion del Estado de NY, participan escuelas a todo lo largo del Rio Hudson, recaudando datos cientificos sobre el rio. Pensamos usar a “BOCA CHICA”,un bote de madera que armamos de tarde, para una practica de CTD tomando muestras de agua del rio, analizarlas, y reportar los datos en el internet. Tambien mis estudiantes de la Escuela Intermedia Maria Teresa Mirabal Ms319, de origen dominicano en su mayoria, aprenden ciencia ambiental al tomar datos de la Estacion Metereologica ubicada en el techo de la escuela. Ellos reportan los datos via internet en la pagina web del Programa GLOBE.gov, para ser usados por cientificos y estudiantes por todo el mundo.

Scott Sperber, July 11-12, 2009

NOAA Teacher at Sea
Scott Sperber
Onboard Research Vessel Kilo Moana
July 9-17, 2009 

Mission:Woods Hole Oceanographic Institution Hawaii Ocean Time series Station; Albert J. Plueddemann, Chief Scientist
Geographical area of cruise: Central Pacific, north of O’ahu
Date: July 11-12, 2009

Weather Data from the Bridge 
Temperature: 24.2 C

Bringing in the SEABIRD CTD

Science and Technology Log 

Compared to yesterday today is a very slow scientific day.  After releasing the WHOTS buoy, things really calmed down.  Let me take this opportunity to tell you a bit about some of the instrumentation on the buoy itself.  The overall goal of the project is to collect data about the ocean and atmosphere over a long period of time.  These data will serve to help answer questions about such things as global warming and its impact in the tropics. On the buoy itself, pictured in a previous log, there are instruments that measure temperature, humidity, solar radiation, wind direction and speed. A GPS unit keeps track of the buoy’s location at all times. On the buoy there is also an antenna which transmits data to satellites. Each of the two buoys [explain why there are two in the ocean for this 4-day comparison period] in the water has enough slack in the lines to allow for an approximate 2-mile radius circle.

Profile of CTD on shallow casts

The weather balloon launching continues every four hours with teams of two or three taking each launch in shifts. Some CTD casts have been done with the small package SEABIRD CTD.  This is set over the side, lowered down by crane and yo-yoed up and down for about four hours.  During this time, data are sent directly to an onboard computer and collected by the scientists. These data include temperature and salinity. This is important information to assess changes going on in the crucial air/sea interface.

These particular locations, ones where temperature and salinity difference vary worldwide, the thermocline and halocline are dependent on variables such a currents and air temperature.  On the final assent collection bottles are closed to collect water samples for further analysis. With all of this sophisticated instrumentation onboard surface water temperature samples are still taken with the old fashioned method of lowering thermometers into the water several times to take an average reading. Some things never change. The information collected by both the oceanographic crew as well as the meteorological crew aboard is truly showing the links, the association between the interaction of the air and sky, in the crucial air/sea interface.

I found out today that the temperatures on the two thermometers on the WHOTS-6 buoy are not matching. They are off by about 0.4 degrees C; that is the level of precision necessary for this research.  The scientists are looking into which one is closest to the temperatures read on the ship before we move off to the old buoy’s location tomorrow. Apparently, this is not something that can be reconfigured so the scientists need to know which thermometer they can rely on for information. There are two of just about every instrument on the WHOTS buoys. This serves as a backup and a comparison for the same location and enables the greatest accuracy in the data.

Profile of weather balloon sonde

Personal Log 

I’d like to share a bit more about my onboard life. I have gotten acclimated finding my way around the ship (sort of). Well, at least I don’t get lost going to the mess hall anymore.  I am in a berth on an upper bunk with Jeffrey Snyder, one of the primary researchers from the University of Hawaii. The berth is quite comfortable as berths can go since it has been years since I was in a bunk bed. Various alarm clocks go off at anytime at night so the crew can go on their watch.  There is even a ghost alarm that goes off at 01:15 that Jeff and I cannot locate.  Food is not at a shortage. It seems that every time you turn around it is time to eat, and what great food it is too.  There is fresh salad lunch and dinner, fresh fruit, at least 3 entries to choose from each mea and desserts. LA Fitness here I come. I received what I consider a gift today from Fernando Santiago, one of the principle scientists, a DVD of the procedures that are used on the Hawaii Ocean Time-series Project.

July 12, 2009 

Had some down time today after setting off another weather balloon and a great fruit and yogurt breakfast. Took a 7 mile bike ride. You may ask where in the middle of the ocean you can take a 7 mile bike ride.  They have a nice little fitness room on board.

Words of the day: Mahimahi, calibration, dissolved oxygen, interface, thermocline, conductivity, temperature, depth.