Terry Maxwell: Making Models and Memories, June 20, 2017

NOAA Teacher at Sea

Terry Maxwell

Aboard R/V Hugh R. Sharp

June 6 – 21, 2017

Mission: Sea Scallop Survey
Geographic Area of Cruise: Northeast Atlantic Ocean
Date: June 20, 2017

Weather Data from the Bridge
Latitude: 41 18.06 N
Longitude: 68 42.35
Wind Speed: 20.3 knots
Air Temperature: 15.3 C

Science and Technology Log

I’ve had a lot of people ask “So what is the purpose of this trip?”  I thought it would be fitting to answer that question in this last blog from sea.  I’ve explained the process of collecting the data out here at sea.  I’ve explained the technology and methods we’ve used to collect it.  But the logical question now is, what happens once this data has been collected?

I’ve had the pleasure serving on the second half of this trip with NOAA Mathematical Biologist, Dvora Hart.  Dvora is the lead scientist for the scallop fishery.  She is well known in the New England area for her work with scallop fisheries.  To many of you in the Midwest, scallops may not seem like a big deal, but did you know that scallops are the second largest commercial fishery market in America?  In 2016 scallops were a 485 million dollar industry.  They are second only to the lobster market in terms of commercial fisheries value.

NOAA has been completing scallop surveys with lined dredges since 1978.  The methods have changed over the years as the technology and research methods have advanced, and these methods have yielded success.  However the scallop fisheries have not always been as plentiful as they are now.  In 1994 several measures were put in place to help a struggling scallop fishery.  The changes were larger dredge rings so smaller scallops would pass through, less crew members on board a vessel, and sections of one of the most productive fisheries in the Atlantic, Georges Bank, would be closed for portions of time to scallop fishermen.

These kind of changes come from a Regional Fisheries Management Council.  This council has appointed members from the governors of the New England states involved, head of NOAA Greater Atlantic Fisheries gets a seat, and then 3 more members from each state are nominated.  The end result is 19 members who make up this council to decide how to best run a variety of commercial marine organisms in the Northeast Atlantic.  There is also a technical committee, which advises this council.   This is where Dvora Hart and the data from the scallop survey come in.

habcam survey charts
Data from the HabCam surveys are very effective at adding a layer of depth to the knowledge of the population of scallops in the Northeast Atlantic Ocean.

The scallop survey, which started May 16th, has been meticulously planned out by NOAA Fisheries.  The area where the scallop survey has been preformed has been broken up into regions called strata.  These strata areas are determined by their depth and their general geographical area.  Once scallops are collected in a strata, a weighted mean, a size frequency, shell heights, and a mean number of scallops of each size category are taken.  From the meat weights that were collected, a total biomass of scallops for the area is taken.  There is a relationship between the meat weight and the shell height which gives researches an idea of the total biomass of scallops in the area.  At any given depth there is a conversion of shell height to meat weight.  These numbers can be plugged into software which can model the biomass for an area.

biomass
Scallop biomass modeling from the 2016 survey.

All of the data collected during the NOAA scallop survey is combined with the Virginia Institute of Marine Science (VIMS) scallop survey.  Dvora and the NOAA scientists created forecasting models for 19 different areas in the Northeast Atlantic.  Forecasts are made using the predicted biomass for the strata areas, by aging the samples of scallop shells collected, fishing mortality (amount of caught by fishermen), and natural mortality rates.  Models are then created to forecast 15 years out to predict the consequences of fishing an area heavy.  Dvora is part of a technical team that advises the Regional Fisheries Management Council using the data collected in this survey and the models her and her team have created.  Scallop fisheries are very healthy currently due to the data collected, data interpreted, and models created by NOAA scientists, commercial fishermen, and Regional Fisheries Management Council.

Personal Log
These 16 days have been quite an experience.  I’d like to share just 5 of the more memorable moments from this trip.

5. Amazing sites of nature.  What a unique experience to be out only surrounded by the vast Atlantic Ocean for over two weeks.  I’ve seen so many awe inspiring moments.  Sun rises, sun sets, full moons over the ocean in a clear sky, rainbows that span the horizon, thousands of stars in the sky, and thick ominous fog which lasts for 24 hours.  Truly once in a life time sights.


4. The 12 hour shifts.  Whether it was running the Habcam and joking around with the crew while we watched computer screens for 12 hours or working the dredge station in all kinds of conditions, the work was fun.  Being out on the deck working the dredge was my favorite type of work.  To be out in the open air was awesome regardless of how hard the work was.  The last day the waters were crazy as we worked on the deck.


3. The awesome animals that came up in the dredge.  Too many pictures to post here, but my favorite animal was the goosefish.  That fish looked like it wanted to take a bite out of your arm even if it was out of water.  Such an awesome animal.

IMG_0407
Seeing these goosefish come out of the dredge never got old.  Such an amazing fish.

2. The awesome animals that would come near the boat.  Crew members saw whales, dolphins, sharks, sunfish, and mola mola.  Though my favorite was my first day out when the humpback whales surrounded the boat, the dolphins riding by the boat is was a close second.

IMG_0518
One of our last days a group of about 4 dolphins followed the ship for about 10 minutes.

1. General life about the Hugh R. Sharp.  What a great group of people to be with for 16 days.  I felt accepted and looked out for the whole time I was here.  Mike Saminsky dropping what he was doing the first day I got to the ship to show me around and grab some dinner, TR sharing his hidden stash of snacks with me, a variety of crew members trying to help me through my sea sickness, and every body on the cruise allowing me to ask questions and interview them.  Just the general down time and laughs had will be very memorable.

IMG_0360
General life aboard the Hugh R. Sharp will be a lasting memory for me.

Thank you to the people of NOAA, the Hugh R. Sharp, my wife and kids (Hannah you are amazing for shouldering the extra load at home!), and family, friends, and students that followed the blog at home.  This has been an experience of a lifetime, and I’m grateful to all of you who made it possible.  Specific thanks to my work crew chief Nicole Charriere who was an awesome leader during this cruise.  I learned a lot about how to lead a group watching her.  Thank you to Larry Brady and Jonathan Duquette the Chief scientists for this cruise.  Their organization and decision making made this a smooth experience for me.  Thank you to Katie Sowers, Emily Susko, Jennifer Hammond, and Huthaifah Khatatbeh for help with the trip arrangements and all of my blog questions, you all made this experience much easier.

Did You Know?

I will travel over 1,000 miles to go home today.  Yes that’s crazy to me.  But I have traveled over 1,000 nautical miles on the Hugh R. Sharp since this cruise has began.


Terry Maxwell: Strike a Pose, June 18th, 2017

NOAA Teacher at Sea
Terry Maxwell
Aboard Hugh R. Sharp
June 6th-21st

Mission: Sea Scallop Survey
Geographic Area of Cruise: Northeast Atlantic Ocean
Date: June 18th, 2017

Weather Data from the Bridge
Latitude 41 06.60 N
Longitude 67 03.68 W
Wind Speed 18 Knots (20.7 miles per hour)
Air Temp 16.2 Celsius (61. Fahrenheit)

Science and Technology Log
After being a part of over 40 dredge station tows, I started asking myself, “I wonder what these animals look like/act like before they get caught in this dredge?”  Most of these animals still look amazing when they come out of the dredge, but many are beaten up from the tow. Some have swim bladders that are bulging from the pressure difference of the bottom of the ocean to the surface.  So you begin to ask yourself, is there another way to survey these animals and leave them in their natural state?  The answer is an emphatic yes.

When I first walked onto the deck of the Hugh R. Sharp, a structure stood out on board that looked like a heavy duty reinforced sea horse.  I was quickly caught up to speed by Mike Saminsky from Woods Hole Oceanographic Institute (WHOI) as to what the structure was.  The large structure I was looking at was a Habitat Camera, or HabCam for short.  Mike has been on the Hugh R. Sharp since the beginning of May participating in the NOAA Scallop Survey.  I consider him an expert of sorts when it comes to the information on the HabCam.   From NOAA, our Chief Scientist for the second part of this cruise, Jonathan Duquette is another HabCam expert on board.  Between the two of them, and my experience with HabCam, I’ll do my best to explain how effective this piece of equipment is at collecting data.

habcam
This large contraption is HabCam.  Inside the metal framework is a large array of sensors, cameras, and lights.  The zip ties on the cable reduce the vibration of the cable in the water.

For three of our watch sessions I have gotten to be a part of the HabCam process.  I have gotten to pilot, co-pilot, and annotate the images it collects and processes.  Essentially the HabCam is towed behind the ship and run at a depth of about 2 meters above the ocean floor.  From this vantage point, the Habcam takes up to 6 pictures per second of the ocean floor, but this piece of advanced equipment does much more than snap pictures.  Before I get into the details of how it functions, let me explain where it came from .

HabCam was first thought up back in 2006 from a joint effort between the Sea Scallop fishing industry and WHOI.  The first version of HabCam had a lot of issues, consider it a prototype.  Through this corrections were made and the second version of HabCam was created.  However it too was short lived.  Imagine towing a camera behind a boat moving at about 7 knots that is trying to get close to the ocean floor, plenty can go wrong.  Through these first two cameras trials, a third version of HabCam was created.  This version is still in use today by a group of fishermen on a boat called the Kathy Marie.  HabCam 4 is the version that is on board the Hugh R. Sharp today, and the model I will be focusing on.  HabCam V4 was designed by WHOI specifically for NOAA in 2010, and is the only such Habitat Camera in use in the NOAA Fisheries Program.

This awesome piece of equipment does not just take pictures.  As I have mentioned, dragging along a camera at the bottom of the ocean is riddled with challenges.  There is plenty of gear on HabCam that attempts to make this task possible.  HabCam is equipped with front and side scan sonar to give the operator a read out of what is ahead and to the side of it.  The forward facing sonar allows the pilot to see if any obstacles are in the way of the tow, so the pilot can raise the camera to avoid obstacles.  The side scan sonar helps to a point with this as well, but is more useful to show when large sand waves/hills might be approaching on the ocean floor.  This also gives scientists an idea of the topography of the area being investigated.

habcam monitors
A multitude of screens.  The starting from top left: videos of the stern side, bottom left: video feed of the winch cable, middle bottom: side profile of the ocean floor with HabCam depths, bottom right: video feed from HabCam, top right: side scan sonar to view the ocean floor, and top middle: forward facing sonar to spot obstacles.

HabCam also has two CTD’s on board.  C stands for conductivity, essentially this gives a reading of the salinity content in the water.  T stands for temperature, this obviously gives temperature readouts.  D stands for depth, which ties together the salinity and temperature at particular depths.  Every so often the HabCam is raised up and a “vertical profile” is taken of the water column.  Again, giving scientist a bigger picture of what the water in a particular survey area is like. Along with CTD, the HabCam is equipped with a fluorometer that can give scientists a read out of how light is being scattered in the area and how much chlorophyll is in an area.

The camera ability on HabCam is impressive.  Since the places it is photographing are deep in the ocean where light is not penetrating, the HabCam is equipped with 4 strobe lights to light up the bottom of the ocean.  These are timed with the camera, so they turn on at the proper time so get the best picture possible.  The camera itself takes 6 pictures per second, which equates to about 500,000 images per day or 2.7 terabytes worth of data.  The programming processes about one out of every 25 to be annotated by trained volunteers (like myself) or NOAA scientists.  While HabCam has been on the Hugh R. Sharp, an estimated 100,000 images will be annotated.  The pictures are of a square meter area of the ocean floor.

habcam pictures
These are all images produced by Habcam.  The top left is a field of sea stars, the top right and bottom right shows an array of scallops, the bottom left shows a hiding goosefish…can you see it?

HabCam is controlled by a winch system which a pilot operates.  The pilot must raise and lower the camera as a readout of the depth to the ocean floor is given.  The pilot must pay attention to the forward facing sonar, side scan sonar, and altimeter of the HabCam.  If an object is coming towards the camera on the sonar, the pilot pulls back on the winch joystick to raise the HabCam, then pushes the joystick forward to bring it back down once the obstacle as passed.  The equipment is housed in a large steel frame in case it does run into any obstacles.  The whole structure is about 2500 lbs, 8 feet tall, and 10 feet long.   Just during this leg of the research cruise, HabCam will have been towed over 600 nautical miles.

piloting habcam
I have gotten to pilot HabCam several times now.  There is a lot to look at, but the more you pilot it, the easier it gets to multitask the screens.

The images from HabCam are valuable to scientists for several reasons.  These images show these benthic dwelling animals in their true habitat (hence the name Habitat Camera).  You can see interactions between species that naturally happening on the photographs.  These images can also be taken through sites that have been dredged to see how effective the dredge tows have been.  By using both the physical dredge catches and the pictures, scientists can study these areas more effectively.

Personal Log
Today was Father’s Day.  Not an easy day to be out here in the Atlantic.  This has without a doubt been a once in a life time experience, but its still hard to miss days like that.  Happy Father’s Day to my dad, Richard, my Father-In-Law, Gary, and to all you fathers out there.  My kids were able to send me videos, which was nice and the night shift made some treats in honor of the fathers on the boat.

Seasickness reared its ugly head again the other night.  The Atlantic likes to remind me that people from Illinois don’t get free rides out here!  Someone asked me what seasickness feels like. Its like you are stuck on the tilt-a-whirl ride at a carnival, and the person running the ride has just walked off so there’s no one to stop the ride.  All you can do is just accept it.  I do feel better today so that’s a bonus.

I’ve learned a lot out here, and the lessons are ranging.  Things I want to bring back to my classroom, things that are life lessons, and lessons in leadership.  This has been a wonderful experience even with the missed holidays and seasickness.  I finally did get up to see the sunrise the other day.  What an awesome view.

sunrise
It was worth losing some sleep over this sunrise view.


Did You Know?

One of the common sea birds that follows our boat daily is called a shearwater.  I have grown to really enjoy watching these birds cruise over the top of the waves in search of fish.  Two really unique things about them, their take off and their flight.  When they take off, they literally run on top of the water with their web feet.  Its awesome to watch.  In flight, they flight fast above the waves, and glide on top of every crest of a wave looking for food in the water.  By flying closer to a wave surface there is less drag on their wings than higher up in the air.


Terry Maxwell: Time is Not On Our Side, June 14, 2017

NOAA Teacher at Sea

Terry Maxwell

Aboard R/V Hugh R. Sharp

June 6–21, 2017

Mission: Sea Scallop Survey
Geographic Area of Cruise: Northeast Atlantic Ocean
Date: June 14, 2017

Weather Data from the Bridge
Latitude: 41 31.54 N
Longitude: 70 40.49 W
Wind Speed 10 Knots (11.5 mph)
Air Temp 20.2 C (68.4 Fahrenheit)

Science and Technology Log

Contrary to the popular Rolling Stones song “Time is on my Side,” time is not on our side while we are taking survey of the scallop population in the Northeast Atlantic Ocean. This survey has been meticulously planned for months leading up to the actually event. There is no time budgeted to sit at a dredge station longer than you have to.

track
The Nobeltec Cruise Track for the 2nd and 3rd legs of the 2017 Scallop Survey.  You can see this survey has covered 1000’s of nautical miles, and stopped at over 100 dredge stations.

For seven days our noon to midnight science crew has been working at a blistering pace to dredge the ocean floor or take pictures with the underwater camera, HabCam.  We are on a tight schedule, and in a twelve hour period we are able to work through 10 dredge stations.  There has been little down time, and because some of the dredge stations are so close together, there is no time to be unproductive while we are at a station.  Because of this, there are often stations where we simply are not able to individually count all the organisms we collect.  There are many situations where our crew must use the method of subsampling.

For you in the Midwest, imagine you wanted to know how many dandelions were in your yard.  Now if you are anything like me, you have way too many to count.  If you went to count them all individually, it would literally take you all day if not more.  It is just not time efficient to do such a thing.  But if we took a population sample of some random areas in the yard, we could come up with an answer of how many dandelions were in the yard, and get a very close answer to actually counting them individually.

A similar example I can give you is with a recent dredge catch that was full of sand dollars.  In one of our massive dredge catches composed of about 99.5% sand dollars, I completed an estimate sand dollars in a similar manner.  I filled 2 liter pail full of sand dollars.  My count for that pail was 188 sand dollars per 2 liters.  In this catch we had 46 baskets each with a volume of 46 liters.  So at 94 sand dollars per liter with there being 2,116 liters total, you can estimate there are about 198,904 sand dollars in that dredge catch.

sand dollars
A dredge catch that was almost 100% sand dollars.  These sand dollars are dripping with a green algae and cover our buckets and wet gear in a green coating.

We are faced with similar tasks while sorting through the dredge.  When we face those situations, we turn to the method of sampling, and we take a representative sample of our catch.  At most stations we are taking count of sea stars, crabs, waved whelks, all fish, and scallops.  When we collect the dredge, most of the time it would not be time efficient to totally count up all the sea stars, so we turn to subsampling.

Here’s how subsampling works.  Once we have sorted our dredge catch into various pails, we count up our specimens.  For sea stars however we always take a subsample.  To do that our watch-chief takes a scoop full of whatever is in our discard pails, and she does this randomly.  She puts the random sample in a 4.5 liter pail.  From here, she can begin to estimate the number of sea stars in our dredge catch.  For example, if she goes through the 4.5 liter pail and finds six sea stars, and she knows there are four 46 liter pails of discard from the dredge, with a little math work she can figure out how many stars are in the dredge.  If there are four 46 liter pails of discard, then there is a total of 186 liters of discard.  She knows from her random sample that there are 6 sea stars per 4.5 liters which would come out to 1.3 sea stars per liter.  By multiplying that number by 186, you can determine that an expanded estimate for the sea stars in the dredge collection would be 242 sea stars.

Bucket
An example of our discard baskets from our dredge catches.  This catch was sea star heavy, and this shows it would have taken too much time to count each sea star individually.  Since many sea stars are predators of scallops, a count needs to be recorded.

We also use this method when we have a large catch of scallops.  When we have an overly large scallop catch on the dredge, we are not able to count and measure every single scallop from the catch.  In these cases we use a representative amount.  In one case we caught 24 baskets of scallops, each basket able to hold 46 liters.  If we were to measure all of those scallops we would be at that station far too long to move onto the next dredge.  When we caught enough scallops to fill 24 baskets, we used 3 baskets of scallops as a representative amount.  All of the scallops in the 3 baskets were measured for their shell height.  We would then take a mean average from these scallops to represent the 21 other baskets.  We are also able to estimate the number of scallops in the 24 baskets the same way I estimated the number of sand dollars in a dredge catch.

scallop baskets
A large catch of scallops from one of our dredge stations.  In this case a representative sample of shell heights was taken.


Representative samples and population estimations through sampling are valuable tools that scientists use to collect a lot of data in a more efficient amount of time.  From this data, mathematical models and predictions are developed.  By implementing these methods, we are able to get more data from more locations.

Personal Log

It has been 9 days since I arrived in Woods Hole, Massachusetts to be a part of this journey.  As I shared in my last blog, it is hard to be away from home, but many of the people here are gone more than 100 days per year.  There is one thing that makes that time away easier….eating!  Here on the Hugh R. Sharp, I would imagine I’ve put on some extra pounds.  Most days I feel like a cow grazing.  There are so many snacks on board, that it is so easy just to walk by the galley and grab a mini candy bar, chips, pop, or ice cream.  I have discovered there is no better candy bar than a Baby Ruth.  On top of the snacks and sweets, the cook, Paul, cooks up some mean dinners.   Though I miss my wife’s home cooking, Paul’s cooking is a good substitute.

paul and candy
Lots of candy and snacks and some good dinners is probably leading to some extra poundage!  There are two drawers always full of candy, and a freezer always full of ice cream.  Pictured on the left is the ship’s cook, Paul.

Outside of eating, there is not much recreational time on the ship.  I do try to get up a couple hours before our shift begins to just enjoy being out on the ocean.  I haven’t been able to make myself get up yet for sunrise at 5:05 AM.  After working a twelve hour shift sorting dredge catches, there’s not much you want to do but sleep.  Sleeping on the boat has been good.  Probably some of the deepest sleep I’ve had since our kids were born.  I’ve gotten used to the motion of the boat, the sound of waves hitting the bow, and the boat stabilizers which sound like a giant snoring.  I’m a sleep walker, so that was a concern coming in that I would find myself on deck, sleep walking.  But I’m sleeping so sound, I don’t think it’s possible.  However I did warn my roommates to stop me if they saw me up in the middle of the night.
Part B of the survey has started, and with that most of my crew got off the ship, and I will have a new crew starting today.  It was a great group of people to work with.

crew
Part A of the survey the day crew from left to right: Crew chief Nicole, myself, Dylan, Sue, and Nancy.  Then the night crew of Lauren, John, Jill, Han, and crew chief Mike.


Did You Know?

Living in Illinois, there are not many times where knowing your parts of a ship come in handy.  However, as I have been living on the Hugh R. Sharp for over a week now I have picked up some terms.  I did not know many of these coming on, so this is a “Did you know?” moment for me.

Front of the ship: bow
Back of the ship: stern
Moving to the front of the ship: forward
Moving to the back of the ship: aft

bow
The left of this picture is port, and the right is starboard.  It took me awhile to figure out what our turn would be like if we were making a turn to starboard.

If you were on the bow, your left would be the: port
If you were on the bow, your right would be the: starboard
Fathom: 6 feet
A heading of zero: North, a heading of 90: East, a heading of 180: South, a heading of 270: West
Heading to a location quickly: steam
Kitchen (where I constantly graze in between dredge stations): galley
Location of the ship’s navigational equipment is: bridge
Bathrooms: the head

Not much use for these terms in the Midwest!


Terry Maxwell: An Advanced Operation, June 11, 2016

NOAA Teacher at Sea

Terry Maxwell

Aboard RV Hugh R. Sharp

June 6 – June 21, 2017

Mission: Sea Scallop Survey

Geographic Area of Cruise: Northeast Atlantic Ocean

Date: June 11, 2016

Weather Data from the Bridge
Latitude: 42 06.73
Longitude: 67 18.80
Wind Speed 20.9 Knots (24 miles per hour)
Air Temperature 13.3° Celsius (55.9 Fahrenheit)

Science and Technology Log

Upon my first entry into the Hugh R. Sharp, the one thing that really stuck out to me was the amount of visible technology.  In the dry lab alone, there are over 20 computer screens, close to as many hard drives, and Ethernet cords crossing and spanning the entire dry lab area.  In the laboratory van, where much of our species counting and data collection takes place there are three more touchscreen monitors, motion compensated electronic scales (a scale that measures accurately regardless of boat movement), and electronic meter sticks.  It is overwhelming at first, but as I have settled in now for four days it becomes commonplace.

before and after
What is more impressive than the amount of technology in the dry lab, is that the NOAA crew hooks up all the equipment before the mission starts.  The before picture of the room is on the right.

On the 9th we were delayed due to some rough water, and the need to fix some of our equipment.  Specifically, the ramp, which launches our underwater camera, was broken due to some strong waves.  The engineers and technicians of the boat reinforced the ramp quickly on the morning of the 9th and we were headed back out to our location in Georges Bank in short order.  The science crew I am a part of has the noon to midnight shift, so this gave me a chance to talk with one of the NOAA Fisheries experts Nancy McHugh about the technological advancements she has seen in recent years on the NOAA surveys.

nancy
Nancy McHugh sorts and identifies fish from a recent dredge station catch.

Nancy has been with NOAA for 26 years, and has been on many survey missions.  In my last blog, I gave an overview of our dredge missions, and how the data were collected during those missions.  During this blog entry I would like to tell you about the technology that makes all this data easier to collect, analyze, and organize than it once was.  This technology has made all the collection of data more accurate, reliable, and accountable.  I have seen first-hand now how serious NOAA Fisheries is about collecting data that is accurate as possible, down to the last and smallest scallop.

In the 1990’s and early 2000’s, the NOAA Fisheries staff used waterproof paper forms and pencil to collect the information from their surveys.  Separate forms were used for each species collected.  To give you an idea of how many different species are collected during a survey, our survey has collected over 50 different species of organisms, and we still have 11 days left.  That means that during this survey would have had 50 different paper charts about the organisms collected.  Each organism collected would be hand tallied onto a chart about the specimen’s length, weight, gender, and if a stomach content examination was performed. Each species was given a code number so that code number could be entered into a database for retrieval at a later date.

old form
Old fisheries survey data form used in the late 90’s.  Much has changed since then.

Once the data for each species was recorded on its own form, the summary of the information about each species was transferred onto a main master form.  All the scallops were hand measured, and length tallies made for the scallop at each millimeter mark.  Once the dredge station survey was complete, someone would hand total all of those numbers to get a total amount.  The total data sets would be sent out to a prison in Kansas, which would be responsible for key punching (entering on a computer).  This data would take around 3 months to get back.  Once the keypunched data was sent back to NOAA Fisheries, it would then have to go through an intensive audit process before it was considered clean and ready for the stock analysts use.

Today NOAA Fisheries relies on a program called Fisheries Scientific Computer System, or FSCS for short (sounds like Fiscus).  NOAA scientists and programmers created this computer program to replace the tedious method of pencil and paper data recording.  My crewmember Nancy was one of the scientist involved in the creation of FSCS.  The FSCS program has helped to create not only a faster more efficient data collection system, but also one that is more accurate and reliable than the old paper and pencil model.  First, the FSCS system is an offshoot of the Scientific Computer System (SCS), which is able to store information about ship board sensors, ship positioning, latitude and longitude, winch data, and depth.  When we are about to start a dredge station, the NOAA scientists start “an event” in the FSCS computer program.  The program then begins to collect a snapshot of information from the SCS system while the dredge is fishing.

lab van
The laboratory van is set up with three touch screen monitors that all run the FSCS program, ichthysticks (electronic measuring sticks), motion compensated scales, and barcode readers to enter data into the FSCS program.  This was a empty room before the mission.  NOAA Fisheries workers set up this room before the start of the Scallop Survey.

Once the process of pulling up the dredge, and collecting of species, and sorting of species has happened the efficiency of FSCS is revealed. There are three stations in the laboratory van; each station containing an “ichthystick,” a small motion compensated scale, a touch screen monitor, a bar code scanner, and a printer.  Each station has science crew members working in teams of two.  At station one in the laboratory van, our watch-chief begins to enter in data from the different species that are collected.  The bucket the specimen is in is scanned; this bucket’s weight has been pre-programmed into a computer.  By having the bucket weight already in the program’s database, that weight is automatically deducted on the digital scale when the specimen bucket is set on the scale.  This tare process once was done manually, by pressing the tare button on the scale.   Once the specimen buckets have been scanned and weighed, many of the specimens are measured for length.  Again, the new technological advancements help with efficiency and accuracy.  NOAA scientists have developed their own “ichthystick” which essentially is an electronic meter stick.  These “ichthysticks” are at each of the three stations in the laboratory van.

icthy board
Measurements made using the icthysticks go straight into the FSCS program. There is no hand transferring of the data. This allows for fast and efficient data collection.

Before a measurement is taken, a scientist selects a specimen from a list in FSCS of possible collected specimens and scans the barcoded bucket tag to ensure the correct species has been chosen.  For this example, if a scientist was examining sea scallops the user simply places a sea scallop on the board up against a block that is at zero mm, and then places a magnet on the other side of the specimen.  The computer will make a sound to indicate the length is acknowledged, and the data is collected in the program.  Here is the cool part: the computer program knows the general ranges of the specimen’s size.  That means if someone accidentally put the magnet down at 350 mm while measuring a sea scallop, the computer would automatically put up a warning message (visually and audibly) noting that the measurement is beyond the known range of expected sea scallop lengths.  This cuts down on accidental measuring errors.

At station 3 where scallops are shucked and examined, all of the information which I discussed in the last blog goes into the FSCS database as it is recorded.  Again, the program checks for errors.  For example, if a meat weight is entered that is too light for the size of the sea scallop being examined, the computer will alert the user that the meat weight is too small for the examined sea scallop.  Then the cutter can ensure that he removed all of the meat properly.

Once all this data is recorded, it is merged with the SCS data for a complete picture of the survey.  The merged data can then be accessed by NOAA Fisheries scientist to analyze the data and create predictive models.  Essentially the NOAA Fisheries survey crew can leave the boat with data that used to take over three months to finalize after a survey had ended.

Personal Log

I don’t want to jinx it, but I think I finally have my “sea legs.”  The waves are pretty rough today, but I’m not really fazed by the motion.  Yesterday we spent a lot of time on the computers, annotating images from the underwater camera, HabCam.  During that time working, I almost forgot I was on a boat.  Part of that is that the water was calmer yesterday.  But today we have much more chop in the water and I still feel okay.

The 9th was a hard day for me, as I missed my son Zebadiah’s birthday.  Happy Birthday Z!  It’s hard to be away from my family, but as I talk to some of the NOAA Fisheries people or the crew that runs this ship I realize how short my time is away from my family.  Some of the NOAA Fisheries crew is out 120 days at sea each year!  The ship crew will work this mission and then head to another mission right after ours is done.  There are some very hard working people that work for NOAA Fisheries, and the crews that run NOAA’s fleet of ships.

It has only been six days since I arrived at Woods Hole, but I’ve seen some amazing sites.  Even though some of the crew is out so often at sea each year, I’m realizing the amazing sunsets never get old to them.  It is an awesome site each night, as is the moon over the water at night.

sun set
Amazing sunsets every night when you are over 100 miles from the coast.  Being aboard the Hugh R Sharp has been a great experience so far.

Did You Know?

Sea Stars are one of the main predators of scallops.  It’s an interesting correlation.  When we have done dredge station surveys there is definitely an inverse relationship between the number of sea stars caught and the number of scallops caught.  Meaning the more star fish that are in a dredge tow, the less scallops and vice versa.  When using the underwater camera (HabCam) to take pictures of the ocean floor, there are sections with sea stars that litter the ocean floor.  Not surprisingly, there are very little scallops in those sections.  Sea stars have suction cup like structures on their arms, which help them latch onto a scallop.  When that happens, the sea star then slowly attempts to pry the shell open.  Some sea stars are then able to push their stomachs out of their body, and digest the externally.  Another interesting ability of the sea stars is their ability to regenerate arms if they are lost.

star eating clam
Sea stars attacking a razor clam shell.  This picture was taken by the underwater camera on board called the HabCam.
star regen
Sea star with two arms regenerating.
huge star
A gigantic sea star out of our dredge collection.  The normal size one is on the right.

Terry Maxwell: Scallop Pails and Humpback Whales, June 7, 2017

NOAA Teacher at Sea

Terry Maxwell

Aboard R/V Hugh R. Sharp

June 6 – 21, 2017

Mission: Sea Scallop Survey
Geographic Area of Cruise: Northeast Atlantic Ocean
Date: June 7, 2017

Weather Data from the Bridge
Latitude: 41 30.90 N
Longitude: 69 18.76 W
Air Temp 14.1° Celsius ( 57.3° Fahrenheit)
Wind speed 4.7 Knots (5.4 mph)

Science and Technology Log

Due to the poor weather delay on the 6th, June 7th was our first day out for the crew I am working with. Our ship is divided into two crews so we can work our operations around the clock.  The crew I am working with works from noon to midnight, while the other crew works midnight to noon.  On the 7th, were able to drop the dredge and attempt to collect scallops to assess the health, size, and population of those organisms.

img_02302.jpg
Sometimes the dredge brings up more than scallops!  This goosefish uses it’s illicium which act like fishing lures to attract fish close enough to be gulped by its large mouth.

We work those hours mainly using the collection process of dredging the ocean floor for scallops, but along the way, several other bottom dwelling ocean creatures are caught in the dredge.

A crane operator with the help of two deck workers lowers the dredge into the water.  Once the dredge is in place to go into the water the crane operator releases cable until the dredge reaches the ocean floor.  Depth readouts are calculated beforehand to determine how deep the dredge will need to drop.  With this information the dredge cable is let out at a 3.5:1 ratio, meaning for every meter of ocean depth we are in, 3.5 meter of cable is let out.  With this ratio the dredge is dropped with an angle that keeps it flat to the ocean floor.  The crane operator is also reading a line tension readout in the crane booth to determine when the dredge has hit the ocean floor.  We are typically in 200–350 ft of water when these dredges occur.  The dredge travels behind the boat for 15 minutes, and is then pulled in.

On the dredge is a sensor called the “Star-Oddi.” This sensor detects the pitch and roll to make sure it was lying flat on the bottom of the ocean.  The Star-Oddi also collects temperature and depth information as the dredge is traveling.  The sensor is taken out of the dredge once it is brought up so watch-chief can see if the dredge was functioning properly throughout the tow.

img_02111.jpg
University of Maine student Dylan Benoit is taking out the Star-Oddi after a dredge.

Once the dredge is hauled up, it is dumped onto a large metal table that the science crew stands around.  Two of the Hugh R Sharp’s vessel technicians then scoop the collected haul to an awaiting science crew.

IMG_0215
The dredge is unloaded with a good haul of scallops.

The science crew will then divide the haul into several different collection pails.  The main objective of this crew is to collect scallops.  Scallops collected are organized into different sizes.  Fish are also collected and organized by a NOAA scientist who can properly identify the fish.  At some of the dredge stations we collect numbers of crabs, waved whelks, and sea stars as well.

img_0169.jpg
This dredge was especially sandy.  In a typical day we reach around 6-8 dredge stations during our twelve hour shift.  Here I am sorting through the sand looking for scallops, fish, crabs, and wave whelks.

Once the haul is collected and sorted, our science team takes the haul into a lab station area.  In the lab, several pieces of data are collected.  If we are at a station where crabs and whelks are collected, then the number of those are recorded as well.  Fish taken from the dredge are sorted by species, some species are weighed and measured for length. Some of the species of fish are measured and some are counted by NOAA scientists.

IMG_0198
In the dry lab the midnight to noon science crew takes measurements and records data.


Also in this lab station, all of the collected scallops are measured for their shell height.  A small sample of scallops are shucked (opened) to expose the meat and gonads, which are individually weighed and recorded.  Once opened we also identify if a scallop is diseased, specifically looking for shell blisters, nematodes, Orange-nodules, or gray meats.

img_02421.jpg
Scallop disease guide posted in the dry lab.

Also at this station, the gender of the scallop is identified.  You can identify the gender by the color of the gonad.  Males have a white gonad, while a female’s looks red or pink. Finally at this station, commensal organisms are checked for.  A common relationship we have seen during this trip is that of the scallop and red hake.  The red hake is a small fish that is believed to use the scallop shell as shelter while it is young.  As they get older, red hake have been identified to be in the depression around the scallop, still trying to use the scallop for shelter, even though it can no longer fit inside.

IMG_0241[1]
A shucked clam that had a red hake living inside of it when it was collected in the dredge.

After that has happened the shells are cleaned and given an ID number.  These scallop shells are bagged up, to be further examined in NOAA labs by a scientist that specializes in scallop aging.

IMG_0232
These scallops have been shucked, and now their shells will be researched by a scallop aging expert at NOAA.  My job is to be the recorder for the cutter.  I do the final cleaning on the scallop shells, tag them, and bag them.

If you’d like to know how this process works, watch the video below.   The watch-chief, Nicole Charriere, of the science crew members I work with, explains the process in this short clip.


Transcript:

(0:00) Nichole Charriere. I’m the watch chief on the day watch, so working with Terry. I’ve been working at the Northeast Fisheries Science Center for about 6 ½ years. When we’re out here on deck, basically, we put a small sensor on the dredge that helps monitor the pitch, the roll, and kind of whether the dredge is fishing right side up or upside down. And we offload that sensor after every tow, put a new one on, and that sensor will tell us basically how that dredge is fishing, because we always want the dredge to be in contact with the bottom, fishing for the entire 15 minutes if we can.

(0:45) The dredge is deployed 15 minutes for the bottom and then it comes back up and then the catch is dumped on the table. Then depending on how far away the next station is, sometimes we take out crabs and whelks, and we account for the amount of starfish that are in each tow because those are predators of scallops. So we want to make sure that we’re kind of tracking the amount of predation that’s in the area. And you usually find if you have sometimes a lot of starfish, a lot of crabs of certain sizes, you’ll find less starfish. I mean you’ll find less scallops. 

(1:22) After the entire catch is sorted, we’re bringing it to the lab. We have scallops, we have scallops “clappers,” which are dead scallops that still have the hinge attached, and that’s important for us because we can track mortality. Once the hinge kind of goes away, the shell halves separate. Can’t really tell how recently it’s died. But while that hinge is intact, you can tell it’s basically dead recently. So you kind of get a decent idea of scallop mortality in that area like that.

(1:52) Scallop, scallop clappers, we kind of count fish, we kind of measure usually commercially important ones as well. Then we take scallop meat weights, so we open up the scallop– Terry’s been doing a lot of that too– open up the scallop, we kind of blot the meat weight so it’s like a dry meat weight, and we measure, we weigh the gonad as well, and that kind of tracks the health of the scallop.

(2:21) And then the rest of us are doing lengths of the scallop, and that’s so that we get a length frequency of the scallops that are in the area. Usually we’re looking for about… if you look at the graph it’s like a bell curve, so you kind of get an average, and then you get a few smaller scallops and a few larger scallops. And that’s pretty much it. We’re taking length frequencies and we’re looking at the health of the scallops. 


Personal Log

From the time I woke up on Tuesday till about the time I went to bed that night, sea-sickness was getting the best of me.  I listened to the advice of the experienced sailors on board, and kept working through the sickness.  Even though I felt sick most of the day, and I just wanted the day to end at that point.  However, I was rewarded by sticking it out, and not going to my room to lay down, by one of the most incredible sites I’ve ever seen.  From about 4pm til about 8pm, many humpback whales were all around our boat.  We had a little down time waiting to get to the next dredge spot, so I was watching the horizon just trying to get my sea-sickness in check.  As I was sitting by the side of the boat, I saw a whale towards the bow of the ship.  I got out my camera and was in the right place at the right time to get a video of it.   It was one of the most amazing sites I’ve ever seen.


Video of a humpback whale diving near R/V Hugh R. Sharp

IMG_0190
Fluke of a humpback whale diving next to R/V Hugh R. Sharp

Did You Know?

The typical bleached white sand dollars that most people are accustomed to seeing as decorations are not the actual look of living sand dollars.  In one of our dredge catches, we collected thousands of sand dollars, and only a couple were bleach white in color.   Sand dollars are part of the echinoderm family.  They move around on the ocean floor, and bury themselves in the sand.  The sand dollars use the hairs (cillia) on their body to catch plankton and move it towards their mouth.  The bleached white sand dollars that most people think of when they think of a sand dollar is just their exoskeleton remains.

IMG_0171
Sand dollars brought up in the dredge


Terry Maxwell: Delayed but not Dismayed, June 6th, 2017

NOAA Teacher at Sea

Terry Maxwell

Aboard RV Hugh R. Sharp

June 6 – June 21, 2017

Mission: Scallop Survey

Geographic Area of Cruise: Northeast Atlantic Ocean

Date: June, 6th 2017

Weather Data from the Bridge
Latitude: 41 31.53 N
Longitude: 70 40.48 W
Wind Speed 10.4 KT’s (11.96 mph)
Air temp 11.0° Celsius (51.8° Fahrenheit)

Science and Technology Log
After starting my travels at 3:45 am on the 5th and ending at 6:00 pm, I was ready to get on with the trip.  However we’ve started off the trip with a bit of a delay.  We were due to leave at 6am this morning, but have been delayed til 5 pm.  This is due to strong winds that are causing large waves, making travel and the survey work difficult.

wind data However, today hasn’t been a waste for me.  I’ve had a chance to take in the town of Woods Hole, Massachusetts.  This place seems like the hub of Northeast Atlantic fisheries.  There several organizations working out of Woods Hole, and there is a rich history of ocean exploration that is evident throughout the town.  Three institutions that are working out of this area are NOAA National Marine Fisheries Service, Woods Hole Oceanographic Institution (WHOI), and Marine Biological Laboratory (MBL).  Each of these institutions serves its own purpose and there is not much overlap between responsibilities even though they are working in the same field.  These institutions do collaborate somewhat with resources and people on missions, but typically don’t work joint missions.  The fisheries branch of NOAA is typically more concerned with the populations of marine life.  WHOI is more focused on oceanographic studies, more about the physical and chemical characteristics of the ocean.  Marine Biological Laboratory, as the name implies, is also focused on the study of ocean life, but unlike the other two organizations, it is a college and is associated with the University of Chicago.  MBL typically does not collaborate with NOAA as much as WHOI does.  On this particular scallop survey,  A scientist from WHOI is working with the HabCam (which I’m sure to talk more about in future blogs).  Woods Hole seems like a destination for any aspiring marine life or oceanography college student to come and work with the best in their field.  There are several graduate and undergraduate students on this trip as well.  As I get to learn everything needed for this trip to function, I’m starting to realize how many different specialists are needed on this mission.  The collaboration and coordination of this trip by the team at NOAA is really impressive.  Got a science background?  Not sure what you want to do with it?  Why not try a NOAA cruise?  You can click here to learn more.

institutions
Left to right: NOAA offices, A WHOI laboratory sign, and an MBL building.


Personal Log
Looking at the projected weather forecast and imagining being tossed around by 12 foot waves has me hoping this anti-seasickness patch will work.   By the time I have finished up this blog post, we are underway, and I am feeling okay still.  Looking forward to tomorrow, being part of the first dredging team.  I am amazed to hear the waves pounding against the ship.  Forces of nature are an awesome thing to deal with.

patch
Patch for sea sickness

Did You Know?
Wood’s Hole, Massachusetts (where we launched from) is where the main ferry to Martha’s Vineyard is located.  This makes Wood’s Hole a tourist destination for people who are wanting to go see the popular summer getaway of Martha’s Vineyard.  Interesting mix of research and tourism here.

Terry Maxwell: An Incomparable Experience Approaches, May 30, 2017

NOAA Teacher at Sea

Terry Maxwell

Preparing to board R/V Hugh R. Sharp

June 5 – June 21, 2017

Mission: Sea Scallop/Integrated Benthic Survey
Geographical Area of Cruise: Northeastern U.S. Atlantic Coast
Date: May 30, 2017

Personal Log

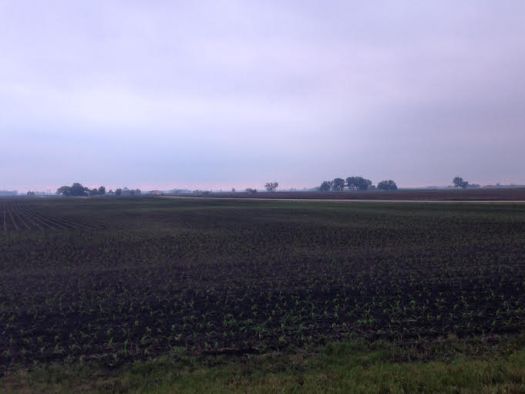
How do you prepare yourself mentally for something to which you have no comparison? I, Terry Maxwell, have wrestled with this question since I was notified on February 1st, 2017 that I would be a part of a research cruise in the NOAA Teacher at Sea Program.  Do not get me wrong, the people at NOAA have been awesome in answering my questions and providing resources to interact with to prepare for this mission.  However, I have lived my whole life in the flat land of Illinois.  I am used to seeing for miles in all directions, but cannot imagine the views out on the ocean.  I have taught science now for 13 years, but have never had an opportunity to work with scientists doing actual fieldwork and research.  My mind is trying to process this upcoming incomparable experience right now.

field
My flat land views will soon be exchanged for a view from the Hugh R Sharp.

About Me

I am a science teacher at Seneca High School in Seneca, Illinois.  I will be starting my 6th year at Seneca High School next year, and going into my 14th as an educator.  I mainly teach freshman physical science, but occasionally get the opportunity to teach a junior/senior environmental science class.  Along with teaching I also am an assistant

football
Teaching and coaching leads to a full year.

football coach, assistant track coach, science club sponsor, and FCA (Fellowship of Christian Athletes) huddle leader.  I wear many different hats throughout the year, and have the support of an awesome family at home.  It will be difficult to be away from my family for a couple weeks after a busy school year, but this is an amazing opportunity I had to apply for.

fishing
It will be hard to leave my wife and kids for a couple weeks, but they have been supportive.  In the background, you can see the type of “vessels” I am used to!

Why did I apply for Teacher At Sea?

I attended a NOAA workshop at Shedd Aquarium in Chicago, Illinois titled “Why and How We Explore the Deep Ocean.”  I went to the workshop to see if there was any ocean content I could work into my Integrated Physical Science class.  At the workshop, I discovered the amount of ocean content that fits in with the physics and chemistry content I currently teach is numerous.  The workshop was fantastic (if you are a teacher reading this I highly recommend you attend this workshop if it is available at a nearby location).  Towards the end of the workshop, the presenter discussed the Teacher at Sea opportunity.  I instantly knew I wanted to apply.  I came home from the workshop and told my family, “I’m going to apply to go on a research vessel with NOAA this summer.”  To which my wife (who has heard so many crazy ideas come out of my mouth) said, “Uh huh…okay.”  My oldest daughter responded, “Only if I can go with you.”  My son responds, “As long as it’s not over my birthday.”  My youngest just put the free NOAA bag from the workshop on her head like a helmet, and ran around the room.  So, with the obvious support of my family, I applied.

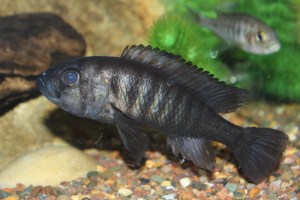
I had never felt so strongly about something.  I wanted to be a part of this experience for many reasons.  A) I wanted an experience working on an actually research mission.  I consider this extremely valuable for my classroom moving forward.  I envision taking research methods I learn from this trip and emulating them in my classroom.  B) I seek to strengthen my weaknesses.  My knowledge of ocean ecosystems is weak.  Part of this is being land locked in Illinois.  What better way to gain knowledge and appreciation for ocean ecosystems than to be a part of a team researching them?  I think when you lack understanding about something it is much easier to disregard it.  Ocean ecosystems are far too important to give little attention to them.  C) Being about a 1/3rd of the way into my teaching career I am looking for an experience that can ignite new ideas, and help me grow as an educator.  I am motivated and inspired by all kinds of simple things; I cannot imagine what this opportunity could do for me.  D) I like fish.  Simple I know, but its true.  The science club I run is called Conservation in Action (yes the CIA), and one of the projects we currently have running is keeping cichlids that are endangered or threatened in the wild, in our classroom.

IMG_0768
A male Lipochromis melanopterus that is housed in an aquarium in my classroom and cared for by members of our science club.

We currently have about 15 aquariums that some of our club members maintain with the goal of informing people of the plight of the Lake Victorian cichlids and other endangered fish, and keeping their population numbers in captivity healthy.


How can you prepare with me?

I would like to leave you with some resources that you can prepare for this trip with me.  There have been several sources given to me by NOAA, and some others I have found to be valuable as well.

A) What ship will you be on?  I will be on the Hugh R Sharp.  You can find out more about this vessel here.  This site from the University of Delaware even includes a video tour of the ship.  This will answer a lot of questions about what day to day life may be like for me on the trip, though I will be posting more about that in the coming weeks.

B) What is a scallop survey?  From what I understand, we will be collecting large amounts of samples from the ocean floor through dredging.  The samples would be brought on board and counted.  A record of overall population and populations at different life cycle stages is taken.  A report from a past survey is found on the NOAA website, and that is linked here.  This report by Dvora Hart is a great look at some of the technology and methods that may be used on this upcoming mission.

Did you know?

NOAA is predicting a more active than normal hurricane season in the Atlantic in 2017.

FINAL 0523 Hurricane Graphic_pie chart-700x400
Always a good article to read right before heading out for a couple weeks into the Atlantic Ocean!  However, I am not worried by this because I am in the hands of experts.  It is always good to be prepared and aware though.  The article is a good read with lots of links about NOAA’s weather predicting capabilities.
Above-normal Atlantic Hurricane Season is Most Likely This Year