Kevin Sullivan: Zooplankton, September 1-5, 2011

NOAA Teacher at Sea
Kevin C. Sullivan
Aboard NOAA Ship Oscar Dyson
August 17 — September 2, 2011

Mission: Bering-Aleutian Salmon International Survey (BASIS)
Geographical Area:  Bering Sea
Date:  September 1-5, 2011

Weather Data from the Bridge 

Leg 1 has concluded.  Oscar Dyson is currently at port in Dutch Harbor.  Please use link (NOAA Ship locator) to follow ship in future research cruises and current location/conditions.


Science and Technology Log

I am back home and my expedition aboard the Oscar Dyson has come to a conclusion.  My travels home had me leaving Dutch Harbor at 7:30 PM and arriving into Newark, NJ the following day at 2:30 pm EST, an incredibly long, red-eye flight back home.  Although my involvement aboard the ship has come and gone, the ship is currently in port at Dutch Harbor taking on more fuel and supplies and readying to do a “turnaround trip”.  For Leg II they will be heading back out into the Bering Sea to obtain further data.  The following is a map that depicts the stations for Leg 1 and 2.  For Leg 1, all of the green stations (40#) represents the areas where we conducted our research.  For Leg II, they will be focusing on the black circle stations.  When all of this field work is complete, and the numbers are “crunched” they can be extrapolated out to get a better idea of the overall health of the Bering Sea ecosystem as detailed in prior blogs.

BASIS 2011 Station Grids
BASIS 2011 Station Grid

So, before I left Alaska, I was discussing a bloom and readying the blog platform for a discussion of zooplankton and other higher-ordered interactions of the Bering.  Ok, so moving on…the next feeding level in the marine world would be the primary consumers….the zooplankton.  Zooplankton, although a very simplified explanation, are essentially animals that drift (planktonic) while consuming phytoplankton (for the most part).  These zooplankton in turn, are a resource for consumers on higher trophic levels such as the Pacific Cod, salmon,  and Walleye Pollock (which are a primary focus on this survey).  Zooplankton are typically small and in order to obtain samples from the sea, we have been utilizing specialized nets (information and pictures to follow) to extract, analyze and collect them for further investigations back at the lab.

The following picture is a good visual to represent this flow of energy that we have been discussing since the first Blog Entry.  An important observation is that the sun is the “engine” that initiates all of these interactions.  The exchange of carbon dioxide compliments of Photosynthesis and respiration, the abundance of phytoplankton in the photic zone (see last blog entry), which are food for the zooplankton, which in turn, become food for higher-order carnivores.

Marine Food Chain
Marine Food Chain

One of the more important zooplankton species out in the Bering are the euphasiids.  These are small invertebrates found in all of worlds oceans.  The common name is Krill.  These species are considered a huge part of the trophic level connection, feeding on the phytoplankton and converting this energy into a form suitable for the larger animals.  In the last blog, I put in some pictures of euphasiids that we caught.  These euphasiids have a very high lipid content (fat) and in turn, are what is responsible for getting salmon their richness in oily flesh, the Omega Fatty acids, and there natural, pink-fleshed color.  I have read before about the differences between farm-raised vs. wild salmon from a nutritional standpoint.  Farm-raised salmon often lack the abundant Omega oils that are found in the wild species.  Also, it is true that in order for the farm-raised salmon to get their pinkish color to the flesh, they are fed a nutritional supplement to give the color….essentially, like adding a food dye.  So, in class this year, we will have to be very careful when analyzing the pros and cons of aquaculture/fish-farming.

Personal Log

Although my official involvement with the Oscar Dyson has come to an end, I will take with me the experiences and knowledge for a lifetime.  It was everything I was hoping it would be and then so much more.  These blogs, the pictures, the video…… all do the expedition no justice.  However, I have pledged to make every effort possible to spread the word about NOAA and its mission and this is exactly what I will do.  I have several more decades of career in front of me and I know that between now and that date, I will use this recent expedition countless times and will hopefully convince the general public about the overall importance of government agencies like NOAA and how common resources must be valued and protected to ensure the health of all of Earth’s inhabitants.

There are so many people who I would like to thank for providing and delivering such an extraordinary experience.  All of the crew aboard the Oscar Dyson, from the engineers, to the chef,  and captain……Thank You.  Your professionalism and ability were truly inspiring.

To the Scientists, You were really the “teachers at sea”.  May you always continue your motivated path to revealing the beautiful secrets this planet has to offer.  Also, my hope that it continues to be done in a fashion that I saw while during my time on the water…..In a professional, unbiased, non-political fashion.  You have reassured my passion for the sciences and have given me fuel to disprove any “non-believers” who claim that the sciences have become corrupted.  In the end, you have shown me the most universal and balanced approach at reaching the truth.

Thanks for reading.

Kevin Sullivan: Bering Sea Bloom, August 28 – September 2, 2011

NOAA Teacher at Sea
Kevin C. Sullivan
Aboard NOAA Ship Oscar Dyson
August 17 — September 2, 2011

Mission: Bering-Aleutian Salmon International Survey (BASIS)
Geographical Area:  Bering Sea
Date:  August 28 – September 2, 2011

Weather Data from the Bridge
Latitude:  56.95N
Longitude: 162.93 W
Wind Speed:  10 Knots
Surface Water Temperature: 10.5 C
Air Temperature:  55F
Relative Humidity: 97%

Science and Technology Log:

Well, at this time tomorrow, the Oscar Dyson will be tied up in port at Dutch Harbor.  This is our end destination for Leg I of the BASIS survey.  I will write-up a summary/conclusion either at that time or shortly after getting back into town.  For now, I will fill you in on some material that I promised.  As noted in earlier blogs…I have been intentionally writing in a trophic bottom up approach.  That is, I started my first blog entries with descriptions of the primary producers, the Phytoplankton.  I covered this extensively and correlated it to the oceanographic work that has been going on aboard this ship.  It seemed logical to work from the base of the food chain and work my way up the trophic levels to the more complex consumers.

However, before I close the chapter on Phytoplankton take a look at the picture I took below.  When I stepped outside and saw this, I thought I had been transported to the Caribbean.  Clear skies, calm seas, tropical blue waters are not typical descriptions for the Bering Sea.  If you look closely enough, you can even see the shadow of the clouds on the surface of the sea.   Science is the field of making observations, forming hypothesis, designing and conducting experiments and drawing conclusions about the natural world we live in.  So…what would you make of this observation?  What has caused this temporary “mirage” of tropics?  Clearly something is going on here.

Coccolithophores
Coccolithophores 08-28-11

Well, although not 100% certain, the most likely explanation is what would be called a Coccolithophore bloom.  These are single-celled algae which are characterised by special calcium carbonate plates as seen in photo below under magnification.

Coccolithophore
Coccolithophore

Under certain conditions, (some speculate that wind pattern changes fail to mix the water column favoring cocolithophore blooms as opposed to other plankton) coccolithophores can create large blooms turning the water brilliant shades of blue pending on the species of coccolithophore blooming at the time.  Ed (Chief Scientist) was telling me of a major bloom that had occurred back in the late 90’s.  I researched it a bit and the following picture is of this bloom in the same general vicinity where we are now.  Amazing to think of how microscopic plants can influence a region on the scale of an entire sea and be seen from space. *Note: this is not a false colored Image

Coccolithophore Bloom 98 Bering Sea

There is also some speculation that these types of blooms may be linked to sub-average runs of salmon (and even impact seabirds negatively in the area).  Some hypothesize that this may be due to the idea that salmon prey heavily upon euphausiids (see picture I took below on 08-28-11 and the one centered beneath for a closer look taken from NOAA) and the euphausiids have difficulty subsiding on the extremely small coccolithophores.  Remember what I was saying about visualizing the flow of energy as a pyramid and the effects of taking out a few or many blocks that make up the base of the food chain.

euphausiids 08-28-11
Euphasiid
Euphasiid

Ok, to make this easier for the reader, I am going to stop this blog here and start a new one dedicated to the zooplankton…..I got a little sidetracked with the whole coccolithophore bloom event…….

Personal Log

Earlier this morning we were greeted with some higher winds and consequently some larger seas.  As my friend back East says conditions got “Sporty.”  Here is a picture from where we launch the CTD.  Winds were out of the SW gusting to 30 knots and seas were in the 10′ range with some larger swells thrown into the mix to keep things interesting.

Bering 09-01-11
Bering 09-01-11

Kevin Sullivan: Baring the Bering, August 28, 2011

NOAA Teacher at Sea
Kevin C. Sullivan
Aboard NOAA Ship Oscar Dyson
August 17 — September 2, 2011

Mission: Bering-ALeutian Salmon International Survey (BASIS)
Geographical Area:  Bering Sea
Date:  August 25-28, 2011

Weather Data from the Bridge
Latitude:  56.95N
Longitude: 162.93 W
Wind Speed:  10 Knots
Surface Water Temperature: 10.5 C
Air Temperature:  55F
Relative Humidity: 97%

Science and Technology Log

My attempt at play on words for the title: “Baring the Bering”…… somewhat fitting as what we have been doing is literally trying to uncover and expose the hidden truths and secrets that this sea has to offer.  I have become more comfortable with the scientific terminology being used on board and also have gotten into a nice flow with the overall processes going on and with the actual procedures and techniques being utilized to conduct these investigations.  In the last blog entry, I was discussing the work I was doing alongside the oceanographers. I have been continuing this work and adding additional learning outcomes each day as this team throws more and more learning opportunities my way.

For example, yesterday we were dealing with primary productivity. This study is essentially trying to determine the rate at which photosynthesis is occurring.  The amount of Phytoplankton–autotrophs (Self-feeders) obtaining their energy from sunlight–varies in different ecosystems as well as over time.  For example, for the school where I teach, Sandy Hook, NJ is a nearby coastal estuarine system.  Being an estuary and at mid-latitude, we have very high nutrient levels compliments of river runoff (in fact, excess runoff leads to algal blooms…think of it as pouring liquid Miracle-Gro into the waters and the resulting bloom that would occur.  In the end, unfortunately, it leads to eutrophication, decrease in O2 and potentially fish kills) as well as strong sun angle.  Therefore, we have large availability of productivity and biomass.  The Bering Sea also has tremendous productivity and therefore biomass as well.  Here, the relatively shallow seas of the Bering allow the Phytoplankton to transfer solar energy into chemical energy within the photic zone (area in which sun can penetrate). This coupled with the upwelling of nutrients off the shelf-break create the base of the food chain within these valuable, productive fisheries.  There is still a lot of uncertainty as to the transport and fate of this setup but it is clear that we need to learn more and concentrate our efforts into putting these pieces together.

So, the actual procedure is to again take water from the CTD’s (explained in last Blog) Niskin Bottles at various depths and then “feed” these marine plants nutrients and give them there other ingredient to conduct photosynthesis, which is sunlight (they are already in H2o).  We then take these samples and put them into a tank which is on the deck of the boat and has continuously circulating water.  We also put on Mesh Nylon bags to mimic the light concentration from the various depths they were taken from.  So for example, a sample taken at surface or near surface may be left without coverage whereas a sample taken at 50 meters may have two bags over the bottle and scatter the light entering to be representative of the light conditions the sample came from.  In the picture below, you can see this tank, the bottles under experiment (the gray bottle in lower left is one with a mesh bag for light reduction and the dark bottle in the lower right allows no light through and is the control)  and the continuous water circulating output in the lower right hand of the tank.

Primary Productivity Experiment

Now, the cool part of this, is that the nutrients that we introduced to the sample have been “laced” by stable isotopes of Carbon and Nitrogen.  This way, after the sample has been filtered and the chlorophyl analyzed, we can make certain assumptions about how productive these phytoplankton are based on the isotope markers.

I cannot emphasize the importance of these producers enough.  Think of them as being the base of a pyramid (which is often used by ecologists) — if they are removed, all of the other trophic (feeding) levels cannot exist.  It takes a tremendous amount of producers to feed fewer and larger carnivores.  This has to do with a rule in Ecology/Biology refered to as the “10% rule”.  We cover this in class and will review it in more detail.  In the interim, check out this website for pre-reading information on the flow of energy in an ecosystem.

I often cite the following excerpt in class to illustrate this concept:

“Three hundred trout are needed to support one man for a year. The trout, in turn, must consume 90,000 frogs, that must consume 27 million grasshoppers that live off of 1,000 tons of grass.”

G. Tyler Miller, Jr., American Chemist (1971)

Ok, so for the next few blogs, I will start to debrief my followers on my experiences aboard the Oscar Dyson as they relate to the Fisheries end of this cruise and tie it into the Oceanographic studies I have spent the last few entries explaining.  I figured it made most sense to start at the base of the food chain and make my way up to the higher ordered species and then summarize with the interactions of all components for the Bering Sea and in turn, our global sea that represents 97% of all of Earth’s water supply.

In the interim, check out Where I am, almost real-time HERE.  From this site, you can obtain current latitude/longitude, wind speed, water temp etc.

Personal Log

As I noted in the last blog, Hurricane Irene was a real threat to the East Coast and NOAA’s “Hurricane Hunters” (see last blog entry) did an excellent job at keeping the public informed about the status of the storms strength, location, and traveling direction.  I brought it up last entry to illustrate the depth and scope of NOAA as an organization.  Now that she has come and left her mark, lets take it one step further.  Many places in the Mid-Atlantic received over 10″ of rain.  Can you name two major river basins along the East Coast that drain into the Atlantic Ocean?  If this water travels over millions of people’s yards (that have been heavily fertilized), and farming areas with livestock, think of the nutrient input into the Atlantic Basin.  Relate this to the work currently being done on the Oscar Dyson.  Remember, that off our coast of NJ, we often have to worry about an influx of too many nutrients and algal blooms…..If you want to learn more about causes/effects, then read this website about eutrophication.

During our travels yesterday, we were just offshore of very remote Cape Newenham, Alaska.  I took the following picture.  At the top of this mountain you can make out a white structure.  This was part of a system titled “White Alice Communication Systems” which was a “US Air Force telecommunication link system constructed in Alaska during the Cold War.  It also connected remote Air Force sites in Alaska such as Aircraft Control and Warning (AC&W), Distant Early Warning line (DEW Line) and Ballistic Missile Early Warning System (BMEWS).  The system was advanced for its time, but became obsolete within 20 years following the advent of satellite communications.” (http://en.wikipedia.org/wiki/White_Alice_Communications_System)

White Alice 08-27-11
Chum Salmon 08/26/11

Kevin Sullivan: Bering Sea Bound, August 22, 2011

NOAA Teacher at Sea
Kevin C. Sullivan
Aboard NOAA Ship Oscar Dyson
August 17 — September 2, 2011

Mission: Bering-ALeutian Salmon International Survey (BASIS)
Geographical Area:  Bering Sea
Date:  August 22-24, 2011

Weather Data from the Bridge
Latitude:  N
Longitude:  W
Wind Speed:  20-23kts Tue,Wed. seas 9′ Thu 8/25 = calm
Surface Water Temperature:  C
Air Temperature:  55F
Relative Humidity: 70%

Science and Technology Log

We are on Day II of our travels to get to our first sampling station located in the SE Bering Sea.  We will begin our fishing operations today!  We have had decent weather thus far although we did just go through Unimak Pass (see picture below of location) which is a narrow strait between the Bering Sea and the North Pacific Ocean.  This passage offered a time of heavier seas.  I’m guessing that like any strait, the currents may become more funneled and the seas “confused” as they squeeze through this area.  It’s kind of analogous to it being more windy in between buildings of a major city vs. suburbia as the wind is funneled between skyscrapers.  I also imagine this to be a popular crossing for marine mammals as well.

Interesting to think that both marine mammals and humans use this passage to both get to the same things: a food source and a travel route.  It’s a migratory “highway” for marine mammals, and a heavily-trafficked area for humans in international trade and commercial fisheries.

Anyway, the Bering Sea is a very unique body of water. It really is the way that I imagined it.  It is as though you are looking through a kaleidoscope and the only offerings are 1000 different shades of grey.  It is rainy, foggy, and windy.  I can appreciate how this sea has been the graveyard for so many souls and fishing vessels in the past who have tried to extract the bounties it has to offer.

unimak pass
unimak pass

As of Wednesday, the 24th, we have finished 4 stations of the 30 that have been planned for Leg I of this study (Leg II is of similar duration and goals).  I was involved with helping the oceanographic crew with their tasks of collecting and evaluating various parameters of water chemistry.  To do this, an instrument called a “CTD”– an acronym for Conductivity, Temperature, and Depth — is lowered.  This instrument is the primary tool for determining these essential physical properties of sea water.  It allows the scientists to record detailed charting of these various parameters throughout the water column and helps us to understand how the ocean affects life and vice-versa.

One aspect that I found very interesting is the analyzing of chlorophyll through the water column.  All plant life on Earth contains the photosynthetic pigment called chlorophyll.  Phytoplankton (planktonic plants) occupy the photic zone of all water bodies.  Knowing that we live on a blue planet dominated by 70% coverage in water, we can thank these phytoplankton for their byproduct in photosynthesis, which is oxygen.  Kind of strange how you often symbolize the environmental movement with cutting down of the rainforests and cries that we are eliminating the trees that give us the air we breath.  This is true, but proportionately speaking, with an ocean-dominated sphere, we can thank these phytoplankton and photosynthetic bacteria for a large percentage of our oxygen.  Additionally, being at the base of the food chain and primary consumers, these extraordinary plants have carved a name for themselves in any marine investigation/study.

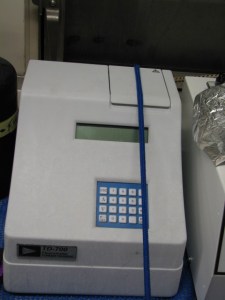
The procedure to measure chlorophyll involves the following:  water from the Niskin Bottles (attached to the CTD, used to “capture” water at select depths) is filtered through different filter meshes and the samples are deep-frozen at -80F.  To analyze chlorophyll content, the frozen sample filter is immersed in a 90% solution of DI (Distilled Water) and acetone which liberates the chlorophyll from the phytoplankton.  This is then sent through a fluorometer.

Filtering water from CTD for Chlorophyll Measurements

Fluorescence is the phenomena of some compounds to absorb specific wavelengths of light and then, emit longer wavelengths of light.  Chlorophyll absorbs blue light and emits, or fluoresces, red light and can be detected by this fluorometer.

Fluorometer; Berring Sea 08-25-11

Amazing to think that with this microscopic plant life, you can extrapolate out and potentially draw some general conclusions about the overall health of a place as large as the Bering Sea. Oceanographic work is remarkable.

CTD Berring Sea 08-24-11


Personal Log

The crew aboard the Oscar Dyson have been very accommodating and more than willing to educate me and take the time to physically show me how these scientific investigations work.  I am very impressed with the level of professionalism.  As a teacher, I know that most often, the best way to teach students is to present the material in a hands-on fashion…inquiry/discovery based.   This is clearly the format that I have been involved in while in the Bering Sea and I am learning a tremendous amount of information.

The food has been excellent (much better than I am used to while out at sea).  The seas have been a bit on the rough side but seem to be settling down somewhat (although, I do see a few Low Pressure Systems lined up, ready to enter the Bering Sea…..tis the season).  Veteran seamen in this area and even in the Mid-Atlantic off of NJ, know that this is the time of year when the weather starts to change). On a side note, I see that Hurricane Irene has its eyes set on the Eastern Seaboard.  I am hoping that everyone will take caution in my home state of NJ.

Lastly, it’s amazing also to think of the depth and extent of NOAA.  With oceans covering 70% of our planet and the entire planet encompassed by a small envelope of atmosphere that we breathe, it is fair to say that the National Oceanic and Atmospheric Administration is a part of our everyday lives.  I am in the Bering Sea, one of the most remote and harsh places this planet has to offer and across the country, there are “Hurricane Hunters” flying into the eye of a hurricane that could potentially impact millions of people along the Mid Atlantic………..Both operated and run by NOAA!

Sunset on the Berring Sea 08-24-11
Sunset on the Bering Sea 08-24-11

Kevin Sullivan: Awaiting Departure, August 20, 2011

NOAA Teacher at Sea
Kevin C. Sullivan
Aboard NOAA Ship Oscar Dyson
August 17 — September 2, 2011

Personal Log

I arrived into Kodiak Island late Wednesday night.  I came in around midnight local time, which  put my total travel time for the day somewhere in the 17-hour range!  Coupled with a time difference of 4 hours from the East Coast I was surely in need of some downtime.

After some rest, the next day I was able to explore a bit of Kodiak Island until the remaining crew came into town.   I went to the Kodiak Fisheries Research Center, as well as some local museums and other points of interest.  Despite the rain and fog, I walked around and really enjoyed the opportunity to explore in seclusion.  Later that evening, the rest of the scientific crew arrived into Kodiak, we all met up and grabbed some dinner and introduced ourselves and spoke of our future together.

Thursday was continued with more overcast, socked in pea-fog conditions, with visibility coming down to <.25 mile at times.  Our trip was supposed to leave early in the morning this day which was delayed until 3:00 PM and then again delayed until 1:00 PM the following day (Friday the 20th). The delays were a result of having to wait for a specific part that the boat needed prior to leaving port.  Due to the added delay, we decided to go  investigate some intel from locals about Kodiak Bear spotting sites.  Luckily enough, we found them taking advantage of pink and coho salmon spawns occurring.  The Kodiak bear, in preparation for winter and hibernation, must gorge itself leading up to the cold winter months.  The salmon spawns coinciding with this bear’s requirement are a perfect example of evolution and “nature’s clock” at work.  It reminds me of the Horseshoe crab back in NJ wherein their eggs laid in the spring become the food for the migratory red knot bird coming all the way from South America.  The timing is just perfect.  The Kodiak seems to target the brains of the salmon as well as the belly of this fish where the eggs are located (you can see this in the picture I took below of the pink Salmon).  This ensures that every bite is as most calorically packed as possible with the warmer days ending and winter approaching.

Kodiak Brown Bear. Taken 08-19-11
Pink Salmon Spawn.  Taken 08-19-11
Pink Salmon Spawn. Taken 08-19-11

Friday morning all scientists and new crew attended a meeting at 8:30 A.M. to discuss the logistics of the trip.  Specifically, the lead scientist, Ed Farley, reviewed how the average day was going to unfold with the various investigations going on.  The goal seems to be to get to three stations a day with each station consisting of acoustics studies, oceanography, zooplankton and lastly, a fishing trawl.  Conducting this much research all on one boat in one trip is quite ambitious and unique in the marine world.  I will be getting into the details of these activities as the trip gets underway.  Lastly, the meeting included a debriefing on vessel safety.

So far, the trip has been eye-opening.  It is amazing to be able to experience the amount of planning and logistics that must go into an expedition of this magnitude.  Every corner I turn, there are crew-members busily working and focused on their duties.   The ship itself is analogous to a bee’s nest and its crew members the bees themselves.  They are all performing certain functions all for a common goal.  It is also very inspiring to see how passionate these leading scientists and crew members are about the work they do.  It is truly contagious and has reinvigorated my own passion for the sciences.

Mountain Peak Through The Fog

Kevin Sullivan: Introduction, August 3, 2011

NOAA Teacher at Sea
Kevin C. Sullivan
Aboard NOAA Ship Oscar Dyson
August 17 — September 2, 2011

Mission: Bering-ALeutian Salmon International Survey (BASIS)
Geographical Area:  Bering Sea
Date:  August 3, 2011

Hello!  I am a public high school science teacher grades 9-12 for the Middletown District in Middletown, NJ.  I have been a teacher here for seven years.  I teach Environmental and Marine Sciences.  Prior to working in education, I was employed by Groundwater and Environmental Services (GES) where I did Environmental Consulting work for Exxon/Mobil.  I live directly across the street from the Atlantic Ocean in Sea Bright, NJ.  I enjoy anything associated with saltwater and am an avid saltwater fisherman.  Below is a picture of a Cubera Snapper that I caught while fishing in Costa Rica.

Cubera Snapper
Here I am (left) holding a Cubera Snapper I caught while fishing in Costa Rica.

A little about my education….  I have a Bachelors of Science in Environmental Science with Minor in Marine Sciences from Stockton State College in Pomona, NJ. I also hold a graduate degree in Geosciences from Mississippi State University. By December of this year, I will finish a masters in Science Education from Capella University.

On August 17th 2011, I will be departing from NJ to begin my two-week adventure aboard NOAA Ship Oscar Dyson. I am extremely excited to be a part of such a wonderful opportunity that has been awarded to me through the NOAA Teacher at Sea Program.

To be given the opportunity to be able to work with scientists in the field is remarkable!  I feel very fortunate to be part of such a rare opportunity and look forward to being able to share with my students, the enthusiasm and knowledge that this expedition will present.

The operating area of this cruise will be the Southeastern Bering Sea Shelf.

To learn more about the objectives of this cruise prior to my departure, please refer to the Bering-Aleutian Salmon International Survey (BASIS) webpage.

I look forward to posting much more as my travels begin.