John Schneider, July 6, 2009

NOAA Teacher at Sea
John Schneider
Onboard NOAA Ship Fairweather 
July 7 – August 8, 2009 

Mission: Hydrographic Survey
Geographical Area: Kodiak, AK to Dutch Harbor, AK
Date: July 6, 2009

Position 
57° 43.766’ N, 152° 30.946’ W (Pier at USCG base – Kodiak)

Weather Data from the Bridge 
Barometer: 1022mB (30.15”) This is a nominally high pressure air mass characterized by cool temperatures and clear skies.
Wind: 4-6 kts (gusts to 12) 30º off the port bow (ship is facing ~60º at the pier)
Temperature: low 60’s Sea state: calm

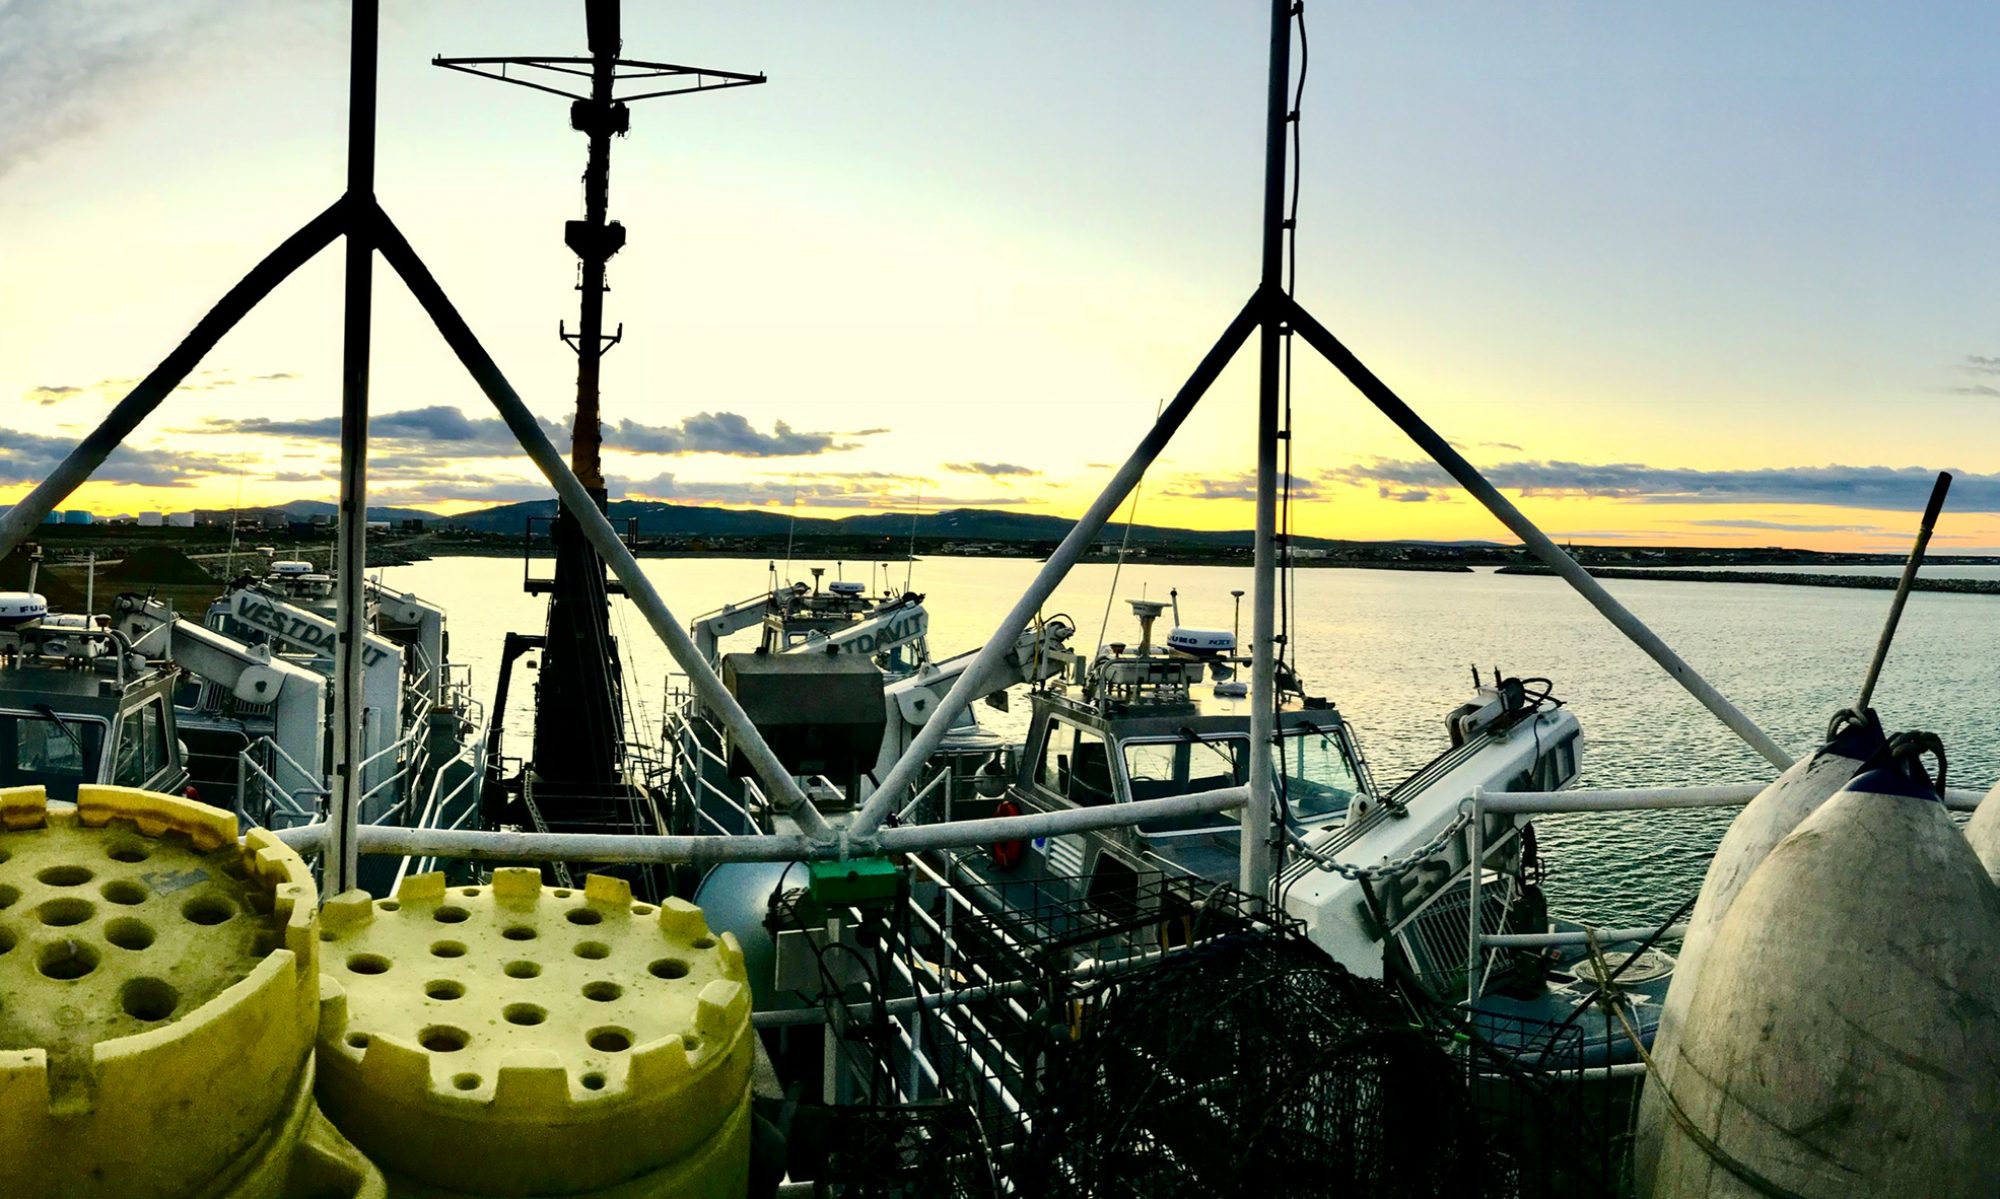
The FAIRWEATHER alongside the USCG Pier, Kodiak

Science and Technology Log 

Our mission on this cruise is to conduct small-boat hydrographic research and documentation of the sea floor in the Shumagin Islands region.  This is an area about 250 miles Southwest of Kodiak. It’ll take about a full day of steaming just to get there.  I took a rough estimate of an area of approximately 900 square miles in the Shumagins and found a total of about 100 depths recorded! I realize that the numbers may be hard to read, but the picture to the left is just South of Nagai Island in the Shumagins and includes about 900 square miles.  As you can see, there are very few markings in the area.  Compare this with the picture to the right of an area of the same size more thoroughly surveyed.

A nautical chart of the area the Fairweather will be surveying, called the Shumagin Islands.

The 1953 Coast Pilot says of the Shumagins “…comprising 15 sizable islands and many islets and rocks, extend for a distance of 60 miles from the coast of the Alaska Peninsula from which the group is separated by Unga Strait.”  The newest edition (2008) is worded identically!  It’s obvious that there is a need for research in the area and newer charts available to mariners will benefit from the data we collect in the next leg of the Fairweather’s tasking. Regarding data collection and storage, yesterday I was shown the compartment (room) where the on board computer servers are kept.  It is one of the significant responsibilities of the duty officers to regularly check the temperature of that compartment as the entirety of the data collected is stored on those servers.  If the entire mission runs flawlessly and the data are allowed to be compromised, the mission is ultimately a failure.

Barnacles
Barnacles

Historically, soundings were taken by lowering a weighted line—called a “lead line” because the weight was often made of lead—to the bottom and seeing how deep the water is at that location.  Positions were estimated by manually triangulating “fixes” using visual bearings to known landmarks.  Later (from the 1950’s through the 1970’s) positions were established using LORAN (Long Range Radio Navigation) and Radar and depths were determined using depth sounders which bounce an electronic “ping” off the bottom. All of these earlier methods were very prone to human error and imprecision.

Bald eagle
Bald eagle

Current technologies integrate multi-beam sonar interfaced with computers and satellites to determine position (within just a couple of feet) and not only the depth of the water straight down, but off to the sides. When the data are uploaded to the Fairweather, the computers on board coordinate the exact time, GPS position, tide level, temperature, salinity and clarity of the water at the position of the data acquisition allowing the computers to correct for the different rates of transmission of the sonar signal through differing densities of water to determine the most accurate sea floor information ever possible. So now, as a navigation term, “by the Mark, Twain” (meaning 2 fathoms of depth) is obsolete…but the literary contributions of Samuel Langhorne Clemens remain a tribute to America’s heritage!

Personal Log 

All the dark spots are Bison!

Today at the 1400 pre-cruise briefing I was fortunate to be present when two of the officers on the Fairweather were acknowledged as having been promoted.  The response of the crew demonstrated the respect these officers had earned. If lunch today was any indication of how the meals will be on board, I can’t wait for dinner and don’t want to go home!  Fajitas with about 15 different toppings available, corn on the cob, salad and soup!

Animals (or other cool stuff!) Observed Today 

Fox along the road!
Fox along the road!

While gazing down into the water alongside the ship, I noticed what appear to be 2 different species of jellies – one looking similar to the East Coast’s Aurelia aurelia about 10” in diameter and the other being unknown to me.  The unknown was radially symmetrical (as are all jellies) but all of them had 8 distinct lobes on the bell and measured about half the size of the other species.

I also noticed barnacles, mussels and sea anemones living on the pilings that hold up the pier.  The anemones at left must have been three inches in diameter at the body tube and the tentacles extended in a halo about 10-12 inches in diameter. On a 2.5 hour drive this afternoon I also saw 2 bald eagles, a herd of bison, a red fox and a kingfisher. (The fox picture is a bit blurred, it was a bit skittish and I took it through the windshield.) 

Questions for You to Investigate 

What animal did Benjamin Franklin want to use as a National Symbol? When were the Shumagin Islands named?  For whom are they named? What is scurvy and how is it prevented?

Bison?  Is this Wyoming?!
Bison? Is this Wyoming?!

Jill Stephens, June 23, 2009

NOAA Teacher at Sea
Jill Stephens
Onboard NOAA Vessel Rainier 
June 15 – July 2, 2009 

Mission: Hydrographic Survey
Geographical area of cruise: Pavlov Islands, AK
Date: June 23, 2009

Weather Data from the Bridge 
Position: 55°08.576’N  161°41.010’W
Visibility: 10 nautical miles
Sky: broken clouds
Wind: 230° @ 10 knots
Sea: 0-1 feet
Pressure: 1009.3 mbar
Temperature:  Sea 6.1°C; Dry Bulb 8.9°C; Wet Bulb 7.8°C

The CTD sits near the surface for two minutes to acclimate to the environment and begin collecting data.  The instrument is then lowered to the bottom and retrieved using the winch.
The CTD sits near the surface for two minutes to acclimate and begin collecting data.

Science and Technology Log 

Ian Colvert, Martha Herzog, and Matt Abraham are my team for today.  We are working in area that has not had any survey lines run yet. We are the first to explore what lies beneath the water!  The survey that we are conducting today will involve running long lines instead of filling in polygons. The long survey lines provide the survey techs with an idea of what to expect for the area and assist them in planning the polygons that will be covered later.  If rocks are known to exist, these first lines go near to them in an effort to determine bottom features at a safe distance.

The Reson froze twice today for some reason, but was able to start right up again.  This issue was brought up at the daily meeting and it appears to have happened on another launch as well.  (The ship is in frequent contact with the company and will have a solution to this problem quickly.)

The instrument is then lowered to the bottom and retrieved using the winch.

Personal Log 

I was able to pilot the launch for a complete line today.  I am proud to say that after learning to orient the boat using the information on the screen, I did a good job.  After the first cast of the CTD, Martha and Ian let me go ahead and perform the next two casts of the day.  The data collected from the casts was good, so we did not have to perform any recasts.

Ian made a couple of movies of the Reson data today that I will be able to take back to my classroom. I went ahead and took pictures of the side scan display to show students. I am going to go ahead and use my digital camera to make a movie of the side scan screen.  Hopefully, it will work.

In the area that we surveyed today, there is a huge, interestingly shaped rock. As we passed by the rock, we noticed light colored areas along the rock. These light colored areas were seals. It was an impressive sight!

Animal Sightings 

More than 30 seals

The light brown areas near the base of the rock are actually seals.


Kristin Joivell, June 16, 2009

NOAA Teacher at Sea
Kristin Joivell
Onboard NOAA Ship Fairweather
June 15 – July 1, 2009 

Left is my bunk card.  Notice the precise location or “muster” for each emergency.
Left is my bunk card. Notice the precise location or “muster” for each emergency.

Mission: Hydrographic Survey
Geographical area of cruise: Shumagin Islands, Alaska
Date: June 15-16, 2009

Weather Data from the Bridge   
Position: Woody Island Channel
Clouds: Partly Cloudy
Visibility: 10 miles
Wind: light
Waves: less than 1 foot
Temperature: 15.8 dry bulb
Temperature: 12.9 wet bulb
Barometer: 1012.6

Science and Technology Log 

From a teacher’s standpoint, the best thing about being on a ship is seeing the real world applications for all of the basic science process skills that I teach.  Skills like making accurate observations, collecting data precisely, and communicating clearly are second nature in a career with NOAA.

The Fairweather appears out of the fog.

One of the things that impressed upon me as we left the port at Kodiak and began the journey to the Shumagin Islands was the need for each person on board to know just what to do at the necessary time.  The need to be in the “right place” at the “right time” is shown again and again.  For example, each person has a bunk card that describes where to be when different types of alarms sound.  When one of the three alarms sounds, each person on the ship has a specific job and place to report. Whether it is an abandon ship, man overboard, or fire alarm, each person must be in their place to be accounted for and to do their job to help regain control of the situation. For someone still learning where all of the decks are located, this was a small challenge!

Here I am reading the temperature for the Weather Log.  There are two thermometers:  wet bulb and dry bulb.  The readings on both of these thermometers are read to help determine weather patterns, specifically relative humidity.
Here I am reading the temperature for the Weather Log. There are two thermometers: wet bulb and dry bulb. The readings on both of these thermometers are read to help determine weather patterns, specifically relative humidity.

Another point that stood out to me was the importance of accurate observations.  I often try to impress upon my students the importance of making observations in a precise scientific manner, but here on the ship I noticed real world applications of this skill in action especially on the bridge. Everywhere on the ship, but especially on the bridge, accuracy of observations is a must.  Weather is checked every hour. This weather is periodically sent into a weather service.  Accurate observations are necessary so that weather can be predicated and charted and the necessary changes can be made in plans for missions and travel.

Also, the ship’s course is charted on a map.  Although computers are used for much of the navigation, the location on a paper map is charted as well. In fact, the whole goal of the mission is to attain more accurate charts of the ocean floor.  The NOAA film, ‘The Surveyors,’ discusses the historical roots of hydrographic surveying.  The film promotes the idea that NOAA was formed since so many ships were being lost at sea.  As I watched the film, I realized the just how NOAA is an essential part of the battle against lost ships.  After beginning my surveying training on the computer, I found out that 95% of all US foreign trade enters or leaves by ship. To make the job even more complicated, surveying the ocean floor is an ongoing task since changes occur in the ocean floor constantly. Thinking about this made me look forward to the surveying work in the Shumagins even more since the data collected by NOAA could save someone’s life.

Personal Log 

Here I locate the Fairweather’s position on a map.  The location of the ship is determined using triangulation and simple geometry.
Here I locate the Fairweather’s position on a map. The location of the ship is determined using triangulation and simple geometry.

Yesterday, while still in port at Kodiak, I went on a hike to the top of Barometer Hill.  I think the name “Hill” is misleading since at the summit it is approximately 2500 feet above ground level. As I looked up at the mountain, I was in awe of its height and the purity of the surrounding terrain. Most of the hikes I’ve been on show signs of civilization throughout the hike, from garbage to power lines over the trail, but not here in Alaska!

I was not to be disappointed.  About halfway up to the summit, a brown bear approached our group.  Another hiker and I were nearing the top of a rise.  Upon glancing behind, we noticed a bear peeking out from below the rise we had just climbed. We made some noises and it went down the mountain, leaving tracks in the snow patches.  We were able to watch its progress down the mountain and through the brush at the base…the brush we had just walked through to get to the trail!


Here is Barometer Hill from the base of the mountain.  Note the total absence of human impacts such as billboards, structures, and especially power lines.  Hiking up the mountain there were a few scraps of paper, but not much trash at all compared to my experiences hiking in Pennsylvania.
Here is Barometer Hill from the base of the mountain. Note the total absence of human impacts such as billboards, structures, and especially power lines. Hiking up the mountain there were a few scraps of paper, but not much trash at all compared to my experiences hiking in Pennsylvania.
The brown bear going down Barometer Hill. It covered the distance quite quickly and made it to the base of the mountain in about 10 minutes, much quicker than my hiking speed.  Photo courtesy of David Francksen.
The brown bear going down Barometer Hill. It covered the distance quite quickly and made it to the base of the mountain in about 10 minutes, much quicker than my hiking speed. Photo courtesy of David Francksen.

As we continued hiking to the top, much of the terrain was steep, treacherous, and rocky, but the views at the summit were extraordinary and gave a 360 degree vantage point of the surrounding land and water. Looking around at the surrounding geography, I was able to see just how special Alaska is from a naturalist’s standpoint.

The view from the top of Barometer Hill.  The wilderness keeps extending in the distance.
The view from the top of Barometer Hill. The wilderness keeps extending in the distance.

Create Your Own NOAA Experiment at Home 
You can collect weather data using the same tool used on the bridge of the Fairweather. Create a wet and dry thermometer system by wrapping the bulb of one thermometer in wet paper towels and keeping one thermometer uncovered.  Compare the temperatures over a period of time and make a line graph.  What trends do you see on the graph?  Which temperature tends to be lower? What can you infer from this about the way your body feels when you’re in wet clothes compared to the way your body feels when you’re in dry clothes?

After further investigating the wet bulb and dry bulb temperatures here on the ship, I found that the book National Weather Service Observing Handbook No. 1 printed by NOAA in 2004 gave me a better understanding of how this all fits together scientifically by stating, “The wet bulb thermometer works on the principle that water evaporating from the muslin wicking [paper towel] absorbs heat from the thermometer bulb and mercury.  When the air is dry, containing little moisture, evaporation will be rapid.  If the air is very moist, evaporation from the muslin [paper towel] will be slight.” (p. S-93).  To me this makes sense since evaporation, biologically as precipitation, helps to cool your body.  The graph below provides a more in depth look into the connection between dry bulb temperatures, wet bulb temperatures, and relative humidity.

On this graph, you can see how the relative humidity percentage gets higher as dry and wet bulb temperatures get closer together.  The inverse is true as well; the relative humidity gets lower as dry and wet bulb temperatures get further apart.  Psychrometric chart provided courtesy of Richard Brennan.
On this graph, you can see how the relative humidity percentage gets higher as dry and wet bulb temperatures get closer together. The inverse is true as well; the relative humidity gets lower as dry and wet bulb temperatures get further apart. Psychrometric chart provided courtesy of Richard Brennan.

Elise Olivieri, May 17, 2009

NOAA Teacher at Sea
Elise Olivieri
Onboard Research Vessel Hugh R. Sharp 
May 9 – 20, 2009 

Mission: Sea Scallop Survey
Geographical area of cruise: Northwest Atlantic
Date: May 17, 2009

Weather Data from the Bridge 
Air Temperature: 13.61 Degrees Celsius
Barometric Pressure: 1012 mb
Humidity: 97 %

Here you can see the many different sizes of sea scallops.

Science and Technology Log 

So Far the sea scallop survey has collected 76,170 sea scallops which can also be expressed as 9,251 kilograms.  This is a tremendous amount of scallops and the survey is not even a third of the way complete.  At stations where crabs and starfish were sampled we have collected 8,678 cancer crabs and 279,768 starfish (Asterias) so far. Without a reliable database like FSCS it would be impossible to keep up with such a large amount of information.

Today I got a chance to talk with Shad Mahlum.  He is a seagoing technician for NOAA and was born and raised in Montana. He has experience working with freshwater surveys.  In the past years he has studied how beaver dams influence native and non-native species of freshwater fish.  Shad also spent some time looking at various cattle grazing strategies and how they affect food chains. Shad loves working on the open ocean and the physical process of sea scallop surveys.  Shad hopes to work with freshwater and saltwater projects in the future.

Here I am holding a scallop and a Red Hake.

As I was gazing out into the deep blue sea a very large animal caught my eye.  I was so excited to see another Finback Whale.  They are the second largest animal on earth after the Blue Whale.  They are known to grow to more than 85 feet. Finbacks are indifferent to boats. They neither approach them nor avoid them.  Finback Whales dive to depths of at least 755 feet. They can grow anywhere from 30-80 tons. Finbacks eat Krill, fish and squid and their population numbers are approximately 100,000 or more.  The only threats Finbacks have are polluted waters.  It is incredible to see such a large animal breaching out of the water.  I will never forget it.

Animals Seen Today 

Wrymouth Squid, Eelgrass Slug, Razor Clam, Lobsters, Green Sea Urchin, Macoma clam, Sea Stars (Asterias), Horseshoe Crab, Fourbeard Rockling, Palmate Sponge, Hermit Crab, Black Clam, Golden Star, Tunicate, Winter Flounder, Surf Clam, Yellowtail Flounder, and Sea Mouse. 

Mary Anne Pella-Donnelly, September 16, 2008

NOAA Teacher at Sea
Mary Anne Pella-Donnelly
Onboard NOAA Ship David Jordan Starr
September 8-22, 2008

Mission: Leatherback Use of Temperate Habitats (LUTH) Survey
Geographical Area: Pacific Ocean –San Francisco to San Diego
Date: September 16, 2008

Weather Data from the Bridge 
Latitude: 3720.718 N Longitude: 12230.301
Wind Direction: 69 (compass reading) NW
Wind Speed: 12.0 knots
Surface Temperature: 15.056

Scott measures a moon jelly as Amy records data.

Science and Technology Log 

The LUTH Survey is a collaborative effort to gather as much oceanographic data from this small part of the Pacific Ocean as possible.  Although the primary objective is to characterize this area for its potential as leatherback habitat, it is also an opportunity for other scientists to gather data that reinforces their studies. Everyone on this cruise, aside from myself, is employed by the National Oceanographic and Atmospheric Administration’s National Marine Fisheries Service.  The regional area that this group works in is the Southwest Fisheries Science Center.  There are nine scientists who have very different specializations.  The following flow chart outlines how each department is related to the others.

Crewmembers practice suction cup tagging of leatherbacks from a Rigid Hull Inflatable Boat (RHIB).

Every division is focused on different aspects of oceanography.  Scott Benson is our chief scientist and leatherback specialist.  Karin Forney is the research biologist on the team whose expertise is marine mammals and regulations out to the limit of United States waters.  This limit is the EEZ – Exclusive Economic Zone – and extends for 200 miles west of the coast. Peter Dutton is currently the leader of the Marine Turtle Genetics Program, here to gain additional insight into foraging habitats of the leatherback.  Liz Zele, oceanographer, and Justin Garver as oceanography intern, manage the collection and processing of oceanographic data from the CTDs and XBTs. Steven Bograd is supporting the data collection as a research oceanographer. Both George (Randy) Cutter and Juan Zwolinski collect and interpret the acoustic data.  Randy’s area of expertise is with fisheries acoustics, seafloor mapping and autonomous underwater vehicles.  Juan’s specialty is in acoustic estimation of small pelagic fish.  Amy Hapeman is aboard as a permit analyst to gain a better understanding of how the science data are collected.  Together, this dynamic group will work to put together a better picture of what habitat might be available to leatherback turtles here off the continental shelf of California. They are all excited to be here, greatly enjoy their professions, and hope to assist in leatherback turtle protection.

Justin prepares to collect head and organs for research.

The night of September 13, a few members of the research team, with assistance from crewmembers, took advantage of the relatively warm water the Jordan was crossing and tried to fish for squid. Not really expecting much more than a short fight with a 12 inch mollusk, we were in for a surprise. Using a fluorescent lure, and a 50lb test, the line was dropped about 200m into the dark sea. Within 5 minutes, the line began to tug, and tug, AND TUG!!  The oceanographer/fisher used a tremendous amount of strength to reel in the organism on the other end of the line. Victor, crewmember and experienced squid fisher, gaffed the squid as soon as it surfaced in the water. Shock was on every face as we acknowledged we were not expecting a 65cm long, 30-40lb animal!  As soon as the tentacles that it grabbed the lure with were detached from the lure, Justin was ready to go again!  And within 5 minutes another squid was caught, easily the same size as the first.  This brought another three scientists and one crewmember out with additional reels. 

Two Humboldt squid fresh from the Pacific!

Within an hour, eight squid were aboard, plans were made for a calamari feast and measuring began. Karin Forney, after observing the commotion, quickly retrieved an email from a colleague who is conducting research on this species of squid, and who requested that we preserve the head and internal organs for later genetic analysis.  Several Ziplock bags were readied and the cleaning began. In the end there were calamari steaks for everyone and their 10 best friends, tentacles for several pots of soup and research samples collected for additional analysis. This species of squid is of concern since it had been uncommon off the central California coast until after the 1998 El Nino event, which brought warm waters up from the tropical Pacific side. Now it is much more abundant. The Humboldt squid is a voracious predator and there is great interest in understanding its potential impact on other species, especially those of commercial value.

Randy and Mary Anne cleaning Humboldt Squid.

Animals Seen Today 
Blue shark Prionace glauca, Humboldt squid Dosidicus gigas, Arctic tern Sterna paradisaea, and Common redpoll Carduelis flammea.

Words of the Day 
Gaff: hook attached to a long pole used to bring in a catch Characterize: to decide what the parts are that together create something Acoustic: sound wave information El Nino: a cyclic climate event originating in the tropical Pacific that is associated with unusually warm waters that impact the west coast of North and South America.

Joao preparing his secret calamari marinade.

Questions of the Day 

  1. A squid is classified as a mollusk, which is a single shelled marine animal.  Where is the single shell on this animal?
  2. What are some of the reasons the study of leatherback turtles is so complex?

Screen shot 2013-04-20 at 1.46.35 AM