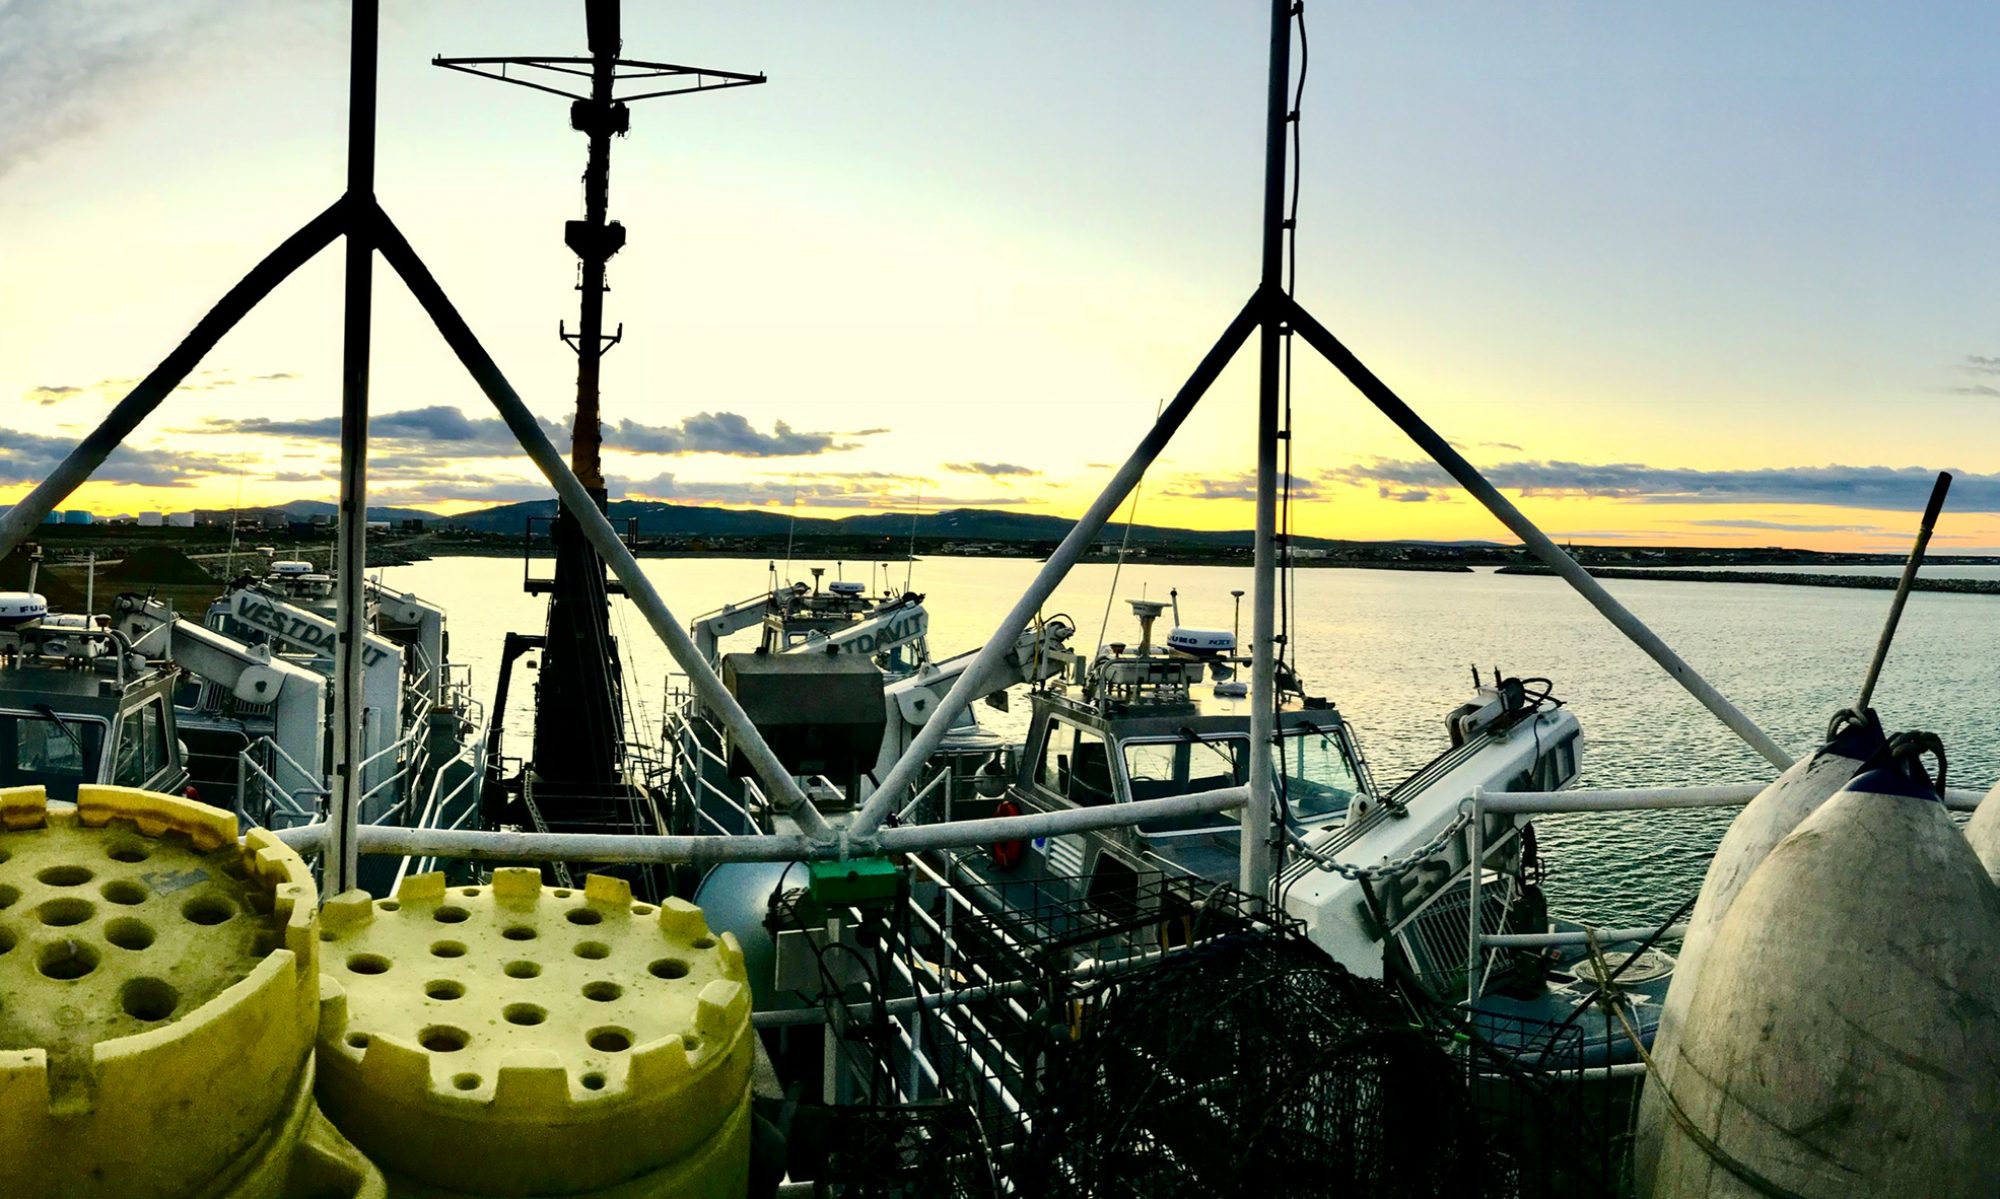
Justin Czarka, August 14, 2009

NOAA Teacher at Sea
Justin Czarka
Onboard NOAA Ship McArthur II (tracker)
August 10 – 19, 2009 

Mission: Hydrographic and Plankton Survey
Geographical area of cruise: North Pacific Ocean from San Francisco, CA to Seattle, WA
Date: August 14, 2009

Weather Data from the Bridge 

Sunrise: 6:29 a.m.
Sunset: 2033 (8:33 p.m.)
Weather: patchy mist
Sky: partly to mostly cloudy
Wind direction and speed: Northwest 10-15 knots (kt)
Visibility: unrestricted, reduced to 1-3 nautical miles (nm) in mist
Waves: northwest 3-6 feet
Air Temperature: 17.50°C
Water Temperature: 17.63°C

Science and Technology Log 

Today I rotated to a new job assignment. I have been working with the CTD water samples, storing nutrient samples, and preparing chlorophyll samples.  Now I work with Jay Peterson, researcher from Oregon State University, Hatfield Marine Science Center, Newport, Oregon, deploying, retrieving, and preparing live samples from the vertical net and bongo net on a cable.

The vertical net gets rinsed off after the tow.

The nets collect all types of plankton, both plants and animals.  As with all the sample collections occurring aboard the McArthur II, communication is the backbone of the operations, or “ops.” For the vertical net and bongo net, two people manually place the nets over the ship’s starboard side, while a winch operator deploys and retrieves the nets from the ocean, and the bridge navigates the ship. For vertical nets, the goal is to take the net to 100 meters (m) depth and then hauled up vertically. The purpose is to catch organisms from the entire water column up to the surface.  It is the same depth for the bongo net, but the goal is to have the cable at a 45° angle with the ship moving at a steady 2 knots (kt). Both nets have flowmeters to determine the volume of water that goes through the net. Once back on the deck, the nets are rinsed from the top to the bottom so that everything in the net can be analyzed. The samples are placed in jars or buckets to observe under microscope.  We find euphausiids (krill), copepods, Tomopteris, Chaetognatha (arrow worms), fish larvae, Phronima, and even bird feathers!  You have to check out these animals online, as they all have fascinating features. More importantly, while small in size, they are an essential part of the food web. Without them, many species would struggle to find food.

Personal Log 

Today we a day of plenty in terms of sighting marine mammals and other species as well!  The day started out near shore at Newport, Oregon and the Yaquina Head Lighthouse.  The McArthur II travels roughly in a zigzag approach near shore to off shore and back for this mission.  Getting ready for the day watch, I saw some whales off the port (left side facing forward on a ship). That was just the beginning. As we headed due west on the Newport transect line (44 39.1′ N latitude) we spotted brownish and reddish jelly fish, albatross following along the starboard side during bongo tows, sea lions skirting by the stern, and a shark fiddling with driftwood presumably looking for small fish that were utilizing the log as a habitat. Later in the day, we navigated near breaching humpback whales on the starboard side. Towards evening, a group of 5-6 pacific white-sided dolphins followed along for 10 minutes or so.

A Doliolid, which feeds on plankton, was caught in the vertical net before being released into the ocean.  Note the pinkish lines, the muscle bands, and blimp-like shape.
A Doliolid, which feeds on plankton, was caught in the vertical net before being released into the ocean. Note the pinkish lines, the muscle bands, and blimp-like shape.

Being out here witnessing the wildlife in their environment is fascinating.  You start to internalize the ocean planet as more than a vast emptiness.  There exists a tremendous amount of species diversity living above and below the surface. Yet sadly, since few of us spend regular time away from our land habitats, we tend to neglect the essential nature of the ocean.  The ocean truly sustains us, whether providing the majority of our freshwater (through evaporation and, consequently, rain), supporting our nutritional diets, and driving the weather we experience daily.  Teacher at Sea really reinforces this revelation since I get to spend an extended amount of time away from my terrestrial existence learning to appreciate the ocean’s influence on our lives.  May we gain enough understanding to ensure the sustainability of the ocean ecosystem.

Animals Seen 

Humpback whales
Shark
Jellyfish
Doliolid
Albatross
Albacore tuna
Sea lion
Pacific white-sided dolphin

Rita Larson, August 13, 2009

NOAA Teacher at Sea
Rita Larson
Onboard NOAA Ship Rainier
August 10 – 27, 2009 

Mission: Hydrographic Survey
Geographical Area of the Cruise: Kasitsna Bay, AK
Date: August 13, 2009

RA-4 launch, one of the Rainier’s small boats

Weather Data from the Bridge 
Latitude: 59° 28.515′N Longitude: 151° 33.549′W
Sea Water Temperature: 9.4°C
Air Temperature: Dry Bulb : 14.4°C (46°F); Wet Bulb: 12.2°C (54°F) (Dew Point)
Visibility: 10 miles

Science and Technology Log 

The Rainer deploys launches or small boats such as the RA-4 that have different tasks assigned to them listed on the POD or the Plan of the Day. Today, our mission was to survey a section of the sea floor in Kachemak Bay. Once the survey has been completed, the raw data is processed and then is sent to other NOAA’s National Ocean Service divisions to create nautical charts of the sea floor for either updating for accuracy or created for the first time.

Each launch is equipped with multi-beam sonar devices. The crew is currently collecting bathymetric as well as backscatter data simultaneously. Backscatter data can be analyzed to categorize the bottom type of the sea floor indicating changing sediment types such as rock or mud. This information is of particular use to fisheries biologists, ecologists, and others who are interested in habitat mapping. The lead hydrographers are given a polygon region, which defines the area in which they are going to survey.  This is what ours looked like for today:

This was our chart at the beginning of the day.
This is our chart after a hard days work!

Can you see what we surveyed? Yes, you are correct if you said the purple and green-blue mixture. The first step that was taken was putting a cast in the water, which is called a CTD and stands for Conductivity, Temperature, and Depth. The CTD is used to see the changes in sound velocity all the way to the bottom.  This process is repeated at least every four hours for readings. This sound velocity data is used to correct the multi beam sonar data. The computer is able to translate the multi-beam sonar data in a 3-D image of the sea floor.

The CTD, which measures conductivity, temperature, and depth.

Personal Log 

I am getting used to my routine living on a ship. The main idea is respecting others and their space. Listening to others and following the rules. Asking lots of questions will help you transition easily. Following others advice. Enjoying the company you are with. Having fun on every adventure that is given to you. I am learning so much, and each day I am feeling more and more comfortable here in my new home on the Rainier. 

New Term/Phrase/Word 

Wow, I am a student here on the Rainier! I am learning new words and terms everyday. Just today I found out a FISH is not an animal, but an instrument that is towed behind a boat on a cable and “swims” through the water. One example is a Moving Vessel Profiler or a MVP. This apparatus collects the same information as the CTD; however, it collects the information in real time. It is smart to have the CTD and the MVP on the launch to compare the same data to make sure it is correct.

This is a screen that is read by the hydrographers that shows the 3-D sonar images of the bottom of the sea floor.  Today, some of our readings were more than 500ft deep. WOW!
This is a screen that is read by the hydrographers that shows the 3-D sonar images of the bottom of the sea floor. Today, some of our readings were more than 500ft deep. WOW!

When we survey a section of the sea floor that was previously surveyed that is called junctioning, or overlapping. Holidays are not the days on a calendar, but stands for “holes in the data”. That means after you survey a section of the sea floor, if there is a missed section on the computer screen you must go back and re-survey that area.

Rita Larson, August 12, 2009

NOAA Teacher at Sea
Rita Larson
Onboard NOAA Ship Rainier
August 10 – 27, 2009 

Mission: Hydrographic Survey
Geographical Area of the Cruise: Kasitsna Bay, AK
Date: August 12, 2009

Weather Data from the Bridge 
Latitude: 59° 28.515′N Longitude: 151° 33.54′W
Sea Water Temperature: 9.4°C
Air Temperature: Dry Bulb: 14.4°C (58°F); Wet Bulb: 12.2°C (55°F)
Visibility: 10 miles
Wind: 06

The skiff RA-8 being launched from NOAA Ship Rainier.

Science and Technology Log 

Last night (Aug 11, 2009) the P.O.D (Plan of the Day) was posted and I found out that I was assigned to work with the Survey Team. We would go out on the skiff identified as RA-8.  We had a special guest that came with us today, Mr. Randall, from the NOAA Headquarters located in Silver Spring, Maryland was in Homer Alaska, so we drove RA-8 to Homer, Alaska to pick him up. Then we proceeded to Bear Cove to complete our main mission, which was to observe the tides and complete the leveling of the remote tide gauge. NOAA uses tide gauges to verify long-term assessment of sea level changes and establishes the vertical datum, or frame of reference, for their nautical charts. Mr. Randall was retrieving a GPS (Global Positioning System) unit that was planted in Bear Cove the previous day to collect data.

Our crew consisted of Matt Abraham, our coxswain, was responsible for driving the open skiff (RA-8). Our hydrographer in charge was ENS Schultz; she surveyed Bear Cove and retrieved the data from the tide gauge. Manuel Cruz and Tony Lukach were responsible for holding the leveling rods to help complete the survey. My responsibility was to write the data given to me and record it on the leveling sheets and find the difference between each measurement. Mr. Randall also worked with us throughout the day. While surveying we used a three-wired level that sits on a tripod, level rods, measuring tape, turtles, pencil, and a calculator.

Personal Log 

Looking through a three wire level.

I was so excited about this mission since it was my first one. I was very cold in the morning since we were a little bit wet from the spray of the ocean, even though I was dressed very warmly. By the afternoon I was only wearing a t-shirt and jeans. The scientists were telling me the last time they were at Bear Cove they actually saw a bear. So, I was looking around constantly to keep an eye out for them. At one point of the day I went with ENS Schultz to collect the initial tide measurements from the tide gauge and check the flow of the nitrogen gas to make sure it was operating smoothly. Little did I know that I had to climb a wooded hill to help collect this data. One has to be in great physical shape to perform these types of tasks. It was unbelievable to see such sophisticated equipment in such a remote area.

After observing these remarkable scientists doing their jobs in the middle of a mosquito-infested area, I applaud everything they do. I felt comfortable and I felt safe in their care. They are all so knowledgeable in their fields. One can really sense the teamwork that is needed for all the missions NOAA  expects from them. I am proud and honored to be a part of the project called Hydropalooza, which provides a deeper understanding of Alaska’s Kachemak Bay.

New Term/Phrase/Word:  Turtles in surveying are not animals. They are used as half way marks from the benchmark item to the surveyor. The ones we used were round and heavy with a silver handle on them. They are heavy for a reason, so they do not move once they are placed on the ground. Surveying is very important to this mission since the measurements must be within 2.5mm.

Animals Seen Today 
Puffins and Sea Otters

Collecting data from the tide gauge in Bear Cove

larson_log1e larson_log1d

As we were bringing Mr. Randall back to Homer we saw this glacier in the distance.

John Schneider, July 11, 2009

NOAA Teacher at Sea
John Schneider
Onboard NOAA Ship Fairweather 
July 7 – August 8, 2009 

Mission: Hydrographic Survey
Geographical Area: Kodiak, AK to Dutch Harbor, AK
Date: July 11, 2009

Position 
Sheet L – Shumagin Islands

Weather Data from the Bridge 
Weather System: Overcast
Barometer: 1021.4
Wind: mild and veering*
Temperature: 12.1º C

Science and Technology Log 

One of the Fairweather's launches
One of the Fairweather’s launches

Today I got to go out on launch 1010.  The two primary launches on Fairweather are 29-foot diesel-powered (Caterpillar) single-screw aluminum boats.  I was real surprised to find that 1010 is 35 years old!  It’s in great shape.  Survey equipment on board includes the multi-beam echo sounder, computers, DGPS (Digital GPS gives positional accuracy to about 6 inches!) radar, radios and Iridium satellite telephones.  For “creature comforts” there’s a microwave and mini-fridge as well as a very efficient heater/defrost system.  Oh, by the way, there are no heads on the launches. (FYI – a “head” is marine-speak for a bathroom!)

Here I am on the launch monitoring all the data that’s being collected
Here I am on the launch monitoring all the data

Knowing this in advance, I didn’t have coffee or tea or a big breakfast. Turns out that when “nature calls” the rest of the crew goes in the cabin, closes the door, and you go over the side! Seems gross at first and then you realize that the 30 and 40 ton whales go in the ocean too (besides, it’s biodegradable!) The launches are carried on the boat deck (E-deck) in custom Welin-Lambie davits made for each launch. Welin-Lambie is a company over 100 years old and made the davits for a few ships you may have heard of – the British Royal Yacht Britannia, the Queen Elizabeth 2 cruise ship and oh, yeah, the RMS Titanic!  The cradles are self-leveling so when the Fairweather is in heavy seas they remain upright and stable.  The picture on the left shows 1010 in its cradle. When it’s time to launch the boat, the securing devices are released, the boat is swung out over the side and two >3 ton winches lower the launch to the rail of D-deck.  There it is boarded by the crew and loaded with the needed gear for the day.  It is then lowered into the water and sent on its way.

Once we got to the area of our polygon (I’ll explain polygons later in the week) we began acquiring data by “mowing the lawn” – the process of sailing back and forth across a defined area collecting soundings1 (bottom depths.)  In every polygon we conduct a CTD cast (CTD = Conductivity Temperature Density.)  These three parameters determine the speed of sound in the water and are used to accurately calibrate the soundings. Once we had been working for a while with me observing – and asking what must have seemed like unending questions – PIC2 Adam Argento and AST3 Andrew Clos guided me to monitoring the data being acquired. As you can see on the left there are 4 monitors all running software simultaneously.  The picture on the right shows the keyboard and mice. The mouse in my right hand controls the windows on the three screens to the right which are data displays of received info. The left mouse controls which data are being acquired.

After a long day on the launch, it was great to see the Fairweather on this rainy day.

After lunch the coxswain4 (“coxin”) – AB Chrissie Mallory – turned the helm over to me to steer.  My first leg was headed North.  The positional displays on the Fairweather and its launches all have North being at the top of the displays.  (This is called – logically enough – “North Up”.)  I rocked! If I had to move off to the right a little, I turned right.  Need to move left, turn left. There’s a little delay between when you turn and the position as displayed on the screen.  Well, we got to the top of the section and turned around to head South.  I needed to adjust a bit to the right, so I turned right . . . BUT . . . the boat is now oriented 180º from the prior run.  So in turning right, I actually made the boat go left on the screen!  Oh NOOO!!! So I overcompensated the other way.  Then had to un-overcompensate . . . and so on.  I’m sure when they downloaded the data back on the Fairweather they were wondering what the h*** was going on. Eventually I got the hang of it and didn’t do too badly after a while, but I have a much greater appreciation of what appeared to be really simple at the outset.

After a successful 8+ hours out (by the way, our lunches contained enough food for 6 people!) we headed back to the Fairweather about 15 miles away.  To see her after a day out kind of felt like seeing home after a long day out. To the unaware, the ship looks like a mish-mash of all kinds of gear all over the place, but it’s remarkably organized.  The reason for the appearance is that the ship is capable of so many tasks that the equipment is stowed in every available space.  Fairweather is capable of deploying 7 small boats and operating independently of all of them in coordinated tasking!  I’d love the opportunity to take a class of students for an all-day field trip aboard and could do so without ever leaving the dock – there’s so much on board!

A launch returning to the Fairwweather

As you can see in the photo of the Fairweather above, there are two large white inflated “fenders” hanging over the starboard side.  This is where we’ll be tying alongside. (I took the next 3 shots from the Fairweather as 1010 approached on a different day.) As the launch approaches, the person on the bow will throw a line to the forward line handler.  Notice there’s not a whole lot of room up there as well as the extended arm ready to catch the line.  That bow line has a mark on it which lets the line handler on Fairweather know where to temporarily tie off the line.  Then the stern line is then thrown to another line handler. Once the launch is positioned properly (no easy task in rolling seas) the hoists are lowered to the launch where they are clamped onto lifting eyes.  Each of the clamps on the boat falls5 weighs close to 40 pounds – that’s why in deck ops everyone wears hardhats – and is controlled by both the winch operator and two more line handlers using “frapping lines6.” (in the picture to the left, as the launch approaches, you can see the boat falls, clamps and frapping lines.)  Once the clamps are secured, the launch is lifted to the deck rail and the crew gets off, and the launch is lifted back to its cradle.

Piece of cake!  Realize, however, that this simply and cleanly executed maneuver, requires: On the Fairweather: 4 line handlers The Chief Bosun 1 or 2 surveyors The bridge crew to maintain position (at least 2 people) 2 or 3 deck personnel to unload gear from the launch A Chief Scientist to task the launch The chefs to feed the launch crew On the launch: Person in charge Coxswain 1 winch operator From 14 to 16 people, all working together.  On January 1, 2008, the Fairweather was authorized to paint a black letter “S” on both sides of the ship indicating that she had gone 433 consecutive days without any injuries.  Considering the environment in which Fairweather works and the tasking which requires constant deployment and retrieval of heavy equipment, the “Safety S” is a reflection of her crew and officers.

Personal Log 

What a great day!

Vocabulary 

  1. Soundings – depths measured
  2. PIC – Person In Charge
  3. AST – Assistant Survey Technician
  4. Coxswain – (<O.Fr. coque “canoe” + swain “boy”) Individual who steers a small boat or launch
  5. Boat falls – the lines used to raise and lower boats from a davit
  6. Frapping lines – Lines used to control the boat falls

By the Way 

It’s time to do some laundry!!!  The laundry room is on D-Deck just forward of the fantail.

See you all tomorrow! 

It’s laundry day!
It’s laundry day!

John Schneider, July 8, 2009

NOAA Teacher at Sea
John Schneider
Onboard NOAA Ship Fairweather 
July 7 – August 8, 2009 

Mission: Hydrographic Survey
Geographical Area: Kodiak, AK to Dutch Harbor, AK
Date: July 8, 2009

Position 
Small boat/launch operations vicinity; Herendeen Island (Shumagin Islands Group)

Weather Data from the Bridge 
Wind: light & variable
Temperature: 12.7ºC
Sea State: 1 foot

National Ocean Service Benchmark

Science and Technology Log 

Today I’ll be heading out on the Ambar (an aluminum hulled inflatable) to check on a tide gauge off Herendeen Island.  It might get chilly being off the Fairweather, but the weather has been fantastic since we left. Waves <1 foot, winds below 5 or 6 knots.  Weather actually got better as we went to the tide station.  (I’ll try to get a good shot of each of the launches.) The tide station is a remarkably simple in concept, yet a terribly complex operation to execute. A month ago, Fairweather personnel installed a tide station on Herendeen Island. This involved sending a launch to the island where personnel did the following setup work:

The tide gauge interface being downloaded to a weather/shockproof laptop computer
  1.  Drill a 1/2 inch hole 3” deep into a solid piece of granite and set a bronze bench mark into it.
  2. Drill 3 more holes into a huge granite boulder at the water’s edge. Construct, on that boulder, a vertical tide gauge with markings every centimeter, ensuring that the bottom of the gauge is both lower and higher than the tide should go.
  3. Precisely and accurately determine the height of the benchmark in relationship to the heights on the tide gauge.
  4. Send a diver down below the lowest tide levels and install a nitrogen-fed orifice connected to a hose and secure it to the sea floor.
  5. Connect the hose to a pressurized tank of nitrogen on shore.
  6. Install a solar power panel near the station with a southern exposure.
  7. Install the data acquisition interface. This piece of equipment forces a single nitrogen bubble out of the orifice every six minutes (one-tenth of an hour) and measures the pressure it takes to release the bubble which is then used to calculate the depth of the water (as a function of pressure.)

Collected data are automatically sent by satellite to NOAA. A month later, the survey team re-visits the site and performs a series of 10 visual observations coordinated with the automated sequences of the nitrogen bubble data recorder.  These visual observations are then compared to the automated data acquired.  If their statistical differences are within accepted parameters, the data are considered valid and will be used further.  If not, the data are discarded and collection is re-started. 

It's a little weird to see the Ambar leave after dropping us off on an island that has seen very few footprints!
It’s a little weird to see the Ambar leave after dropping us off on an island that has seen very few footprints!

Not only is the process painstaking, but the technology and Research & Development needed to design the equipment must have been extremely difficult. However, given the amount of our nation’s dependence on marine commerce and movement of goods, it is time and effort more than well spent. Once we returned to the ship, I was able to lend a hand on the fantail (that’s the aft area of the deck where a LOT of work gets done) where the survey team was collecting samples of the ocean bottom.  Bottom sapling is done at specific locations proscribed by NOAA guidelines for coastal waters.  It is important for mariners to know the type of bottom in an area in case they need to anchor or engage in commercial fishing. 

Bottom samples are collected using a Shipek Grab.  This 130-pound tool captures a 3-liter sample of the bottom. The scoop is spring loaded on the surface and when it strikes the bottom a very heavy weight triggers the scoop to close, picking up about 1/25 of a square meter of bottom. Bottom characteristics are then recorded with the position and will eventually be placed on nautical charts.  Sometimes even small animals get caught in the grab. Today we saw brittle stars, tube worms and a couple of little crabs.  However, the biggest surprise to me was finding numerous small pieces of CORAL in the samples!  I certainly did not expect to see coral in ALASKAN waters!

Personal Log 

A piece of coral on a pebble.  (It's on a 3x5 file card for scale.)
A piece of coral on a pebble. (It’s on a 3×5 file card for scale.)

Lest you think that it’s all work and no play, we anchored tonight after a 12 hour+ work day.  With sunset at around 2330 hrs (11:30) there was still time for some fishing (nothing was kept but we caught a couple small halibut) and movies in the conference room.  There are movies aboard almost every night as well as closed circuit images from 4 areas of the ship.  I’ve also started taking pictures of the menu board every night but won’t post all of them because of space limits on my file size – besides, you all simply wouldn’t believe how well we are fed on the Fairweather. Just as an example: how does blackened salmon wraps sound for lunch??? Oh yeah!!! (You have permission to be jealous!)

Coming back, the Fairweather, after being out of sight from the Ambar, is a welcome sight!

Animals (or other cool stuff!) Observed Today 

Saw a whale in the distance, quite far off, just before lunch. Two seals a couple hundred meters aft of the port quarter. While at the tide station we saw two whales’ spouts near the shoreline, one seal poked his big ol’ head up from the kelp bed and checked us out a couple of times, saw a bunch of loons, cormorants and puffins, and while at the tide station, Dave Francksen (a very helpful member of the survey team) caught sight of an octopus. 

This octopus was about 2 feet across from tentacle-tip to tentacle-tip and changed color when it got over the spotted light-colored rocks.

Questions for Your Investigation 

What phylum and class are octopi?  Are Brittle Stars?

What “day shape” does the Fairweather display when anchored?  When conducting survey operations?

What do you call the kitchen on board a vessel?