
NOAA Teacher at Sea
Scott Donnelly
Onboard NOAA Ship McArthur II
April 20-27, 2008
Mission: Assembly of Science Team and Movement of Science Gear/Equipment
Geographical Area: Coos Bay to Astoria, Oregon
Date: April 19, 2008

Science and Technology Log
The long, winding drive along US Highway 101 from Oregon Institute of Marine Biology in Charleston to Astoria was well worth it. For the most part every turn opened to a panoramic view of the Pacific Ocean to the west. To the east, lush, verdant open meadows, some inundated with small ponds and bordered by thick coniferous forests, pleased our eyes. We stopped in Newport, OR to pick up a science team member and had lunch at a local restaurant with a microbrewery. I feasted on Kobe Chili.

After arriving at the Astoria dock (45O12’N, 124O50’W) late afternoon and loading all the gear, equipment, and supplies aboard the McARTHUR II, we spent the evening moving personal gear into our assigned shipboard cabins, setting up and troubleshooting the computer and data collection systems, organizing the ship’s wet lab, installing dissolved oxygen (DO) and chlorophyll fluorometer sensors onto the shipboard Conductivity-Temperature-Depth (CTD) platform, and calibrating the instruments in preparation for the cruise. The scientific instrumentation that will be used on the cruise is impressive and worth mentioning since in science data are only as good and believable as the tools used to collect it. The cruise’s instrument workhorse will be the CTD as it will be used at every sample site. The following physical-chemical water quality parameters will be measured continuously as the CTD descends and then ascends through the water column: conductivity, temperature, depth, dissolved oxygen (DO), and chlorophyll a fluorescence. Attached to the CTD are twelve cylindrical Niskin bottles, each with a volume capacity of 2.5 liters (0.66gal). Water collected in the Niskin bottles at various depths will be collected and taken to the ship’s wet lab where the following water quality parameters will be measured using a multi-sensor sonde or probe: salinity, pH, and turbidity. The photo below shows the CTD with Niskin bottles.
Let’s begin by talking about a CTD, which measures seawater’s conductivity (more or less the amount of dissolved ions in a given mass or volume of seawater), its temperature, and depth of the surrounding water column at the time a measurement is made. The latter two parameters are self-explanatory so let’s focus on conductivity. Seawater conducts electrical current because seawater contains dissolved ions, i.e. charged particles, either positive or negative. The major ions in seawater contributing to its conductivity are predominately sodium (Na+) and chloride (Cl–) but other ions in varying amounts, depending on location and depth, are present as well. Examples include magnesium (Mg+2), calcium (Ca+2), carbonate (CO3-2), bicarbonate (HCO3–), and sulfate (SO4-2). Other important elements found in trace or very small amounts in seawater are lithium (Li+), iodine (I–), zinc (Zn+2), iron (Fe+2 and Fe+3), and aluminum (Al+3). This list is not exhaustive by any means.
Conductivity is related to salinity. In general, the greater seawater’s conductivity, the greater its salinity. Salinity of seawater though is not constant; it depends on a number of factors, two of the more important being depth and temperature. Atmospheric gases, namely molecular nitrogen (N2), oxygen (O2), and carbon dioxide (CO2), readily dissolve in seawater, particularly so at the ocean’s surface where wave action facilitates this process. A dissolved oxygen (DO) probe (or sensor, typically the two words mean the same thing) measures the mass (or weight) of O2 dissolved in a given mass or volume of water. The units associated with a measured value then would be either mg O2(g)/kg seawater or mg O2(g)/L seawater. The symbol mg means milligrams, kg means kilograms (1kg = 1,000g = 2.2 pounds), and L means liter. Why is the denominator in the ratio either kg or L? The unit kg is a unit for mass, which does not depend on temperature. The mass (or weight) of a substance does not change simply because it gets warmer or cooler because mass measures the quantity of matter of the substance. The mass of any substance then is independent of temperature. If a book weighs one pound, it weighs one pound regardless if it’s placed in the sun or in the freezer. The unit L (liter) is a unit for volume, the value of which does depend on temperature. An object of some mass occupies a greater volume when warm than when cool.
Also attached to the CTD platform is a chlorophyll a fluorescence sensor, which measures the mass of chlorophyll (typically in micrograms, mcg or μg) per volume (typically one liter, L) seawater (overall units mcg/L). Small biological organisms called phytoplankton contain chlorophyll and hence carry out photosynthesis. Like the photosynthesis carried out by terrestrial vegetation, phytoplankton utilize the red and blue light-absorbing molecule called chlorophyll and the carbon dioxide (CO2) dissolved in seawater to produce biomass and molecular oxygen gas (O2). The famous equation for photosynthesis is:
CO2 + red and/blue light + H2O Ö biomass + O2 Photosynthesis though doesn’t work unless sufficient red and/or blue light from the sun is available at the depths phytoplankton are found. The zone in the ocean near the surface where marine photosynthesis takes place is called the photic zone.
The amount of chlorophyll measured by the sensor is in direct proportion to the amount of photosynthesizing phytoplankton found in seawater. Chlorophyll then can be counted so to speak by making the chlorophyll molecule in phytoplankton fluoresce, i.e. emit light. A chlorophyll fluorescence sensor (CFS) shoots a pulse of blue light into the surrounding seawater. A chlorophyll molecule absorbs the blue light which causes it to emit (give off) red light. The CFS sensor measures the red light emitted. Basically, the more red light that’s emitted means the more chlorophyll-containing phytoplankton present in the surrounding seawater at the depth where the measurement occurs.

A CO2 probe interfaced with a computer for continuous real-time data collection measures the amount of gaseous CO2 (in milligrams, mg) dissolved in a given volume of water (typically one liter). Measuring CO2 in seawater is done to gauge the extent of CO2 gas the ocean “cleans” or “scrubs” (not the television show) from the atmosphere. The world’s oceans are huge CO2 sinks because they absorb enormous amounts of gaseous CO2 from the atmosphere annually, a good amount of which is converted into biomass by the photosynthetic activity of phytoplankton.
The “unused” dissolved CO2 forms carbonic acid, H2CO3, which in turn drops the seawater pH, thereby eventually making seawater more acidic. This added acidity (drop in pH) is countered or buffered by the ocean’s natural basic pH, resulting in essentially no net change in pH. But this buffering capacity has limits. If the buffering capacity is exceeded by the addition of too much CO2 in a given time period or the reduction in phytoplankton photosynthesis, then the net result is a drop in pH, making the seawater more acidic. This change in seawater chemistry, in turn, can have deleterious effects on the biology of marine organisms, especially those organisms that live and reproduce in a limited pH range.
One marine organism that is expected to succumb to the predicted net acidification of the oceans over the next decade or so, if not sooner, is the pelagic snail (see photo below). The term pelagic means open so a pelagic snail is found in the open ocean away from the coast.
Why is the pelagic snail threatened? Acidification of the ocean increases the solubility of calcium carbonate (CaCO3), the major constituent of the shells of marine organisms. Solubility is a chemistry term that relates the amount of substance (CaCO3) dissolved in a liquid, in this instance seawater. Essentially a drop in pH (acidification) increases the amount of calcium carbonate in the exoskeleton or shells of marine organisms dissolved, thereby producing thinner shells. Ultimately the shell becomes too thin and any major wave action will break the shell and the organism dies. To show this process, place an egg in a glass of vinegar overnight. The egg shell’s chemical composition is CaCO3. Vinegar is acidic. Over time the shell becomes progressively thinner. Eventually the egg shell dissolves away completely if the egg remains in the vinegar long enough. The yolk inside the egg then is no longer protected by the shell.
Personal Log

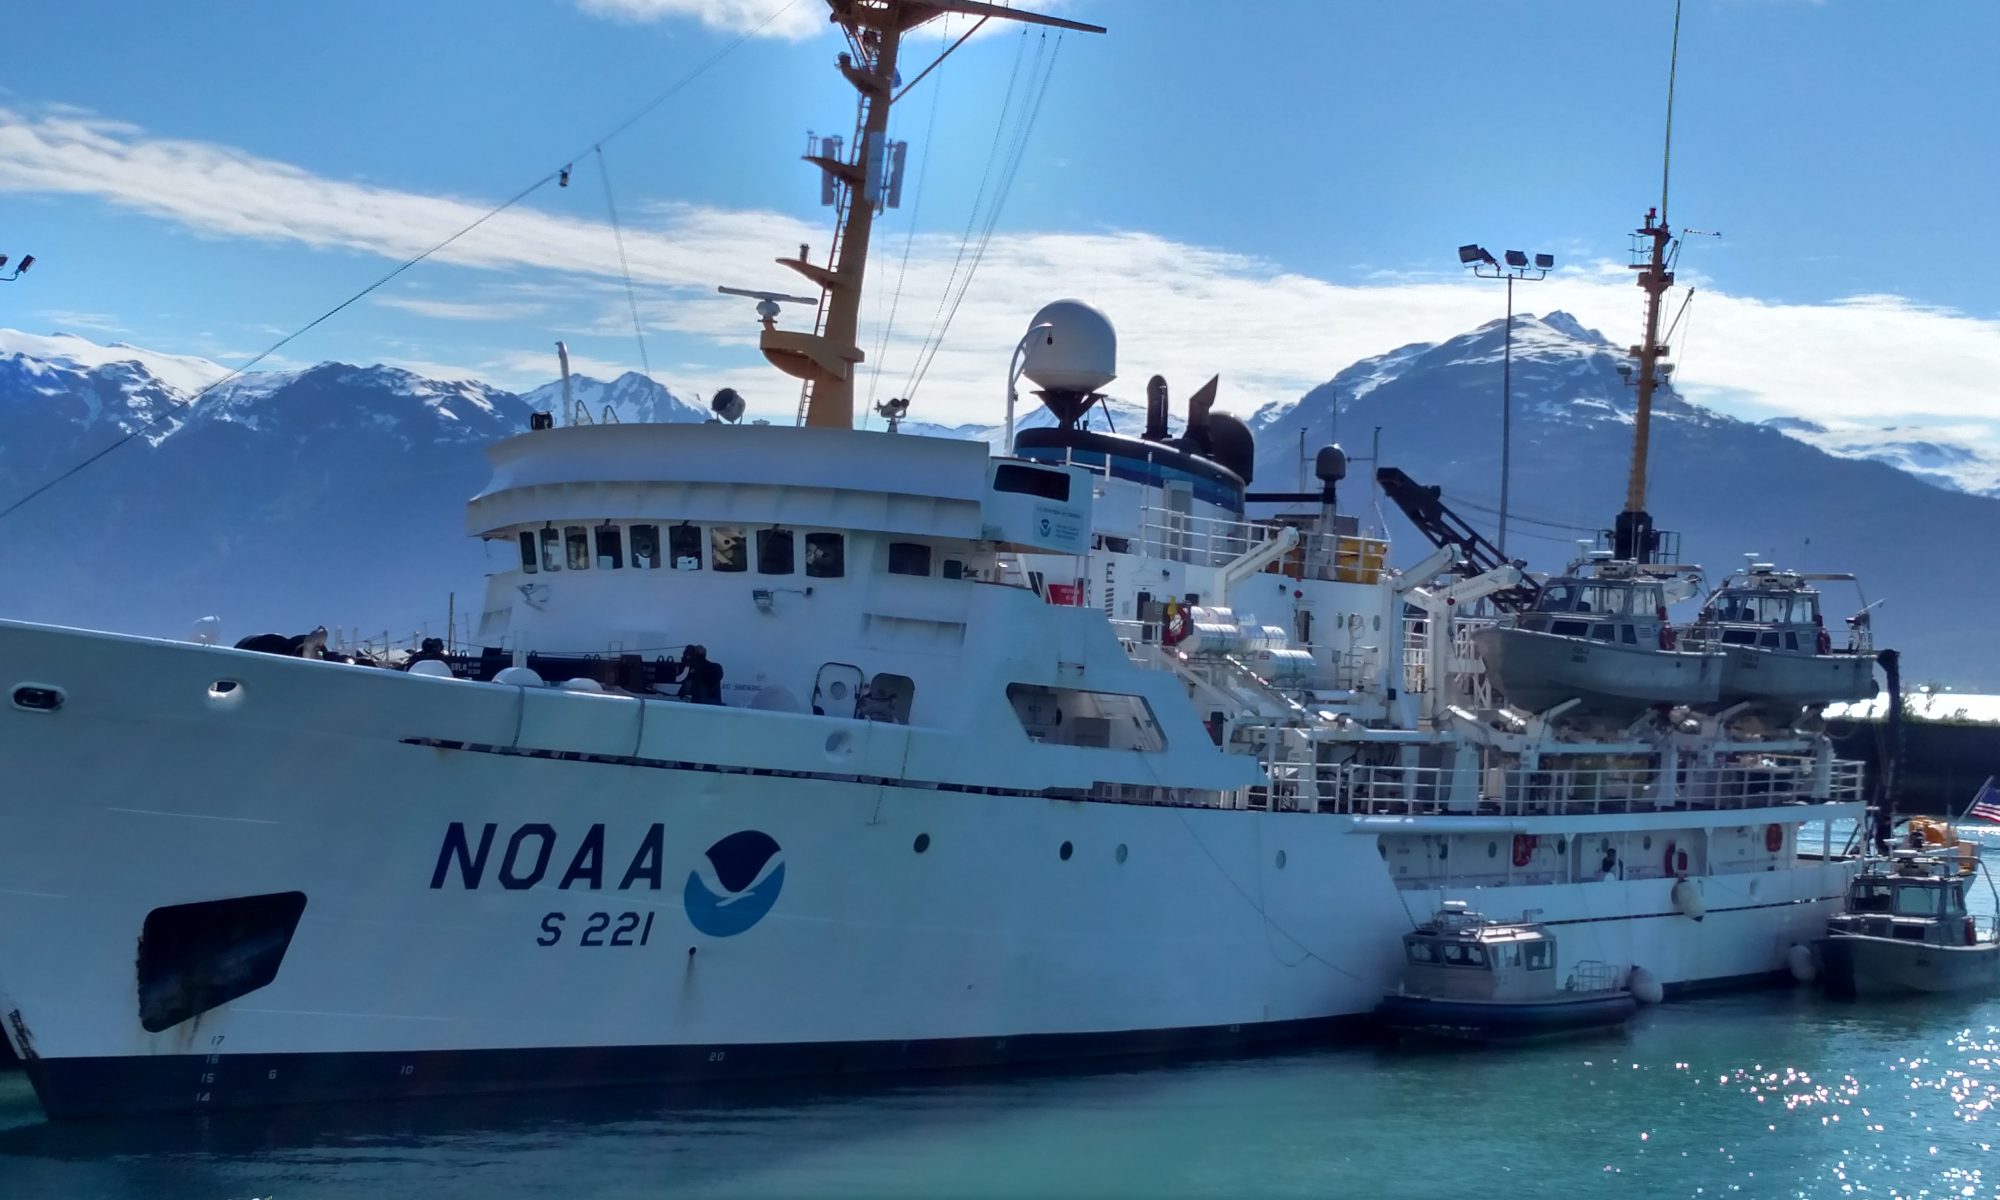
I awoke Saturday morning to the music of song birds and a slight drizzle. I couldn’t identify which type of song bird but it didn’t matter; it was a good start to what would be a great day. Early Saturday morning we packed the scientific gear and sensitive equipment/instruments for the seven-hour vehicular transport along US Highway 101 to Astoria, Oregon (45O12’N, 124O50’W), where the NOAA research ship and crew of the McARTHUR II (see photo left) were docked and awaiting our arrival. The south-north drive along US Highway 101 is long and winding but is replete with breathtaking scenery at every turn. It’s highly recommended when visiting Oregon.
The seven-hour drive in the minivan from Coos Bay to Astoria was a good chance to interact with and talk to some of the other science team members, all of whom I had never met nor talked to previous to today. We all would be shipboard with each other for nine straight days. I had better get to know them and get an idea what makes them tick. I’m sure they thought the same.
In addition, over the past year or so I have developed a keen interest in how ships work and as I came to find out during the seven-hour drive so too did a fellow science team member, Bob Sleeth, who sat adjacent to me during the drive to Astoria. The NOAA crew was most welcoming and eager to talk about their ship. Bob and I were treated to an immensely educational tour of the McARTHUR’s navigational systems capabilities from Ensign Andrew Colegrove, a NOAA junior officer who obviously is passionate about both his job and maritime history; he also has a wealth and breadth of knowledge about the practical, engineering ins-andouts of modern ship technology and operational systems. I lost track of time but I’m sure the personal tour lasted more than two hours.


