Philip Hertzog, July 30, 2005

NOAA Teacher at Sea
Philip Hertzog
Onboard NOAA Ship Rainier
July 25 – August 13, 2005

Mission: Hydrographic Survey
Geographical Area: Aleutian Islands, AK
Date: July 30, 2005

Reson’s sonar output that generates a map of the ocean bottom near Spitz Island.

Weather Data from Bridge

Latitude: 55˚53.4’ N
Longitude: 158˚ 50.4’ W
Visibility:  10 nm
Wind Direction: light
Wind Speed: airs
Sea Wave Height: 0 feet
Sea Water Temperature:  12.2˚ C
Sea Level Pressure: 1012.5 mb
Cloud Cover: 7, cumulus, stratocumulus, altocumulus

Science and Technology Log 

I went boating into new territory today. We took launch RA-4 and headed to the western end of Mitrofania Island to map the bottom around Spitz Island and several rocks.  I got to learn more about the RAINIER crew, saw a new type of sonar, met some sea lions and even drove the launch. Ensign Brianna Welton led our launch with assistance from Lorraine Roubidoux.  Ensign Welton is an expert in sonar technology and I watched other crew members seek out her help when problems crop up. Ms. Roubidoux goes to school at the University of New Hampshire where she’s earning a Masters Degree.  She joined the RAINIER for a month to get experience with sonar systems.  Ms Roubidoux conducts research on sonar “background scatter.” Background scatter occurs when sonar signals bounce around more than once and give false readings of ocean bottom depth.  Ms. Roubidoux’s research will hopefully result in better sonar for future ships.

Driving the launch
Driving the launch

Women play an important role on NOAA ships. They serve as officers like Ensign Welton and scientists like Ms. Robidoux.  Women also play key leadership roles on the RAINIER like our ship’s XO (Executive Officer), Commander Julia Neander, who takes command of our ship when the Captain leaves. I hope my students will learn that many cool opportunities exist for women in the sciences and they should not be discouraged from taking math and science classes.  Above is a photo of Ms. Robidoux running the sonar on our launch.

Coxswain (official name for a sailor who drives small boats), Corey Mussey, carefully maneuvered the launch as we approached Spitz Island. Underwater rocks make this type of mapping more dangerous and Seaman Mussey moved the launch slowly and carefully to avoid ripping off the half million dollar sonar sensor from the hull.  Because we moved into shallow water, Ensign Welton turned on a different type of Sonar Sensor called the Reson SeaBat 8101. The Reson works in water depths of 4 to 150 meters and gives a sharp, clear image of the bottom. The other sonar I saw before, the Elac, operates in deeper waters ranging from 40 to 400 meters, but does not give a clear image of the bottom. Corey told me you can actually see ship wrecks in full detail with the Reson sonar.

As we mapped, I occasionally stood on the bow of the launch and looked out for rocks as we moved close into shore. We passed over underwater “forests” of bull kelp and I saw 25 to 30 feet below the surface where a long, single whip like strand moves toward the surface and attaches to a floating round bulb.  Out of the bulb comes half a dozen flat fronds about 5 to 10 feet in length and four inches wide that make the bull kelp look almost like underwater palm trees.  Suddenly I saw a salmon dart quickly underwater and then 40 to 50 fish appear under the launch and move just as quickly out of view to our port (left) side.

As we moved back and forth in our “mowing the lawn” mapping pattern, we saw two groups of Steller Sea Lions. Four males sat on a small rocky island while two dozen or more females beach themselves on Spitz Island three hundred yards away.  Each time we passed, the Sea Lions sat up and barked at us.  We may be the first humans they have seen in this remote part of the Southwestern Alaskan peninsula.  As you can see, the one male challenged me with its open mouth while another sat calmly with his seagull friend.

At the end of the day, Corey let me drive the launch and run one of the transect lines for the sonar mapping.  As you can see in the photos below, I looked at a computer screen that showed our boat as a red torpedo along a line on the computer screen.  I had to keep the black marker on the red and green bar at the bottom of the screen exactly in between the two colors or we would miss our mapping area.  This proved difficult because just as one gets lined up a wave pushes the launch off course so you constantly correct the boat’s position. I found using the computer screen to drive the launch similar to a video game except you could wreck the boat and get hurt for real if one makes a mistake. I had a great day and returned to the ship to await another adventurous day.

Personal Log 

I had a fantastic day. I got to see some interesting technology and talked to professional people. Being out on the bow of the launch scared me a bit.  If we had hit a rock I failed to spot, the damage to the sonar system could equal a half a million dollars.  The bow also requires a lot of balance and strength.  Each time a wave rocked the launch, I risked falling into the cold Alaskan water and had to really pay attention.

Sonar output
Sonar output

Though the crew of the RAINIER works hard and long hours, they do get a chance to relax and Saturday nights are special. After supper, we loaded up into the open skiff and rode about mile to a wide open, gravelly beach for a party.  A few people started a large bon fire and we had soda drinks and music playing.  The skiff could only carry eight people at a time, but the party grew larger and noisier each time it arrived on the beach.  People talked, told jokes, found whale bones, and caught salmon all evening long.  The party lasted until 11:30 pm and we rode back to the RAINIER just as the Alaskan sky started to turn dark.

After returning to the ship, I joined some of the crew in the Wardroom (ship’s lounge) and watched the video, “Napoleon Dynamite,” about a high school student.  We all laughed and talked about our own high school experiences.  Tomorrow we all will be tired, but ready for another two weeks of work.

Question of the Day 

How large can Stellar Sea Lions get? Where do we find Stellar Sea Lions and what are their life’s history.

A male Steller sea lion

Philip Hertzog, July 29, 2005

NOAA Teacher at Sea
Philip Hertzog
Onboard NOAA Ship Rainier
July 25 – August 13, 2005

Mission: Hydrographic Survey
Geographical Area: Aleutian Islands, AK
Date: July 29, 2005

Tide gauge equipment

Weather Data from Bridge

Latitude: 58˚ 53.36’ N
Longitude: 158˚ 50.4’ W
Visibility:  10 nm
Wind Direction: light
Wind Speed: airs
Sea Wave Height:  0 feet
Sea Water Temperature:  12.2˚ C
Sea Level Pressure: 1013.5 mb
Cloud Cover: 8, cumulus, stratocumulus, altocumulus

Science and Technology Log 

Today I worked on what the hydrographic map makers call “vertical control” and “horizontal control.” When NOAA makes maps showing how deep the water is, they have a problem in that the depth changes when the tides come in and go out. If a rock exists in the water, there may be no problem at high tide, but ships can run into the same rock at low tide.

hertzog_log5To overcome this problem, NOAA measures bottom depths on their charts starting at a constant elevation called mean lower low water.  Low tide occurs twice a day, but one low tide is always lower than the other.  By keeping track of all the lowest, low tides of the day and averaging their elevations over many years, scientists can come up with an elevation for mean lower low water (MLLW).  You want to start measuring from your lowest tide level to ensure that ship captains can trust the chart to protect them from danger even during low tide. All of the ocean bottom charts are based on depth below MLLW.  However, when you collect sonar data, your height above MLLW constantly changes with the tide in a vertical position (up and down). Hence the term “vertical control” because the chart maker needs to know how to correct the sonar data so the maps are based on MLLW, not the current tide height. In remote areas like Alaska, limited tide data exists so the RAINIER crew installed a device called a tide gauge to measure and record the rise and fall of the tide in the mapping area.  The information from the tide gauge will help us to correct the sonar data so we can make the charts based on MLLW.

Working with the equipment

The RAINIER crew installed a tide gauge on Mitrofania Island 1.5 weeks ago before I got on board. Today I rode in an open boat to help the crew check the tide gauge.  Ensign Andrew Halbach led our mission with assistance from Survey Technician Matt Foss and Ensign Laurel Jennings. Mike Laird, the other Teacher at Sea also joined our group. Carl Verplank, Ordinary Seaman, drove the skiff and stayed off shore after dropping us off to ensure the boat won’t get stuck when the tide goes out.  Carl had the best job because he fished for salmon until we needed a pick up. I hope he shares some fish with us tonight!

Upon reaching shore, Matt Foss and I walked over to the tide gauge station to check it out. Matt carried “bear repellant” with him which is pressurized pepper put into a spray can. If a grizzly bear should approach and attack us, the pepper spray might keep the bear from eating us.  On the other hand, maybe bears like to have a little pepper on their steaks. In any event, we need to stay alert in bear country.

GPS work
GPS work

We found the tide gauge in good working order.  Matt told me that Scuba Divers helped to put the gauge in and that it sends tide information via satellite back to Washington, DC for further analysis.  Now that our vertical control (up and down movement) has been taken care of, Matt and I hiked over to join Ensign Halbach and Ensign Jennings who are working on “horizontal control” or side-to-side motion.

Normally, the crew of the RAINIER knows its horizontal position through the use of global positioning satellite (GPS). As discussed in previous log entries, GPS works by using signals from several satellites to locate your horizontal position on the Earth in terms of latitude and longitude.  The chart makers combine sonar data with GPS data to create accurate maps of ocean bottom depth.  Atmospheric conditions can affect the satellite signals so scientists calculate correction factors. Special radio stations transmit these factors which allow the launch crews to correct the GPS data. These corrections are called “horizontal control.”

Unfortunately, the remoteness and steep mountains of the Mitrofania Island area prevent the RAINIER from receiving good radio signals.  We need to set up our own radio transmission and GPS base station to get good control.  This task took up the rest of our day.

Matt and I found the others busily setting up the GPS station and taking measurements to ensure good location information.  Ensign Halbach carefully leveled the GPS antenna and oriented it towards north. After setting up the GPS station, Carl picked us up and drove the open boat to another location about a mile away where we repeated the process and set up a second GPS station. However, constructing the radio transmitter tower proved to be our big challenge. Nobody in our group ever set up a tower before so we worked as a team to figure it out. We returned to the RAINIER and hit the machine shop where we measured out metal, drilled boltholes and scavenged any thing to help us build the tower.

We carefully load the skiff and quickly motored back the mile across the water to the transmitter site located on a sand bar that sticks out into Mitrofania Bay.  Ensign Halbach led us in constructing the tower and it went up faster than planned.  Two people hold the tower straight up and balance it while the other three string guy ropes to metal stakes pounded in the ground. The tower made us proud of our team work, but no one dares to climb it.  Maybe some of you students reading this log entry would like to come to Alaska and try to climb it.  We returned to the RAINIER and could see our tower on the horizon where it will transmit horizontal control data to all the launches conducting sonar work over the next two weeks.

Personal Log 

This was the most physical day yet on the research vessel.  I actively participated in setting up the tower instead of just observing.  I really enjoyed working in a team today and helping to solve problems.  I also had a good physical workout by carrying heavy equipment to the GPS and radio transmitter sites.  The work out really helped because the food on board the RAINIER is delicious and plentiful with three large cooked meals a day.  I need to watch my weight on this trip.

The tower project showed me you need both technical training and practical construction skills when out in a remote area like Alaska.  My students tend to be either hands-on or all academic, but you need a balance of both these skills to be successful upon graduation. Many of the crew on the RAINIER learned their jobs while on the boat and had to solve difficult problems without any outside help. Hopefully my students can use the RAINIER’s crew as an example on the importance of seeking balance in their lives. Speaking of balance, it’s time for me to catch a salmon.  Here I am ready to go. See you tomorrow.

Question of the Day 

What causes the tide to rise and fall and how does it change over the course of an entire month?

Mike Laird, July 28, 2005

NOAA Teacher at Sea
Mike Laird
Onboard NOAA Ship Rainier
July 24 – August 13, 2005

Mission: Hydrographic Survey
Geographical Area: North Pacific
Date: July 28, 2005

Weather Data

Latitude: 55°37.1̍ N
Longitude: 156˚46.6 ̍ W
Visibility: 10 nautical miles (nm)
Wind Direction: 140˚
Wind Speed: 5 kts
Sea Wave Height: 0-1΄
Swell Wave Height: 2΄
Sea Water Temperature: 12.2˚ C
Sea Level Pressure: 1009.8 mb
Cloud Cover: Stratus

Science and Technology Log 

Another beautiful day in the Gulf of Alaska – partially cloudy with lots of sun!  Today I remained aboard the RAINIER and had an opportunity to talk with Ensign Olivia Hauser about the map sheets.  The sheets are prepared to guide the launches on their echo sounding runs. The whole area to be mapped on this leg of the mission is subdivided into zones called sheets.  At the beginning of the workday, each launch is assigned a sheet for the crew to follow for that day. However prior to distribution to the launch crews, the sheets must be developed.

Each sheet (there are six sheets for our current assignment) is the responsibility of a single sheet manager who takes care of the initial preparation of the sheet, sheet revisions, and the beginning phases of data analysis.  In developing the sheet, the manager attempts to achieve 100% coverage of the seafloor.  This means that the manager attempts to determine the optimum distance between the lines the launch will follow during its sounding runs. In areas like the waters around Mitrofania where there is little or no existing data, the first run of a sheet is a best guess plot.  In essence, the launches are conducting reconnaissance runs.

The data collected during these runs, may reveal some error in the initial line plots.  One problem is called a “holiday” which is a gap between the lines (unsounded seafloor).  This happens when the lines are spaced too far apart for the depth of the water (the water is shallower than expected), and the footprint scanned becomes too narrow leaving a gap between it and the footprint of the neighboring line(s).  A second type of problem is excessive noise in the scan results. In reconnaissance work, this is often the result of a greater than expected water depth in a launch not equipped to handle soundings at that depth. When these types of errors are identified, the sheet manager will revise the sheet plotting a new set of lines to be run. If necessary, a different launch (one with appropriate echo sounding equipment) will be assigned to run the new lines.  Once a complete set of good lines is established for a sheet and seafloor data for the entire sheet is collected, initial analysis begins. Computer programs take cast data (conductivity, pressure, and temperature), tide information, GPS readings (corrected for error), data accounting for the pitch and roll of the launch and process the soundings.  The result is a first look at the bottom!  Subtle changes in shading reveal changes in floor depth and other bottom features. The soundings run by the RA5 launch so far have indicated a mostly flat floor with a few rock outcroppings and small ridges.

Personal Log 

The day was fantastic warm and sunny!  One of the crew caught a halibut, which the galley cooked–a special treat for dinner tonight!

Philip Hertzog, July 28, 2005

NOAA Teacher at Sea
Philip Hertzog
Onboard NOAA Ship Rainier
July 25 – August 13, 2005

Mission: Hydrographic Survey
Geographical Area: Aleutian Islands, AK
Date: July 28, 2005

Launch lowering into the water

Weather Data from Bridge

Latitude: 55˚ 53.36’N
Longitude: 158˚ 58.4’ W
Visibility:  10 nm
Wind Direction: light
Wind Speed: airs
Sea Wave Height: 0 feet
Sea Water Temperature:  12.8˚ C
Sea Level Pressure: 1013.2 mb
Cloud Cover: 5, cumulus, altocumulus

Science and Technology Log 

I awoke to a beautiful sunrise and partly cloudy skies.  The waters of Cushman Bay calmly rock the RAINIER gently back and forth.  I could see pink salmon jump near the ship and seabirds feeding in the water. Mike Laird (the other Teacher at Sea) and I stayed on board the RAINIER today to catch up on our log entries and to see what the rest of the crew does.  We had a quiet day of writing, talking to the crew, and taking photographs.

At 8:00 am I watched the deck crew lower the launches for the mapping teams.  Lowering the launches can be dangerous work and the deck crew does it carefully while wearing hard hats. Two winches move each launch out over the water as shown here (left and right) and then survey crew board the vessel and load gear.  After the survey crew loads the launch, they work with the deck crew to disconnect the cables and hooks from the launch. The launch then speeds off to start a busy day of mapping the waters of Mitrofania Bay.

Launch in the water
Launch in the water

Once the launches left, the deck crew worked on other tasks.  I saw crew washing decks and maintaining machinery.  Other crew members used a crane to move one of the smaller boats (called skiffs) into the water: Other crew members went about the ship conducting other tasks such as preparing meals, keeping the engines running, contacting the launches to help solve problems, and conducting bridge watch. In later log entries, I will try to describe the different departments on board the RAINIER.

Personal Log 

I had a very quiet day and spent it catching up on paper work and cleaning up my digital photos. After looking at my photos and talking with XO Julia Neander, we decided that our whales from the other day are not fin, but Sei (pronounced “say”) whales.  We saw white spots on the whales back and a prominent ridge on the whale’s forehead which are give away signs for Sei. I spent the evening fishing for salmon off the fan deck (located at the rear of the ship).  Several other crew members also fished of the stern, but only Raul, one of our cooks, caught salmon. He pulled in four cohos weighing around 7-8 pounds each. Will he share and surprise us for supper tomorrow night? I can’t wait to find out.

Securing the lines
Securing the lines

Question of the Day 

The RAINIER is like a small community made up of 50 people.  What kinds of jobs does this community need in order to sustain it for 3 weeks at sea without any outside help?

The launch in action

Philip Hertzog, July 27, 2005

NOAA Teacher at Sea
Philip Hertzog
Onboard NOAA Ship Rainier
July 25 – August 13, 2005

Mission: Hydrographic Survey
Geographical Area: Aleutian Islands, AK
Date: July 27, 2005

Securing the launch
Securing the launch

Weather Data from Bridge

Latitude: 55˚ 53.3’ N
Longitude: 158˚ 58.4’ W
Visibility:  10 nm
Wind Direction: light
Wind Speed: airs
Sea Wave Height: 0 feet
Sea Water Temperature:  12.2˚ C
Sea Level Pressure: 1012 mb
Cloud Cover: 2, cumulus

Science and Technology Log 

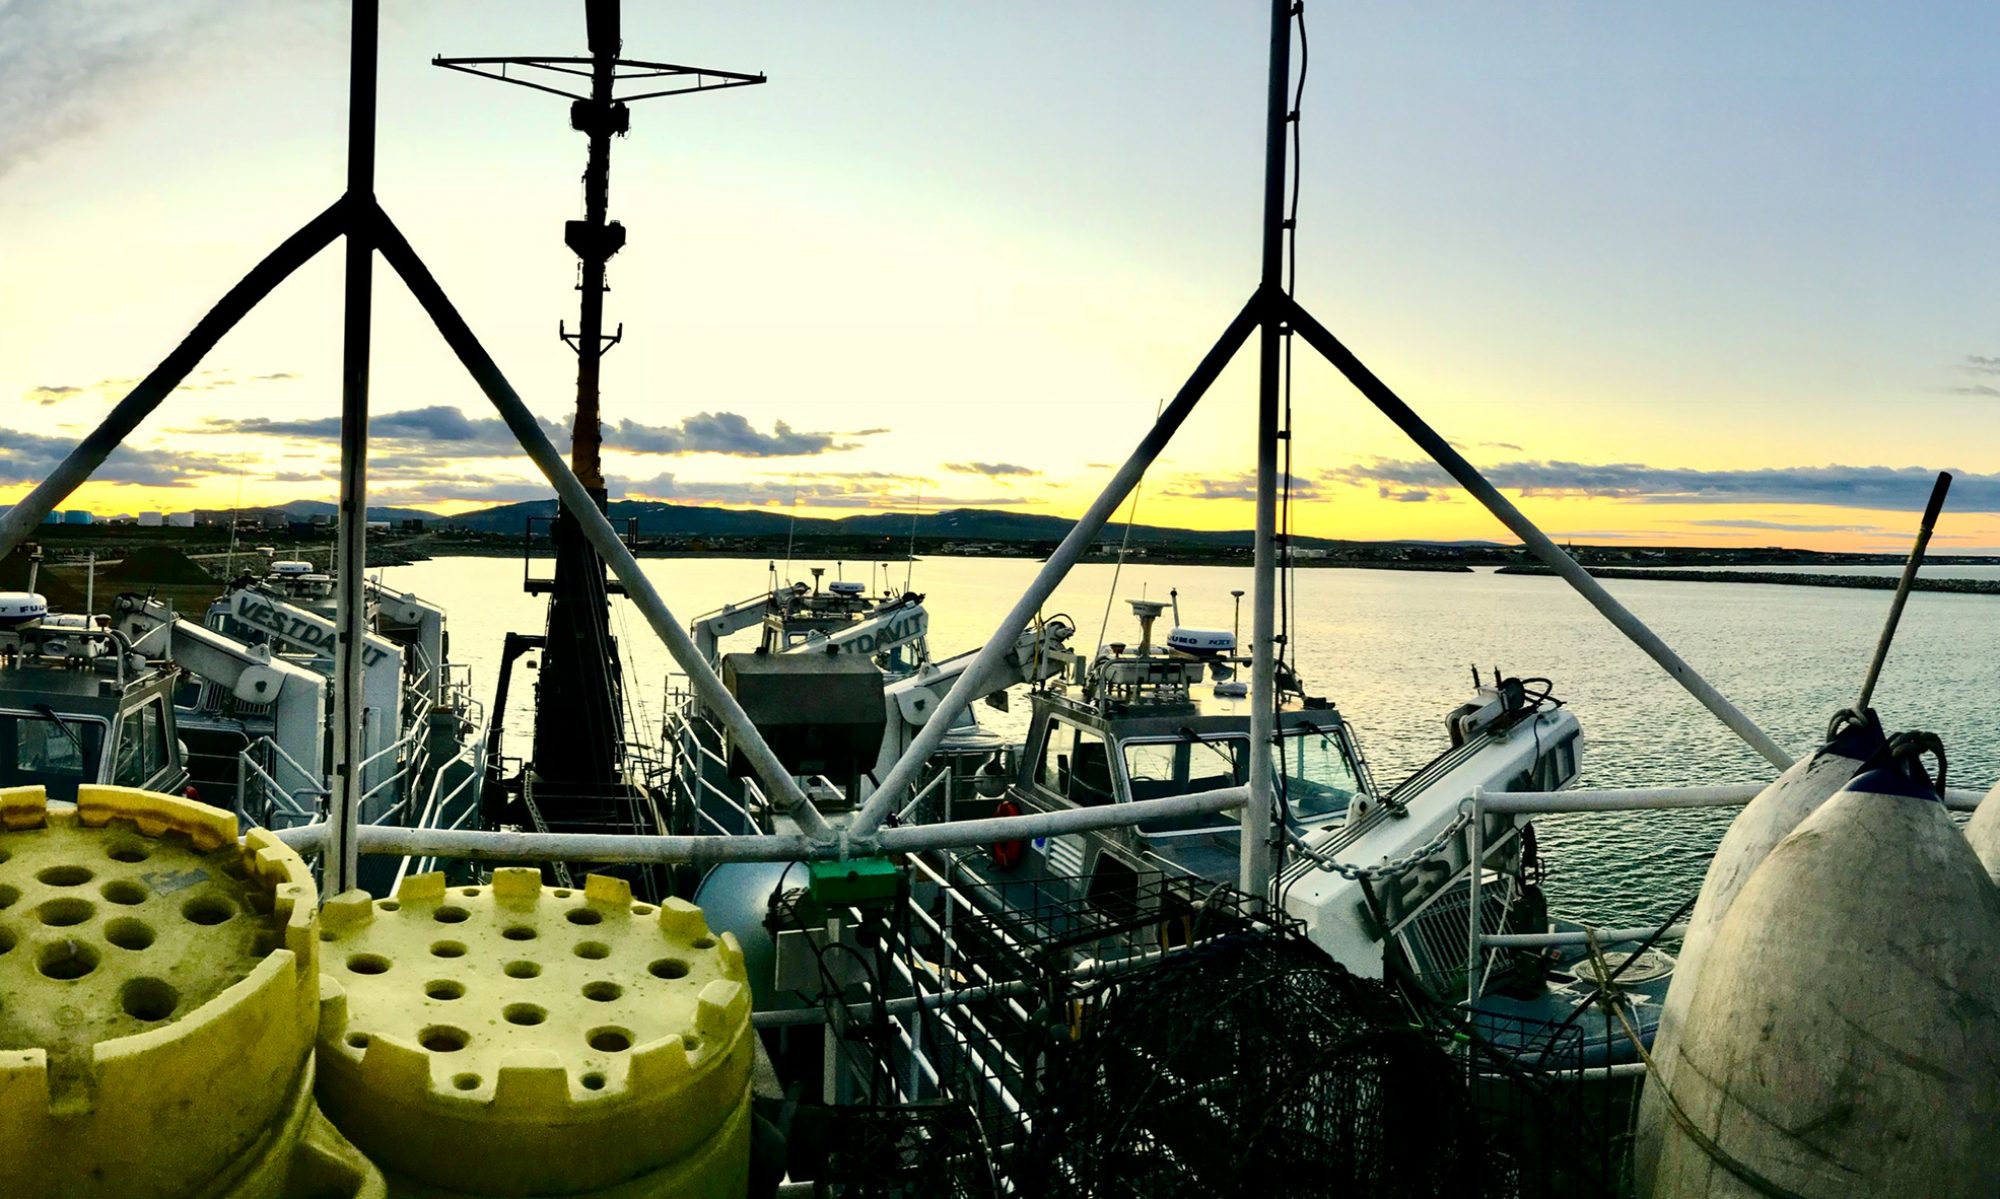
The RAINIER is now anchored for the next several days in Cushman Bay on the north side of Mitrofania Island. Today the ship’s crew began their first full day of mapping the bottom of the waters surrounding the island.  The Captain assigned me to observe operations on board one of the RAINIER’s six survey launches.  The launches are small craft equipped with sonar and computer equipment to collect bottom data as seen in the following photographs:

Each launch has a crew of three and four launches go out at a time.  On my launch, Ensign Brianna Welton serves as the hydrographer in charge with Matt Boles as the Assistant Survey Technician. Able Body Seaman Corey Mussey drives the launch and makes sure it stays on course using a computer screen directs him where to go.

A winch lowered our launch into the water. We jumped about two feet from the side of the ship to get into the launch. We carried no equipment in our hands or on our backs and wore life jackets to ensure we safely crossed the deep water.

Screen shot 2013-04-09 at 9.42.37 AM

Once underway, Ensign Welton turned on the Differential Global Positioning System (DGPS). The DGPS uses satellite signals to determine our location and even can tell our direction and speed. Unfortunately, our DGPS did not work correctly and Ensign Welton and Matt Boles struggled over the next 2 hours to trouble shoot the problem.  When out at sea and hundreds of miles from the nearest repair shop, the crew of the RAINIER has to become creative to solve problems in order to achieve their mapping mission.  The DGPS problem finally got fixed after the antenna was taken apart and the connecting cables cleaned. Matt told me that whenever one starts a new field survey, you commonly find problems that must be fixed due to the difficulties of working in the harsh environments found at sea and in Alaska.

Screen shot 2013-04-12 at 9.05.01 PMWith the DGPS fixed, the crew sent a SEACAT probe through the water column to the bottom to collect temperature, salinity and pressure data.  Sonar mapping works by bouncing sound waves off the bottom and measuring how fast the waves return to the ship. Sound travels through salt water at 1435 meters per second, but its speed can be changed by temperature, salinity or pressure.  The computer takes the data from the SEACAT and makes corrections to the sonar data so we have a better measurement of the bottom depth.

Sunset over the bow
Sunset over the bow

We spent the rest of the day running transects to map the bottom. Transects are long, parallel lines that are spaced to ensure we cover the entire bottom of the area being mapped with some overlap. To better understand what “running a transect” means, think about mowing your lawn.  When you mow the lawn, you run the mower in parallel lines, but you always go over part of the path you mowed before in the previous line. Just like mowing, the sonar is able to map the entire bottom of the map area by using a transect pattern.

Around 4:30 pm we returned to the RAINIER and the deck crew winched the launch back on board. I handled the stern line and threw it to a deck hand on the ship. I also attached the hook from the winch onto the launch, but I didn’t do it correctly on my first try. You have to be careful because the launch weighs 14,000 pounds and the seas can bounce it around. I got too close to the block and tackle on the winch, but Ensign Welton pulled me back and showed me how to properly connect the cables.  To the right here is a picture of Ensign Welton correctly hooking up the launch.

Once the launch returned to the RAINIER, the mapping crew’s duties were not f inished. After supper, the crew down loaded the launch’s computers onto the ship’s main frame and “cleaned up” the data.  Clean up consisted of looking at the data and matching it with maps on the main frame computer.  The survey technician also had to correct the data with tidal information and look for false sonar signals to remove from the data set. Upon finishing clean up, an officer checked the work for quality.  Here is a picture of Dan Boles, Matt’s older brother, cleaning up some data.

Personal Log 

I had a great time today going out on the launch and learning what the survey crews do.  The landscape overwhelms one with large open areas of water surrounded by mountains covered in green, low lying vegetation.  Mount Veniaminof dominates the background with its glacier covered dome that rises 7,075 feet above sea level.

As we traveled in the launch, I could see whales blowing spray out their blow holes in the distance and pink salmon jumping out of the water.  At the end of work, we took 10 minutes to fish off the launch and Matt caught a ling cod while I had one on the hook that got away.

I enjoyed talking to Matt Boles and learning about how he ended up on the RAINIER with his brother Dan. Matt has a two year college degree in computers and Dan has a Bachelors degree in geology and French. I see a lot of potential for my own students to get jobs aboard ships like the RAINIER and to have a great time exploring wild places like Matt and Dan.

Question of the Day 

Why do temperature, salinity and pressure change the speed of sound in water?