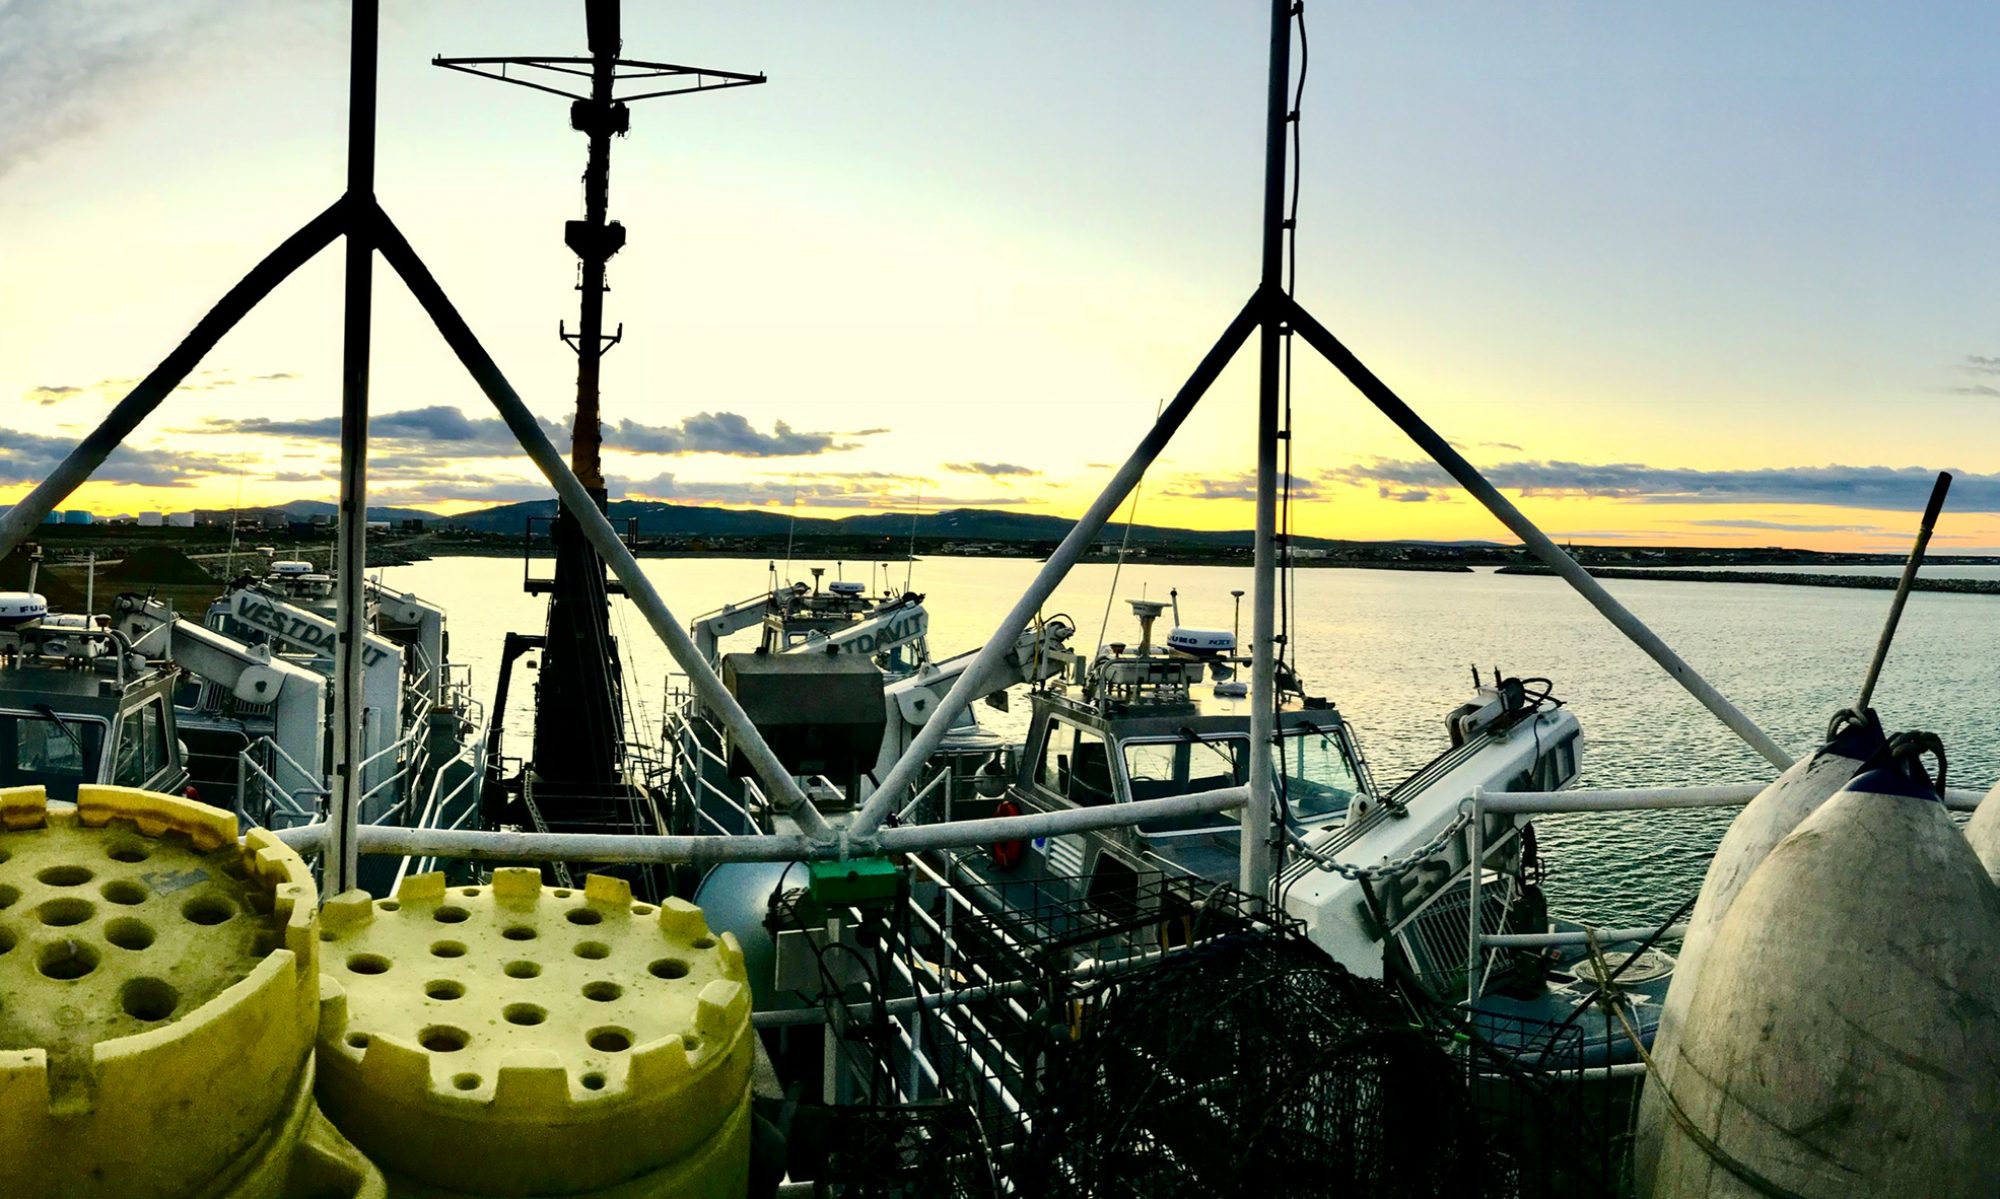
JoAnne Kronberg, July 16, 2005

NOAA Teacher at Sea
JoAnne Kronberg
Onboard NOAA Ship Rainier
July 12 – 22, 2005

Mission: Hydrographic Survey
Geographical Area: North Pacific, Gulf of Alaska
Date: July 16, 2005

Weather Data
Winds:  Southwest at 20 knots
Waves: 7 feet
By tonight, the winds should become totally west at 20 knots the wave height should drop to 6 feet.

Science and Technology Log

We have finally gotten across the Gulf of Alaska and tomorrow will begin some real work again. We entered the Shelikoff Strait and will proceed toward the vicinity of the Semidi Islands.  Our goal is to reach Mitrofania Island by Tuesday morning.

The Plotting Room on the NOAA ship RAINIER

Today I spent my day in the Plotting Room with one of the navigators named Brent.  He showed me how they use the information we accumulated on July 13 while on Launch #5 in Barrows Bay. On that day we were surveying two different sections by the multi-line sensors. As the beams were sent out, they recorded whatever was in the water and on the bottom to the computer on the launch.  This information was also transmitted to the proper program on a computer on the RAINIER.  Now the technologists, interns, scientists and engineers analyze the information as it appears on the computer screens.  Daily, already programmed into the computer, are the variations that will change such as the tides, currents and temperatures. In this way, the information is as accurate as possible. By observing the screens, the scientists, plotters and hydrographers can chart the depths, obstacles,(such as crab pots or rocks), temperatures and currents.  All of this information is plotted on paper charts for all navigators and ship captains, whether their ships are owned by the United States, commercial enterprises or private sailors.

The men and women who do this work have varied backgrounds and education.  Some are mechanical engineers, geography scientists, geologist, interns and college students who are learning hydrography.

That’s it from the RAINIER JoAnne Kronberg Teacher-at-Sea

JoAnne Kronberg, July 15, 2005

NOAA Teacher at Sea
JoAnne Kronberg
Onboard NOAA Ship Rainier
July 12 – 22, 2005

Mission: Hydrographic Survey
Geographical Area: North Pacific
Date: July 15, 2005

Weather Data
Latitude:  55N
Longitude: 144W
Winds:  55 knots
Sea Wave Height: 7-8 feet
Wave Swells are from the Southwest
Cloud cover: Totally overcast with occasional showers (no storms)

Science and Technology Log

The Officers, Intern officers, Survey crew and Engineering Staff are working all day producing the charts from the technological information we compiled from the work we did on the launches on Tuesday and Wednesday. It is very careful and detail-oriented type of work. They often work together to “bounce” ideas off of each other.

Today, I took the NOAA Security Awareness Course.  It was very long. It took me over an hour to complete it, but I learned a great deal.  At the end of the course, I took the test and got all of the answers correct.  I must have been paying attention!  Now I know how to make my own computer at home more secure and what to look for.

That’s it for today.

JoAnne Kronberg Teacher-at-Sea

JoAnne Kronberg, July 14, 2005

NOAA Teacher at Sea
JoAnne Kronberg
Onboard NOAA Ship Rainier
July 12 – 22, 2005

Mission: Hydrographic Survey
Geographical Area: North Pacific
Date: July 14, 2005

Personal Log

Thursday and Friday are traveling days for the NOAA ship RAINIER.  At 6:00 a.m. we left the Puget Sound and transit Seymour Narrows.  By evening we will transit Queen Charlotte Sound.  We expect to reach and transit Lama Passage (also known as Bella Bella) by 2030 (8:30 p.m.).

On board, the officers, junior officers, Safety Director and Engineers have been having meetings.

As a new person on board, I viewed the three videotapes that are required by OSHA for all persons on the ship.  The videotapes were entitled Hazardous Materials and Hazardous Waste Management, Are You at Risk–Asbestos Awareness, and Emergency Escape Breathing Device.  They were interesting and make the viewer more aware of the importance of knowing this information.  We must all take responsibility for our own health and safety and those among us.

That’s it for Thursday.  I hope that I have something more exciting to tell you tomorrow.

JoAnne Kronberg Teacher-at-Sea

JoAnne Kronberg, July 13, 2005

NOAA Teacher at Sea
JoAnne Kronberg
Onboard NOAA Ship Rainier
July 12 – 22, 2005

Mission: Hydrographic Survey
Geographical Area: North Pacific
Date: July 13, 2005

Weather Data
Latitude:  46.28N
Longitude: 122.4 W
Wind:  West at 20-30 Knots
Waves:  3-5 feet subsiding to 2-3 feet
Temperature: 70 degrees
Cloud Cover: Partly Cloudy with possible drizzle

Science and Technology Log

I boarded the RAINIER cruiser RA4 at 7:00 am to begin our mission today.  Our mission today was to survey the waters between Alan Island and Burrows Island.  There are two separate waterways between the Islands and they are called Allan’s Pass and Barrows Pass.

Of course, before heading out to this area, we dropped the CTD Cast in the water beside the boat to determine the Conductivity, Temperature and the Density of the water.  We need to know this information before we begin to do our survey.  These factors will certainly affect readings that we receive from the sensors.

The four computer screens were operating just find giving up the pictures of the bottom, the range of the sensors, the location of the sensor in relationship to the surrounding waters and the lines we were following to survey. The second computer screen specifically gives us the depth of the water.  Depth is indicated by different colors- brownish color indicates shallow and green indicates more depth.  Our average depth today was 79.6 feet.

When we finished surveying the waters around the two islands, we moved to the south of Alan Island to complete a survey that had been started earlier this spring.

I noticed two interesting items today.  There was a lighthouse on one promontory called Fidalgo Head. I saw a large solar panel located at the base of the lighthouse.  I assumed that the energy was used to light the lighthouse and this was confirmed by our engineer.  I also noticed a great deal of kelp in the waters around the islands.  I was told that a great deal comes from the islands when it washes down from the stiff cliffs.

It was an exciting day for me because I got to drive (pilot) for a short while around the islands. I am experiencing and learning so many new things.

Signing off for today, JoAnne Kronberg Teacher-at-Sea

JoAnne Kronberg, July 12, 2005

NOAA Teacher at Sea
JoAnne Kronberg
Onboard NOAA Ship Rainier
July 12 – 22, 2005

Mission: Hydrographic Survey
Geographical Area: North Pacific
Date: July 12, 2005

Weather Data from the Bridge
Latitude:  48.2W
Longitude: 122.46N
Wind:  SW10 knots to 15-25 knots in the afternoon
Waves: 1 foot increasing to 2-4 feet
Wave Swell:  5 feet
Cloud Cover: Overcast

Science and Technology Log

I was assigned to the RAINIER cruiser #5.  Our mission today was to survey the water in the lanes parallel to the shore and outside the northbound commercial freight lanes.  This area had been surveyed before, about 1995, but a few tugboats had questions about the depths in this area. We were told to complete as many crosslines as possible.  Our map to follow was Sheet H (H11375) – Specifically Sections 27 and 28.

Before we could begin the survey, we had to put the CTD Cast in the water for about 10 minutes.  This device is called the CTD because it registers the Conductivity, Temperature and Depth of the water.  The computer needs this information before we can turn on the Sensor to start the charting.  We traveled about 7-8 knots because the water was fairly calm.  When it is rough, we can only travel about 6 knots.

Now we could start traveling in lines as the Sensor at the bottom of the ship starts sending out beams.  The Sensor we use is a multi-beam model; the double beams span a 150 degrees area, but only 120 degrees range of the information is used.  The information at the outside of this range is not reliable.  As the ship travels, the beams ping the ocean floor and send the information to the four computer screens set up on the “dash board” of the boat. The four screens show (a) a map of our location, (b) a picture of the floor of the ocean, (c) the lines that the sensors have covered, and finally (d) the position of the Sensor on the bottom of the boat.  All of this information is recorded on the computers.  Then later today, a technologist will be able to print out a map and chart all the information on the map for other ships.

When we finished with our assigned mission, we still had time.  So we radioed back to the RAINIER and asked for our next assignment. The ship directed us to another section, Section 24. We surveyed this Section, near Hocky Point, and then returned to the ship.

It has been a very interesting and exciting day.