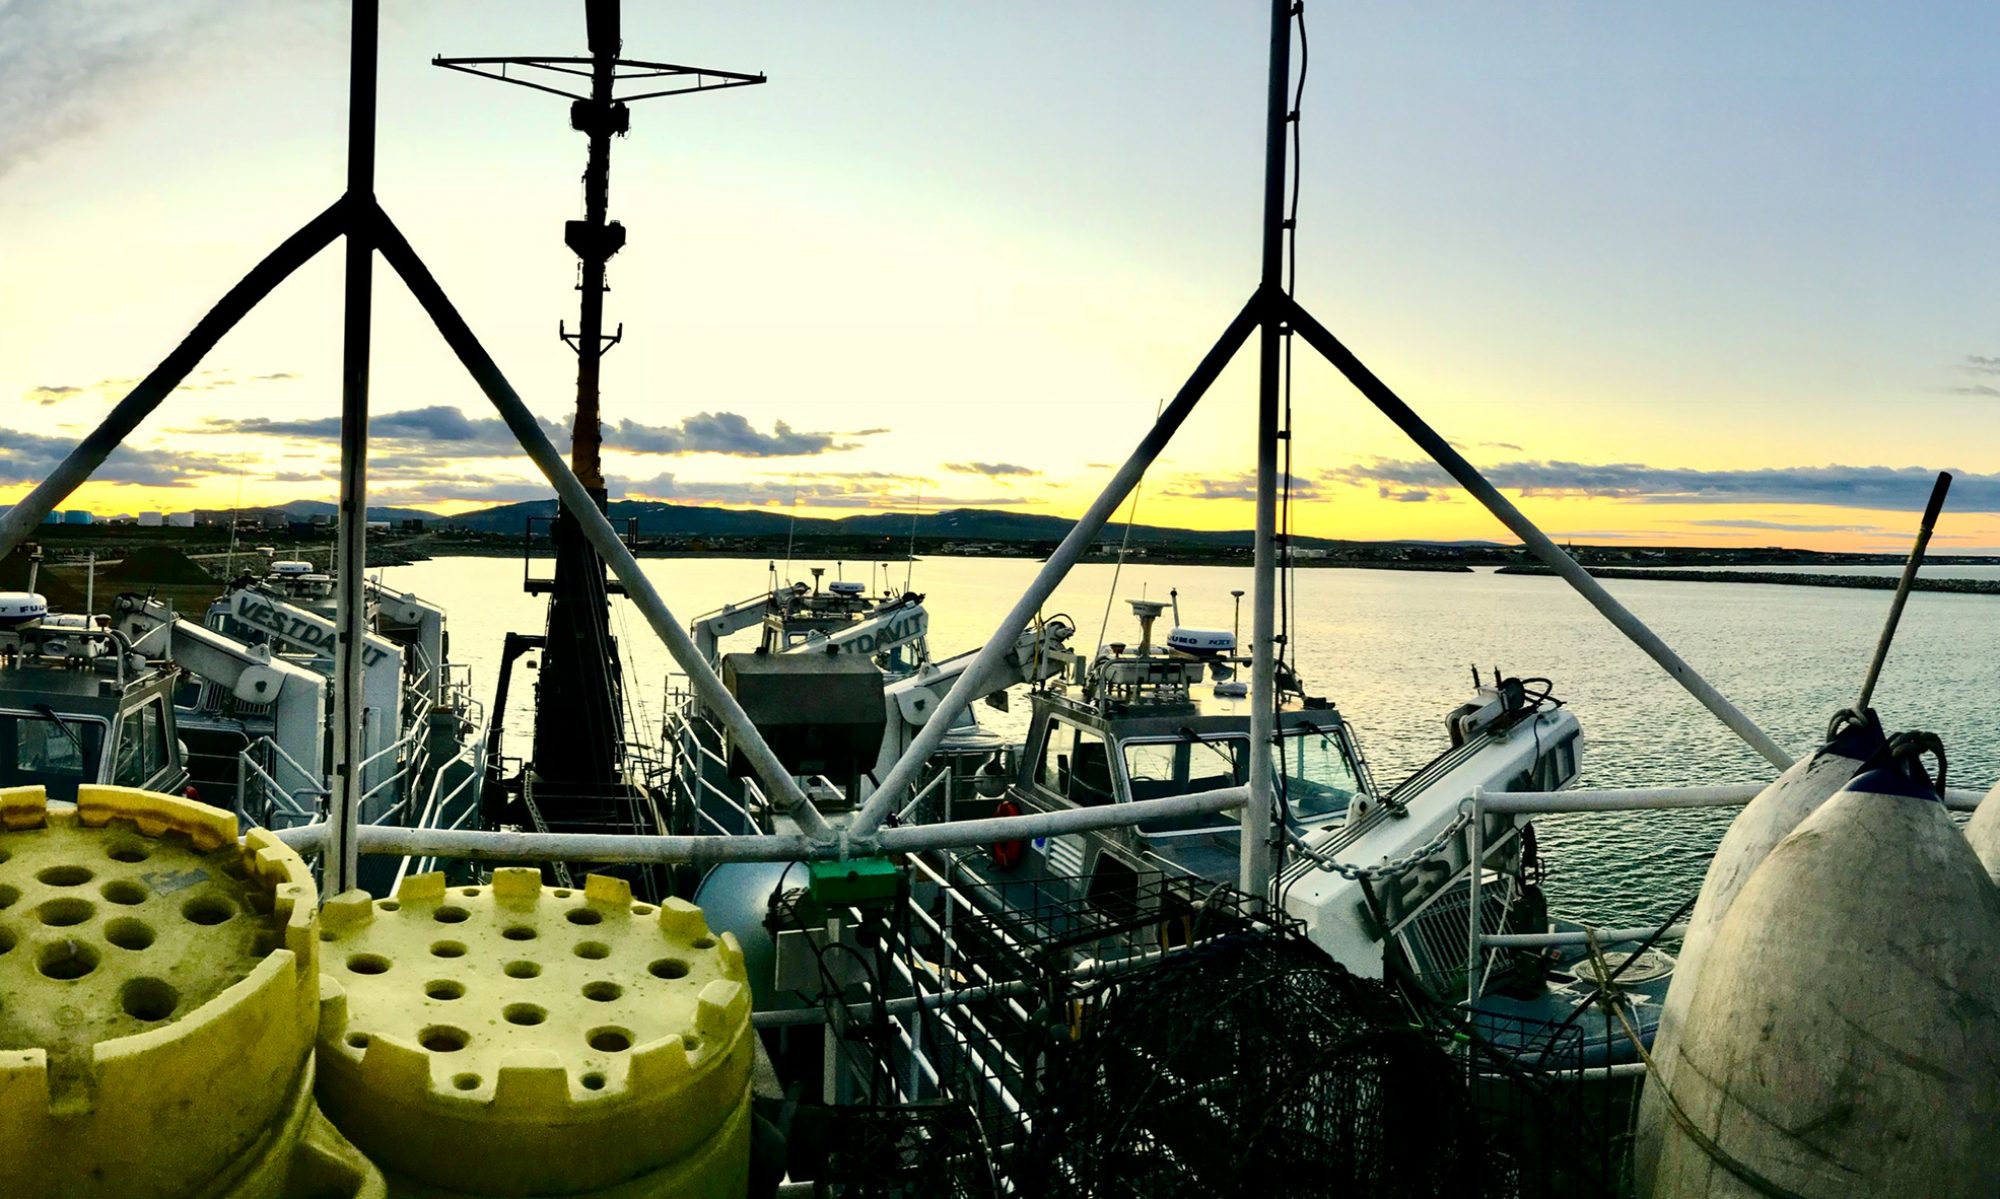
Jeff Peterson: The Work in the Western Gulf, July 15, 2018

 NOAA Teacher at Sea

Jeff Peterson

Aboard NOAA Ship Oregon II

July 9 – July 20, 2018


Mission: SEAMAP Summer Groundfish Survey

Geographic Area of Cruise: Gulf of Mexico

Date: July 15, 2018


Weather Data from the Bridge

Date: 2018/07/18

Time: 16:05:45

Latitude: 30 05.44 N

Longitude: 085 52.76 W

Speed over ground: 05.3 knots

Barometric pressure: 1015.62 mbar

Relative humidity: 81%

Air temp: 27.6 C


Science and Technology Log

At the time of writing, we’ve completed the “stations” (i.e., the appointed stops where we trawl to collect specimens) in the western Gulf of Mexico, and are headed to the Florida coast, where we’ll conclude the 3rd leg of the Summer Groundfish Survey. Sometime tonight we’ll arrive and resume work, trawling and identifying fish. What follows is my attempt to furnish a detailed description of where we are and what we’re doing.

Stations: Where We Stop & Why

As I explained in my previous blog post, “Learner at Sea: Day 1,” the survey work being performed on this cruise contributes to a larger collective enterprise called SEAMAP, the Southeast Area Monitoring and Assessment Program. The “sample area” of SEAMAP is considerable, ranging from Texas-Mexico border to the Florida Keys.

image 1 SEAMAP - coverage
Spatial coverage of SEAMAP Summer and Fall Trawl Surveys in the northern Gulf of Mexico

Fisheries biologist Adam Pollack tells me that the total trawlable area–that is, excluding such features as known reefs, oil rigs, and sanctuaries–consists of 228,943.65 square kilometers or 88,943.65 square miles. That’s a piece of ocean of considerable size: nearly as big as Louisiana and Mississippi combined.

SEAMAP divides the sample area into a series of statistically comparable “zones” (there are two zones within each of the numbered areas in the diagram above), taking into account a key variable (or stratum): depth. It then assigns a proportionate number of randomized locations to every zone, arriving at 360-400 stations for the sample area as a whole. Statisticians call this method a “stratified random design.”

While Louisiana, Mississippi,  Alabama, and Florida participate in the SEAMAP, the lion’s share of stations are surveyed by NOAA.

These are the 49 stations we sampled during the first half of the cruise, off the shore of Louisiana:

leg 3 west
Stations covered in the western Gulf during the 3rd leg of the Summer Groundfish Survey

The data from the Summer Survey is analyzed in the fall and available the following spring. NOAA’s assessments are then passed along to the regional Fisheries Management Councils who take them into account in setting guidelines.

The Trawl: How we Get Fish Aboard

NOAA Ship Oregon II brings fish aboard using an otter trawl. As described in “Mississippi Trawl Gear Characterization,” “The basic otter trawl is the most common type of trawl used in Mississippi waters to harvest shrimp. The otter trawl is constructed of twine webbing that when fully deployed makes a cone shape. Floats on the head-rope (top line) and chains on the foot rope (bottom line) of are used to open the mouth of the trawl vertically. To spread the mouth of the trawl open as large as possible, each side (wing) is attached to trawl doors” (http://www.nmfs.noaa.gov/pr/pdfs/strategy/ms_trawl_gear.pdf). Positioned by chains so that their leading edges flare out, those doors are sizable and heavy, 40 inches high and 8 feet long, and help not only to spread the net open (and ‘herd’ fish in) but also to keep it seated on the ocean floor.

An otter trawl deployed

To mitigate environmental harm–and, in particular, to help save inadvertently caught sea turtles—trawling time is limited to 30 minutes. The trawl is 40 feet wide and is dragged over 1.5 miles of ocean bottom.

Here are the trawl’s technical specifications:

Trawl schematic
Trawl schematic, courtesy of NOAA fishing gear specialist Nicholas Hopkins

It should not go without saying that deploying and retrieving gear like this is mission critical, and requires physical might, agility, and vigilance. Those tasks (and others) are performed expertly by the Deck Department, manned on the day watch by Chief Boatswain Tim Martin and Fisherman James Rhue. Fisherman Chris Rawley joins them on the swing shift, coming on deck in the evening.

The process of bringing the trawl aboard looks like this:

doors up
Trawl doors on their way up toward the starboard outrigger
separating
Seizing the “lazy line” with the hook pole
orange section
The “elephant ear” (orange section) secured
cod end at the rail
Chief Boatswain Tim Martin brings a catch over the rail

The bottom of the trawl is secured with a special knot that permits controlled release of the catch.

knot
Among other names, this piece of handiwork is known as the “double daisy chain” or “zipper knot”


The catch emptied into baskets

CTD

Before every trawl, the CTD is deployed from the well deck (port side) to collect data on, as its acronym suggests: Conductivity, Temperature, and Depth. According to NOAA’s Ocean Explorer website, “A CTD device’s primary function is to detect how the conductivity and temperature of the water column changes relative to depth. Conductivity is a measure of how well a solution conducts electricity. Conductivity is directly related to salinity, which is the concentration of salt and other inorganic compounds in seawater. Salinity is one of the most basic measurements used by ocean scientists. When combined with temperature data, salinity measurements can be used to determine seawater density which is a primary driving force for major ocean currents” (https://oceanexplorer.noaa.gov/facts/ctd.html).

The CTD secured on deck


CTD in the water
The CTD suspended at the surface, awaiting descent

During daylight hours, a scientist assists with the deployment of the CTD, contributing observations on wave height and water color. For the latter, we use a Forel-Ule scale, which furnishes a gradation of chemically simulated water colors.


Forel-Ule scale
Forel-Ule scale


The Wet Lab: How We Turn Fish into Information

Once in baskets, the catch is weighed and then taken inside the wet lab.

the wet lab
The wet lab: looking forward. Fish are sorted on the conveyor belt (on the right) and identified, measured, weighed, and sexed using the computers (on the left).

Once inside the wet lab, the catch is emptied onto the conveyor belt

Fish ready for sorting
Snapper on the belt
A small catch with a big Snapper

Next the catch is sorting into smaller, species-specific baskets:

Emily McMullen sorting fish


batfish face
Say hello to the Bat Fish: Ogecephalus declivirostris
Calico Box Crab, Hepatus epheliticus


Blue Crab, Callinectes sapidus

At this stage, fish are ready to be represented as data in the Fisheries Scientific Computing System (FSCS). This is a two-step process. First, each basket of fish is entered by genus and species name, and its number recorded in the aggregate.

Andre entering data
Andre DeBose entering initial fish data in FSCS

Then, a selection individual specimens from each basket (up to 20, if there are that many) are measured and weighed and sexed.

Andre and Emily measuring
Andre and Emily measuring and sexing fish

Occasionally researchers from particular laboratories have made special requests for species, and so we label them, bag them, and stow them in the bait freezer room.

requests
Special requests for specimens


IMG_8214
Red Snapper, Lutjanus campechanus, for Beverly Barnett

Once every animal in the trawl has been accounted for and its data duly recorded, it’s time to wash everything down and get ready to do it all over again.

porthole
Late afternoon view from the wet lab porthole


Personal Log

The key to enjoying work in the wet lab is, as I see it, the enduring promise of novelty: the possibility of surprise at finding something you’ve never seen before! For me, that promise offsets the bracing physical rigors of the work and leavens its repetitiveness. (Breathtaking cloudscapes and gorgeous sunsets do, too, just for the record. Out here on the water, there seem to be incidental beauties in every direction.) Think of the movie Groundhog Day or Camus’s “The Myth of Sisyphus” and cross either of them with the joys of beach-combing on an unbelievably bounteous beach, and you’ll have a sense of the absurd excitement of identifying fish at the sorting stage. Life in the wet lab is a lot like Bubba Gump’s box of chocolates: “You never know what you’re gonna get.”

At the next stage, data entry, the challenge for the novice is auditory and linguistic. Between the continual growl the engine makes and the prop noise of the wet lab’s constantly whirring fans, you’ve got the soundscape of an industrial workplace. Amid that cascade of sound, you need to discern unfamiliar (scientific) names for unfamiliar creatures, catching genus and species distinctions as they’re called out by your watch-mates. The good news is that the scientists you’re working with are living and breathing field guides, capable of identifying just about any animal you hold up with a quizzical look. It’s a relative rarity that we have to consult printed guides for IDs, but when we do and that task falls to me, the shell-collector kid in me secretly rejoices.

IMG_7825
I found it! Ethusa microphthalma (female)

I’m enjoying the camaraderie of my watch, led by Andre DeBose, and, as my posts suggest, I’ve had some good opportunities to pick Adam Pollack’s brain on fisheries issues. My partner in fish data-entry, Emily McMullen–an aspiring marine scientist who’ll be applying to graduate programs this fall–did this cruise last summer and has been an easy-going co-worker, patient and understanding as I learn the ropes. I’ve also had some wonderful conversations with folks like Skilled Fisherman Mike Conway, First Assistant Engineer Will Osborn, and Fisheries Biologist Alonzo Hamilton.

It’s been a busy week, as you’ll have gathered, but I’ve still managed to do some sketching. Here’s a page from my sketchbook on the CTD:

CTD
Sketch of the CTD. The main upright tanks, I learned, are Niskin Bottles

And here’s a page from my journal that pictures three species we saw quite often in the western Gulf:

Longspined Porgy - Butterfish - Brown Shrimp
Longspine Porgy (Stenotomus caprinus), Butterfish (Peprilus burti), and Brown Shrimp (Farfanepenaeus aztectus)

Had I the time, I’d sketch the rest of my “Top 10” species we’ve seen most commonly in the western Gulf. That list would include (in no particular order): the Paper Scallop, Amusium papyraceum; Lookdown, Selene vomer; Blue Crab, Callinectes sapidus; Squid, Loligo; Lizardfish, Synodus foetens; Croaker, Micropogonias undulatus; and Red Snapper:

Red Snapper
Presented for your inspection: Red Snapper, Lutjanus campechanus

Did You Know?

Four of the species visible on the surface of this basket have been identified in the blog post you’ve just read. Can you ID them? And how many of each would you say there are here on the surface?

Basket of fish
Basket of fish


 Look for a key in my next blog post.


David Knight: Work Out and Work Up: Part II, July 18, 2018

NOAA Teacher at Sea

David Knight

Aboard NOAA Ship Pisces

July 10-23, 2018

Mission: Southeast Fishery-Independent Survey

Geographic Area: Southeastern U.S. coast

Date: July 18, 2018

Weather Data from the Bridge:

Latitude: 29° 45.3′

Longitude: 80° 22.5′

Sea wave height: 1-3 ft

Wind speed: 5 kts

Wind direction: 241

Visibility: 10 nm

Air temperature: 28 °C

Barometric pressure: 1014.9 mb

Sky: Scattered Clouds


Science and Technology Log

Part II. DNA, Gonads, and Diet

DNA Samples.

Certain fish that we collect have samples of their fins collected for DNA testing. For example, if a Spotfin Butterflyfish (Chaetodon ocellatus) is brought up in a trap, a small pair of scissors are used to clip a portion of its anal fin in order to obtain a sample that is then place in a micro-test tube containing a buffer. Back in the on-shore lab, technicians will obtain the DNA, which is then used to determine the genetic make-up of the population in a particular area.

Fin clip
Fin clip sample from Spotfin Butterfly fish. (photo by David Knight)

One may assume that the genetic make-up of a population is uniform across the east coast, after all, fish can swim, right? However, that is not necessarily the case. Changes in the frequency of particular alleles create spatial differences in some stocks of fish over a broad area. In other words, there may be slight genetic differences in a population of Gray Triggerfish off of the coast of North Carolina compared to those found in the waters of Florida.

Why does this matter? Currently, the management of most fish occurs over a broad area, often including many states. By understanding the slight differences that may be present in a smaller subset of a population, scientists can create better, more accurate management plans instead of a “one size fits all” model.

Gonads.

As written in an earlier blog, many fish in this region are sequential hermaphrodites and change sex during their life-time, starting off as females, then changing to males.  By taking the gonads of certain species, scientist can determine if the fish is male or female, and taken together with size and age, it is possible to estimate when these fish are transitioning from one sex to another.

Ovaries from a Vermilion Snapper
Ovaries from a Vermilion Snapper – I made a small incision so you can the eggs. (photo by David Knight)

By sampling the ovaries of fish, it is possible to estimate the fecundity of the species. Fecundity is the reproductive potential an organism possesses. The number of eggs in an ovary can be estimated and then, taking the age and size data of the specimen, it is possible to predict the potential a population has for growth. Many factors, such as the number of males in a population and the season, can influence the reproductive behaviors of fish, so sampling the gonads provides an additional pieces of data.

Finally, sampling the gonads of fish can help determine the sex ratio in the population. In fish that display sequential hermaphroditism, such as the Black Sea Bass, the number of males in the populations increase with age.

Question: Fisherman will be able to get more money for larger fish, so naturally they will want to “select for” larger fish, potentially decreasing the number of reproductive males in the population. If the number of large, reproductive males in a population decreases, then more females will transition to become male.

What may happen to the average age of sex transition in sequential hermaphrodites?

Diet.

A select few species have their stomach contents sampled. If we know what a particular species is eating, then we are able to understand the trophic interactions within the ecosystem much better. An ecosystem-based management plan will look at the interactions taking place between the many prey and predator species, whom are often competing for the same resources.  Because the diverse species in an ecosystem are inextricably linked, an increase in one species is likely to affect the other. If one species is over-fished or not reproducing at its potential, this may create a ripple effect throughout the ecosystem.


Personal Log

The food on board the NOAA Ship Pisces has been great. The Stewards, Rey and Dana, have kept us well fed with a variety of great meals. We’ve had everything from hot dogs and hamburgers to bacon wrapped filet mignon and shrimp, and a crew favorite, Taco Tuesday! Meal time is very important because not only is the crew refueling for work, but it affords them a chance to sit down, talk, and to catch up on Chip and Joanna Gaines’ newest “Fixer Upper” on the TV that runs continuously. The first day on board, Operations Officer, Lieutenant Jamie Park, told me that any NOAA ship runs on two very important things: 1) diesel fuel, and 2) COFFEE.  The galley is open 24-7 with snacks and drinks always available since crew members are working in shifts, with some getting off at midnight or 4 a.m.. And…., I recently found the freezer that contains Klondike Bars, popsicles, ice cream, and Hot Pockets.


This slideshow requires JavaScript.

Did You Know?

The Red Snapper (Lutjanus campechanus) gets its name from its enlarged canine teeth. According to the 2016 stock assessment of South Atlantic red snapper, the stock is overfished and subject to overfishing, but is rebuilding.  Management plans in the South Atlantic and Gulf of Mexico place annual catch limits on both commercial and recreational fisherman to decrease the pressure on the fish, as well as minimum size restrictions to protect young and juvenile snapper. Red Snapper can live over 50 years and are of reproductive age as early as two.

range of red snapper
Range of Red Snapper-South Atlantic (NOAA)
Site Map
Sites where traps were set. 32 nautical miles southeast of Cape Fear, North Carolina. Blue indicates deep water, Red indicates more shallow water. (image by Nate Bacheler)
snapper_red2_locationmap
Range of Red Snapper-Gulf of Mexico (NOAA)

Reference:

NOAA Fisheries. https://www.fisheries.noaa.gov/species/red-snapper


Kate Schafer: So Many Snappers… September 24, 2017

NOAA Teacher at Sea

Kate Schafer

Aboard NOAA Ship Oregon II

September 17 – 30, 2017


Mission: Shark/Red Snapper Longline Survey

Geographic Area of Cruise: Gulf of Mexico

Date: September 24, 2017

Weather Data from the Bridge:

Latitude: 28o 25.1’ N
Longitude: 94o 50.3’ W

Broken sky

Visibility 10 nautical miles

Wind speed 13 knots

Sea wave height 2-3 feet

Temperature Seawater 28.8 o Celsius

Science and Technology Log:

This is a shark and red snapper longline survey, and the sharks tend to steal the stage.  They are bigger (for the most part), more diverse and definitely have more of a reputation.  I have been surprised, however, by how much I’ve been drawn to the snappers.  They are a beautiful color, and tend to come up in groups that are pretty similar in size.

RedSnapper
Red snapper (Lutjanus campechanus) ready to be measured

The Northern Red Snapper (Lutjanus campechanus) is commonly fished in the Gulf of Mexico, both recreationally and commercially.  It turns out that the commercial fishers get 51% of the catch quota and the recreational fishers get 49%.  The methods for dividing up those two basically equal pieces of the pie is different between the commercial and recreational fishers. In addition, the commercial fishing catch is monitored very closely, while the recreational fishing catch numbers are largely unknown.  Plus, the states have their own waters that extend out to different distances, depending on the state, and the federal waters extend from the state water boundary to 200 nautical miles offshore.  So, in other words, managing the fishery is quite complicated.

So, how do all these fishing rules and regulations get established and modified over time?  A law was passed in 1976, called the Magnuson-Stevens Fishery Conservation and Management Act, and one of the key parts of the act established eight regional management councils for regulating fishing in federal waters (more information on the act here: http://www.nmfs.noaa.gov/sfa/laws_policies/msa/).  It also established the 200 nautical mile extension of federal waters from land.  The Gulf of Mexico Fishery Management Council (GMFMC) is responsible for creating Fisheries Management Plans (FMPs) for fisheries within the U.S. federal waters of the Gulf of Mexico, from southern Texas, along Louisiana, Mississippi, and Alabama, and down the west coast of Florida.  This graphic shows the catch limits for red snapper and other species for 2017 set by the GMFMC.  For red snapper, the catch limit is close to 14 million pounds.

2017ACLBLOGGraphic_07-17-1024x663
Annual Catch Limits as set by the Gulf of Mexico Fishery Management Council (http://gulfcouncil.org/fishing-regulations/federal/)

The data that we are collecting helps scientists and policy makers to determine what the annual catch limit for a particular season should be.  For each fish that we bring on board, we measure the fish length and weight, as well as the weight of the gonads.  In addition, we collect their otoliths (ear bones) and samples of the ovaries of females.  These both help managers to estimate the age and size of the population, and future populations as well.

Otoliths are calcium carbonate hardened structures and are present in the part of the inner ear that is responsible for balance.  Humans and other vertebrates have them too, and they can be used to tell the age of the fish.  The otoliths of Lutjanus campechanus are quite large.  There seems to be an overall relationship between the habitat of the fish species and the size of the otolith.  Species like Lutjanus campechanus that live along reefs and rocky structures have much larger otoliths than species like tuna that swim up in the water column.  Flying fish, which we’ve seen a lot of, also have large otoliths, given their body size, probably aiding them in knowing where they are as they glide through the air.

Otoliths
Otoliths taken from one of the red snappers we collected

Well, we have been collecting a lot of data over the past couple of days to help inform these policies in the future!  Each line we’ve pulled in lately has had a dozen or more snappers on it,  and they are a lot of extra work as compared with the sharks, due to all the samples we have to collect once we’re done.  A couple times, we’ve barely finished before it was time to start baiting lines again.

Personal Log:

As I mentioned earlier, I’ve really come to love the red snappers.  Their eyes are the same color as their skin and I’m just awed by their size.  I am used to snappers that I’ve watched on coral reefs, and even the largest species I’ve seen on reefs are nothing compared with these guys.

SnapperEye
Red snapper (Lutjanus campechanus) eyes

I’ve also adjusted to the shift in my day, as evidenced by the fact that I’m finishing this up at 1 a.m.  It has been a long time since I’ve been on this kind of late night schedule.  I’m enjoying it, especially because I know when I return to California, I’ll be getting up at 5:30 a.m. again.


Did You Know?

That snappers eat a wide variety of different foods, including fish and various types of crustaceans? Here are a couple of items we’ve found in the ones we’ve caught.  Can anyone identify them?  I studied the second group for my Ph.D. dissertation!

MoleCrab
Mystery snapper food
Stomatopod
More snapper food


And We’re Fishing…

NOAA Teacher at Sea

Kate Schafer

Aboard NOAA Ship Oregon II

September 17 – 30, 2017


Mission: Shark/Red Snapper Longline Survey

Geographic Area of Cruise: Gulf of Mexico

Date: September 21, 2017


Weather Data from the Bridge:

Latitude: 27o 15.5’ N

Longitude: 97o 01.3’ W

Haze

Visibility 6 nautical miles

Wind SE 15 knots

Sea wave height 3-4 feet

Sea Temperature: 29.6o Celsius

Note: Just a month ago Hurricane Harvey was bringing 20 foot seas to this area, but today we’re enjoying the 3-4 foot swell.

Science and Technology Log:

Well, we’ve gotten to the fishing grounds, and we’ve gone from waiting to very busy!  We put out the first lines starting at around 8 pm on Tuesday evening.  The process involves first baiting 100 hooks with Atlantic mackerel.  When it’s time for the line to be deployed, first there is a tall buoy with a light and radar beacon (called a high flyer) on it that gets set into the water, attached to the monofilament fishing line.  Then there’s a weight, so the line sinks to the bottom, a series of 50 baited hooks then get clipped onto the line as the monofilament is being fed out.

Those 50 hooks are referred to as a “skate”.  This confused me last night when I was logging our progress on the computer.  I kept thinking that there was going to be some kind of flat, triangular shaped object clipped on to help the line move through the water…not really sure what I was imagining.  Anyway, Lisa Jones, the field party chief and fisheries biologist extraordinaire, has so kindly humored all my questions and explained that skate is just a term for some set unit of baited hooks.  In this case, the unit is 50, and we’ll be deploying two skates each time.

After the first skate comes another weight, the second skate, another weight and then the last high flyer.  Then the line is set loose and we wait.  It’s easy to locate the line again, even at night, because of the radar beacons on the high flyers.

Why are we collecting this data?

As mentioned in my previous post, one of the tasks of NOAA, especially the National Marine Fisheries Service Line Office, is to collect data that will help with effective fisheries management and assist with setting things like catch quotas and so forth.  A catch quota refers to the amount of a particular species that can be harvested in a particular year.  Fisheries management is incredibly complicated, but the basic idea is that you don’t want to use up the resource faster than it is replenishing itself.  In order to know if you are succeeding in this regard, you must go out and take a look at how things are going.  Therefore, the Oregon II goes out each year in the fall and samples roughly 200 sites over about eight weeks.  The precise locations of the sampling sites change each year but are spread out along the SE Atlantic Coast and throughout the U.S. waters in the Gulf of Mexico.

We’ve put out three long lines so far.  Last night, we caught a single fish, but it was a really cool one.  It’s called the Golden Tilefish but has an even better species name: Lopholatilus chamealeonticeps.  As Lisa was explaining that they dig burrows in the sea floor, I realized that I had seen their cousins while snorkeling around coral reefs but would never have made the connection that they were related. This guy was big!


Tilefishp3
Golden tilefish (Lopholatilus chamealeonticeps) caught in first longline of the trip

This afternoon, things got really hectic.  Of our 100 hooks, 67 had a fish on it, and 60 of those were sharks.  As we were pulling in the last bit of line, we pull on a shark that was missing its back half!  Another had a bite taken out of it.  And then on hook number 100, was a bull shark.  This shark had been snacking along the line and got caught in the process.

OLYMPUS DIGITAL CAMERA
Bull shark caught on the last hook of a very productive bout of fishing (Photo courtesy of Lisa Jones, NOAA)

And I haven’t even mentioned the red snappers.  I will save them for another post, but they are absolutely beautiful creatures.

MeasuringSnapperp3
Red snapper being measured


Personal Log:

I definitely continue to feel out of my element at times, especially as we were pulling in all these hooks with sharks on them, and I could barely keep up with my little job of tracking when a fish came on the boat.  All the sharks started running together in my mind, and it was definitely a bit stressful.  Overall, I feel like I’ve adjusted to the cadence of the boat rocking and have been sleeping a lot more soundly.  I continue to marvel at how amazing it is that we’re relatively close to shore but, except for a few songbirds desperate for a rest, there is no evidence of land that my untrained eyes can detect.  Lastly, I’ve realized that a 12-hour sampling shift is long.  I have a lot of respect for the scientists and crew that do this for months on end each year with just a few days break every now and then. Well, it time to pull in another line.  Next time, we’ll talk snapper.


Karen Grady: Observations and Data Collection Today Leads to Knowledge In The Future, April 25, 2017

NOAA Teacher at Sea

Karen Grady

Aboard NOAA Ship Oregon II

April 5 – April 20, 2017

Mission: Experimental Longline Survey

Geographic Area of Cruise: Gulf of Mexico

Date: April 25, 2017


Weather Data:

I am back settled into the crazy weather that is spring in Arkansas. Supposed to be 90 degrees today and then storms tomorrow.

Science and Technology Log

The second leg of the Oregon II’s experimental longline survey is now complete.  The ship and all the crew are safely back in the harbor.  Fourteen days at sea allows for a lot of data to be gathered by the science crew.

Now, an obvious question would be what do they do with all the data and the samples that  were collected? The largest thing from this experimental survey is looking at catch data and the different bait types that were used to see if there were differences in the species caught/numbers caught etc. They are also able to look at species compositions during a different time frame than the annual survey and different depth ranges with the much deeper sets. Fin clips were taken from certain species of sharks. Each fin clip can be tied to a specific shark that was also tagged.  If anyone ever wanted or needed to they could trace that fin clip back to the specific shark, the latitude and longitude of where it was taken, and the conditions found in the water column on that day.  Everything the scientists do is geared towards collecting data and providing as many details as possible for the big picture.

Occasionally sharks are captured and do not survive, but even these instances provide an opportunity to sample things like vertebrae for ageing studies or to look at reproductive stages. Science is always at work.  With the ultrasound machine on board we were able to use it on a couple of the sharpnose sharks and determine if they were pregnant .


ultrasound
Ultrasounding female Sharp Nose sharks to see how may pups they were carrying.


Parasites… did you know sharks and fish can have parasites on them? Yes, they do and we caught a few on this leg. Sharks or fish caught with parasites were sampled to pass along to other researchers to use for identification purposes. Kristin showed me evidence of a skin parasite on several of the small sharks. It looked like an Etch-A-Sketch drawing.

etchisketch 2
This shark had whole mural on the underside from the parasites
etchisketch 1
Shark underside marred by parasite infection

Red snapper were also sampled at times on the survey to look deeper into their life history  and ecology. Muscle tissue was collected to look at ecotoxicity within the fish (what it has been exposed to throughout out its lifetime); along with otoliths to estimate age. We are using muscle tissue to examine carbon, nitrogen, and sulfur. Each element looks into where that fish lives within the food web. For instance, carbon can help provide information about the basal primary producers, nitrogen can help to estimate the trophic level of the fish within the ecosystem, and sulfur can try to determine if the fish feeds on benthic or pelagic organisms. Otoliths are the ear bones of the fish. There are three different types of ear bones; however, sagittal ear bones (the largest of the three) will be sectioned through the core and read like a tree. Each ring is presumed to represent one year of growth.


red snapper1
Red Snapper caught and used for sample collection
paul red snapper
Paul Felts removing a hook
redsnapper head
Sometimes someone bigger swims by while a fish is on the hook

Personal Log

Now that I am home and settled I still had a few things to share. One it was great to get home to my family, but as I was warned by the science crew it does take a couple of days to adjust to the usual schedule.  It did feel good to go for a jog around town instead of having to face the Jacob’s Ladder again!


Everyone asks me if I had a good time, if it was scary, if we caught any sharks. I just don’t think there are words to express what an amazing experience this was for me.  Of course, seeing the sharks up close was just beyond words, but it was also being made a part of a working science team that are working year-round to monitor the health of the ocean and the species that live there. For me this was a two-week section of my life where I got to live on the ocean and catch sharks while learning a little about the data the science crew collects and how they use it.  The science crew will all be back out on the ocean on different legs over the next few months.

I confess I am not super hi tech, so I am not proficient with a Gopro so I probably missed out on making the best films. However, I did get some excellent photos and some good photos of some impressive sharks.  Thanks to technology I will be able to create slide shows to my K-12 students so they can see the experience through my eyes.  I am looking forward to showing these slide shows to my students. My elementary students were so excited to have me back that they made me feel like a celebrity.  I was gone a little over two weeks and to my younger students it seemed forever.  Many of the teachers shared some of my trip with the students so they would know where I was and what I was doing.

I am settled back into my regular schedule at school. One awesome thing about my job is that I deal with students from kindergarten through seniors.   I started back with my elementary students yesterday.  Let me just say that young people can make you feel like a Rockstar when you have been gone for 15 days.  I knocked on a classroom door and could hear the students yelling “ she’s here! Mrs. Grady is here!” and then there were the hugs. Young kids are so genuine and they have an excitement and love of learning.  I have to get busy on my power point to share with them.  They wanted a list of sharks we caught, how big they were, etc.  I am getting exactly what I hoped, the students want to understand what I did on the ship, why we did these things and what did I actually learn.

For my last blog, I have decided to share some of my favorite photos from my time on the Oregon II.

This slideshow requires JavaScript.