Leah Johnson: Almost Time to Sail, July 7, 2015

NOAA Teacher At Sea
Leah Johnson
Soon Aboard NOAA Ship Pisces
July 21 – August 3, 2015

Mission: Southeast Fishery – Independent Survey
Geographical Area of Cruise: Atlantic Ocean, Southeastern U.S. Coast
Date: July 7, 2015

Personal Log

About Me

I am a science teacher at Naperville Central High School in Naperville, IL. My background is primarily in Earth Science, but I enjoy learning and teaching in all areas of science. Currently, I teach Principles of Biology and Chemistry to freshmen and sophomores, and two elective courses – Weather and Environment and Physical Geology – to juniors and seniors. I work with amazing people who are invested in science education and outreach, and they are very supportive of my upcoming adventure at sea!

Outside of my career in science and education, I love painting, reading, traveling, horseback riding, and biking. I am lucky to be married to someone who shares many of my interests, and we have a couple awesome huskies, too!

Why Teacher At Sea?

I have always been fascinated with the ocean. I have spent many vacation hours snorkeling in Florida, Hawaii, and the Bahamas, and exploring tide pools along the Pacific Northwest coast. When I am home in the Midwest, I can often be found with my nose in a book about deep sea fish, or watching ocean documentaries. I heard about NOAA’s Teacher At Sea Program several years ago as a graduate student, and decided to apply during my second year of teaching high school. To my surprise and delight, I was admitted to the program. I am grateful for this opportunity to learn more about ocean life, and to share this hands-on experience with my students and others who are curious about marine life, careers at sea, and what it’s like to live on a boat for two weeks!

Enjoying the California Coast

Enjoying the California Coast

Assignment: Fisheries

On Monday, July 20, I will fly to North Carolina and meet up with the crew of NOAA ship Pisces. We will embark from Morehead City on July 21 and sail along the outer banks of the Carolinas. The purpose of this cruise is to monitor fisheries in the Southeastern waters of the U.S. We will be counting and measuring nearly all of the reef fish that are caught in traps, and determining the age and gender of a select number of fish. Underwater cameras will be used in addition to traps to establish a better survey of the local fish populations. I am very excited to participate in this research, and learn from a group of dedicated and highly-experienced individuals who have established careers in ocean science and sailing.

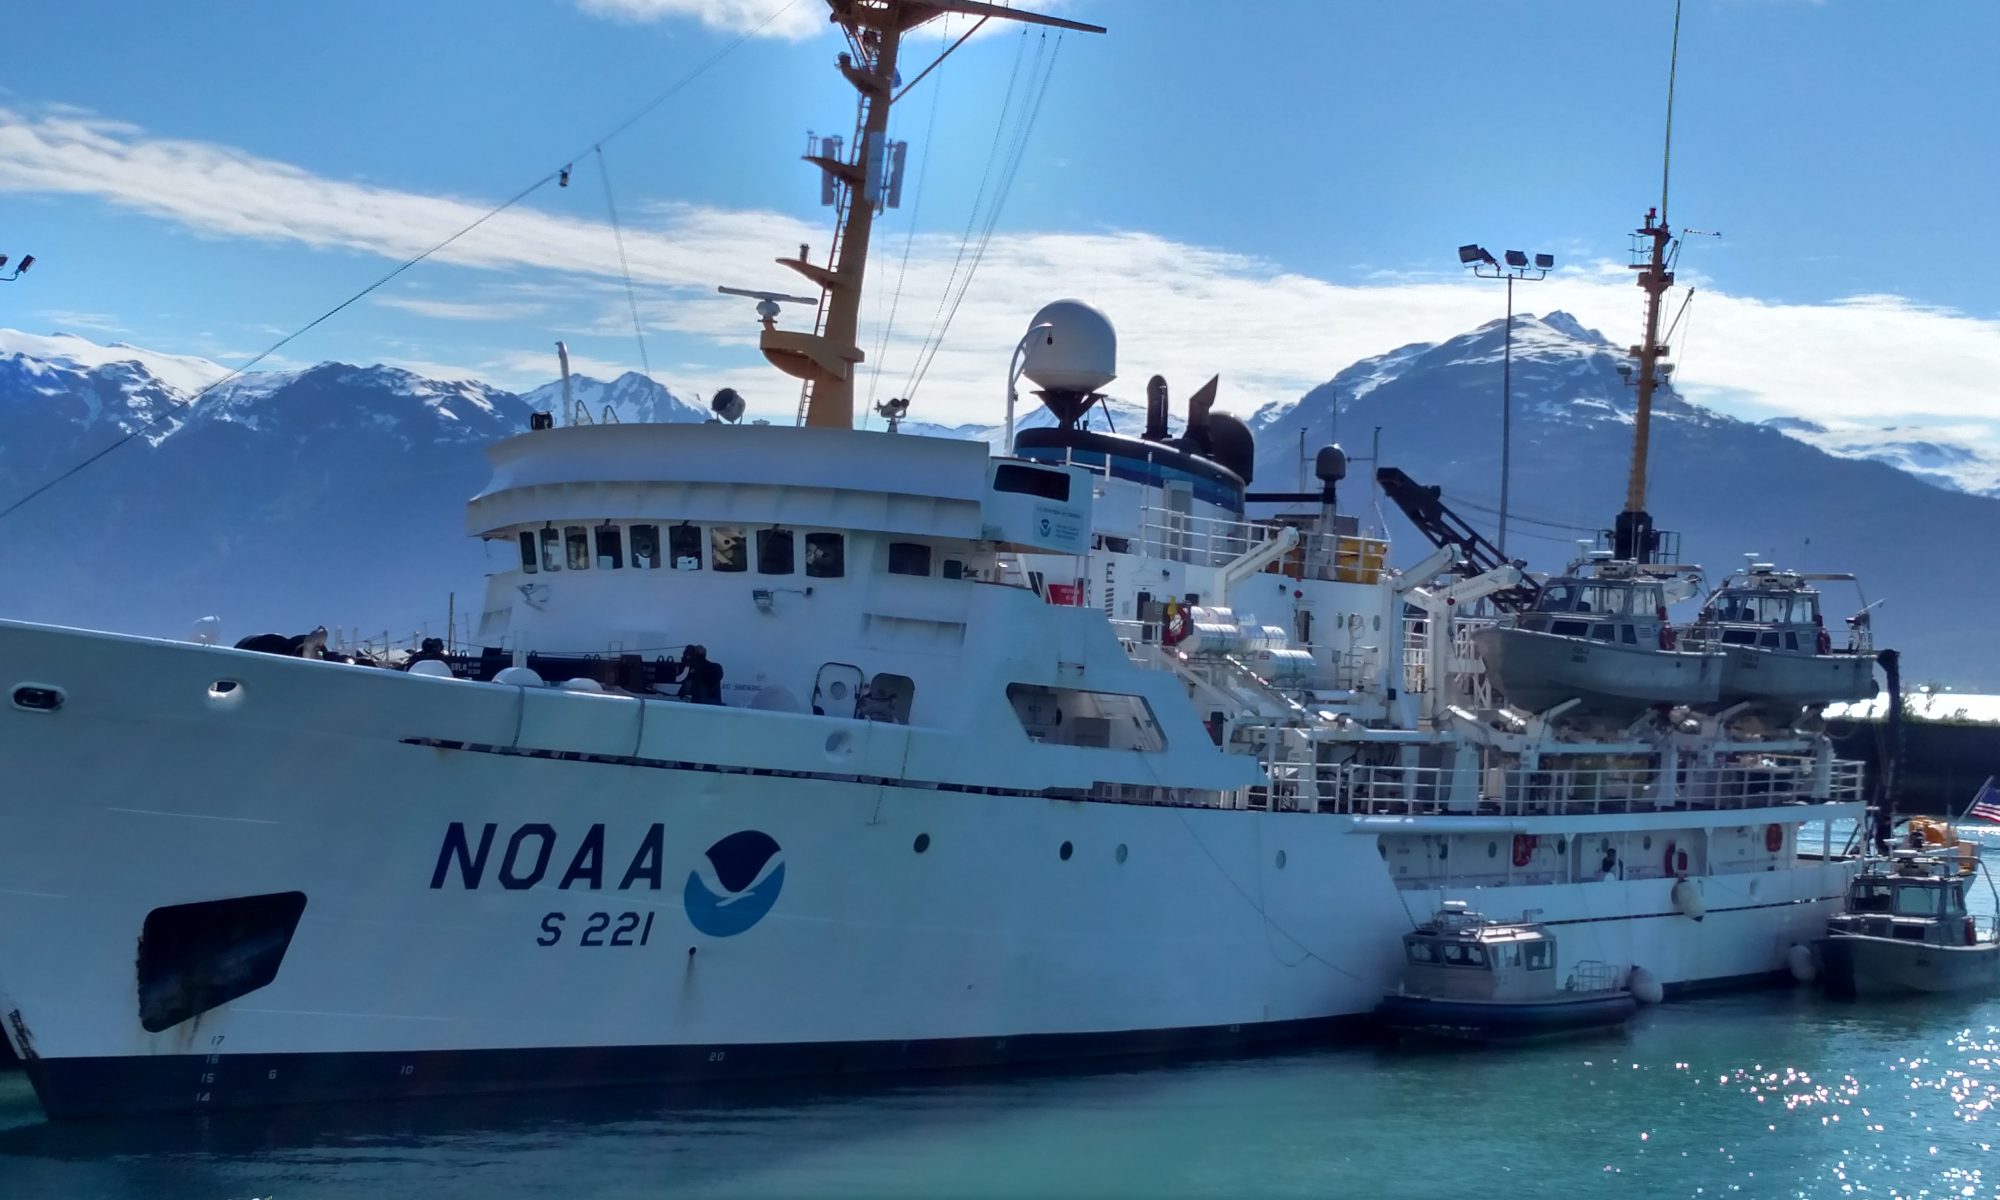
NOAA Ship Pisces, Photo courtesy of NOAA

NOAA Ship Pisces, Photo courtesy of NOAA

Sharing the Experience

When I write my next post, I will be in the Atlantic Ocean. I am looking forward to sharing my experiences with you, and I will do my best to answer any questions you have. Communication is critical to science outreach, so please come along for the ride by checking out my posts and the blogs of other Teachers At Sea who have documented their fascinating ocean adventures as well. Thanks for reading!

 Did You Know?

The Atlantic Ocean is the second-largest ocean on Earth, covering about 41,105,000 square miles. This area makes up nearly 20% of Earth’s surface!

Source: NOAA

Heidi Wigman: Fisheries Sciences, June 8, 2015

NOAA Teacher at Sea
Heidi Wigman
Aboard NOAA Ship Pisces
May 27 – June 10, 2015

Mission: Reef Fish Survey
Geographical area of cruise: Gulf of Mexico (24°29.956’N 083°320.601’W)
Date: June 8, 2015

Weather: 83° @ surface, E-SE winds @ 10-15 knots, seas 2-3 ft, average depth 123m

Science and Technology Log:

NOAA’s mission is three-fold: science, service, and stewardship.  By utilizing fisheries, hydrographic, and oceanographic scientists in the field, NOAA’s goal is to understand and predict changes in climate, weather, oceans, and coasts, while also putting forth a conservation effort towards coastal and marine ecosystems. This knowledge is shared with businesses, communities, and people, to inform on how to make good choices to protect our fragile earth.

sunset on the Gulf
Sunset on the Gulf
sunrise
Sunrise on the Gulf

The specific mission, for our current voyage, on the Pisces, is to survey fisheries at pre-determined sites throughout the Western portion of the Gulf of Mexico. The data from these surveys will be brought back to the lab in Pascagoula, Miss. and analyzed. Then determinations will be made for future surveys and studies. According to Chief Scientist, Brandi Noble, “These fishery independent surveys increase our knowledge of natural reefs in the Gulf of Mexico. We get a better picture of what’s down there and work with outside agencies to determine how to maintain the health of the fisheries.  Data gathered will be used in future stock assessments for the Gulf of Mexico.”

DSC_1071
Bottlenose dolphins in the Gulf

The methods used to gather data on this cruise are through the use of the camera array and the bandit reels.  The camera arrays are deployed at sites that have been mapped and sit at the bottom for a total soak time of 40 minutes.  This footage is analyzed and processed by scientists to determine what the conditions of the reef are and the species of fish present in the area and their abundance.  This gives a partial picture, but to get a complete and accurate report, fish need to be studied more closely.  The “Bandit Reels” provide a more hands-on approach and allow the scientists to get data on sex, maturity stage, and age of species.  Some of the fish are released after some initial measurements, but the commercially important species are dissected and samples are taken for further lab analysis.  Initial measurements made with anything brought aboard include total length (TL), fork length (FL), standard length, SL (from nose to caudal fin), and weight.

Removing the otolith to determine the age of the fish
removing organs to determine sex and maturity
Removing organs to determine sex and maturity

A closer look at the data allows scientists to make predictions on fish populations and growth over time.  Some of the data we got on this trip were for the Lutjanus campechanus (red snapper) and for the Pagrus pagrus (red porgy).

sheet1
Lutjanus campechanus “Red Snapper”
sheet2
Pagrus pagrus “Red Porgy”

There are several ways to disaggregate the data to determine differences and similarities based on region, time, species, etc.  For our purposes, we’ll make some observations involving probability, proportion, and statistics.

Math Problem of the day: You are a scientist and have brought data back from the Gulf of Mexico to analyze in your lab.  You have three tasks: a) to get an average fish size based on weight (species specific) b)  to determine what the proportion is of the Standard Length to the Total Length of each species (hint: ratio of SL/TL; find average) c) determine the theoretical probabilities that the next Red Snapper will be  >1,100g, and that the next red Porgy will be <1,000g (hint: how many times does this happen out of the total catches?)

Coming Soon . . . Meet some of the crew behind the Pisces

Previous Answers:

Trigonometry of Navigation post: 18 m/s @ 34°SE

Bandit Reels post: about 14.6 nautical miles

The STEM of Mapping post: layback = 218m, layback w/ catenary = 207m

Underwater Acoustics: about 163 sq. meters

SCUBA Science: letter group A

Heidi Wigman: The Science of SCUBA, June 5, 2015

NOAA Teacher at Sea
Heidi Wigman
Aboard NOAA Ship Pisces
May 27 – June 10, 2015

Mission: Reef Fish Survey
Geographical area of cruise: Gulf of Mexico (25°32.388’N 083°38.787’W)
Date: June 5, 2015

Weather: 82° @ surface, NE winds @ 5-10 knots, seas 0-2 ft, chance of showers and Tstorms, average depth 77m

Science and Technology Log:

I first got my Open Water SCUBA certification in Santa Monica, CA at about 14 years old.  My dad and I would explore the waters off of Avalon on Catalina Island, and some offshore sites in Southern California.  As a freshman in college, I made my way up through PADI’s advanced course and into my certification as a PADI Rescue Diver.  Along the way, I had the chance to do several deep dives (depths below 100′), wreck dives, night dives, drift dives – it was an amazing experience.  Later in life, I had the chance to actually work underwater, and would spend 3-4 hours below the surface each day. No matter where I was sent, and what the visibility was (sometimes nil) I felt like I was in my element.  During the Reef Fish Survey cruise, we are not doing any dive operations, but I thought that it would be a good opportunity to look at some of NOAA’s dive missions and some of the science and math behind SCUBA.

NOAA marine archaeologist diving at the wreck of the USS Montana
NOAA marine archaeologist diving at the wreck of the USS Montana (photo: NOAA Ocean Explorer)

The use of scientific and research diving has been performed since 1952, with the invention of the Self-Contained, Underwater Breathing Apparatus (SCUBA).  Underwater operations have led to significant discoveries in marine science and beyond.  Some of the specific types of dives performed by NOAA are biological surveys and sampling, shellfish studies, botanical sampling, geological mapping, deployment, inspection, maintenance, and recovery of instruments, and archaeological site documentation and excavation.

NOAA research diver surveying the USS Monitor (photo: NOAA)

Understanding the basic physics behind diving can help to guide a diver to make smart choices, and stay safe. Anyone that has plunged below the surface a few feet, has felt the pressure that is exerted on them; generally with a discomfort in the middle ear.  With diving, you not only have to deal with the atmospheric pressure, but hydrostatic pressure (pressure due to the weight of water), water density, temperature, buoyancy, and gas laws. During SCUBA diving, the body’s tissues absorb additional Nitrogen from air breathed under pressure.  Excess Nitrogen will remain in these tissues for a period of time depending on depth and duration of dive. Lucky for divers, the U.S. Navy developed a set of dive tables that can be used to determine safety limits with dive times, in order to account for decreasing the amount of Nitrogen in the body, and avoiding dive related traumas.  With our ever-increasing reliance on technology, it is important to have a working knowledge of dive table usage as well.

NOAA No-Decompression Dive Tables
{Fig. A} NOAA No-Decompression Dive Tables

*This lesson is to give a general and basic understanding of dive tables, NOT to instruct on the usage for purposes of diving

The idea behind dive tables is to use the maximum depth of a dive (even it is only momentarily), and determine the ABT (Actual Bottom Time); and in the case of a repetitive dive, the amount of surface time in order to release the residual Nitrogen from the body.  Keep in mind, ABT refers to the start time of the diver’s descent and ends when the diver begins a direct, uninterrupted ascent to the surface.

Let’s look at a scenarios for determining ABT for a diver that is only planning one dive in a 12-hour period:

Your dive team must recover a sampling device located in a bay, whose depth does not exceed 53ft.  At this depth, how long do you have to search for and recover the device without exceeding the U.S. Navy No-Decompression Limits?

{Fig. B} Chart 1 – used to find ABT at depth

[Answer: {Fig.B} if you round up to the depth of 55 ft, the team can stay under for 74min., any longer would require a decompression stop on ascent]

What if you want to go on a second dive later in the day? This is where you will look at the Letter Group Designation for a surface interval, based on the ABT at a certain depth.

At 10:13 am, dive team Alpha descends to conduct an inspection of their research vessel.  During the inspection, they accidentally drop a dive light.  The vessel is at anchor and the hard, sandy bottom is only 47ft deep, and the water is relatively clear. The divers recover the light, and complete their inspection. They begin their ascent at 10:52.  What is the Letter Group at the end of the dive? [Answer: {Fig.C} – Repetitive Group Designation is F].

{Fig. B} Chart 1-2
{Fig. C} Chart 1-2 – used to find surface interval

By Following column F {Fig. D}, you can see the times (represented in hours:minutes) to help plan surface interval for your following dive. So if you rested for 2hrs 45min after your first dive, and were planning a 60 depth on your second dive, you would have to plan for 41 minutes of ABT.

chart3
{Fig.D} Chart2-3 – moving from surface interval time to planning dive #2

Math Question of the Day: By using {Fig. A} the No-Compression Dive Table, try to figure out the following scenario:

Dive team Bravo plans to make an afternoon dive to complete the aquatic life census they started in the morning.  The diver’s surfaced from their first dive at 9:57 am, and determined that, following this dive, their Repetitive Group Designation (Letter Group) was E.  They anticipate re-entering the water at approximately 3:00pm.  What will their Letter Group be at the beginning of this next dive?

Previous Answers:

Trigonometry of Navigation post: 18 m/s @ 34°SE

Bandit Reels post: about 14.6 nautical miles

The STEM of Mapping post: layback = 218m, layback w/ catenary = 207m

Underwater Acoustics: about 163 sq. meters

Coming Soon . . . Fisheries Science

Heidi Wigman: Underwater Acoustics, June 4, 2015

NOAA Teacher at Sea
Heidi Wigman
Aboard NOAA Ship Pisces
May 27 – June 10, 2015


Mission: Reef Fish Survey
Geographical area of cruise: Gulf of Mexico (26°33.512’N 083°43.064’W)
Date: June 4, 2015

Weather: 82° @ surface, NE winds @ 5-10 knots, seas 0-2 ft, chance of showers and Tstorms, average depth 75m

Science and Technology Log:

The science behind underwater acoustics play a huge role in the operations of the Pisces.  Each of the five survey types (CTD, camera rig, sidescan, bandit reels and AUV) need accurate data about the depth and contours of the ocean floor.  Most people are familiar with the idea of how radar sends out a “ping” and waits for a return in order to determine a distance of an object.  This is not a new, or even a human invented design — bats, dolphins, and some whale classes use “echo location” to get information on food sources and predators.  As a pulse is emitted from the transmission source, it travels through the water at a certain speed, and as it encounters objects, returns as an echo.

ping transmit and return
“ping” transmit and return provided by C. Thompson

 As data is received, it can be read as a function of voltage output to time in seconds, but this type of information generally is not useful for operational purposes.  This two-way travel data needs to be converted to provide a graphical representation of the contour of the ocean floor, and the location of objects in the water. An algorithm turns all of this into usable data, that gives the viewer a depiction of what is under the vessel, and at what depth.

sonar imagery provided by Charles Thompson
sonar imagery provided by C. Thompson
echosounder depth measurement, provided by C. Thompson

In order to get depth (Z), you need to know about how fast sound travels (c) – and this can vary with environmental factors such as temperature, salinity, depth, turbidity, etc. The third variable is the time (t) in seconds that it takes from ping to return. The formula that is used to calculate the depth is Z = c*t/2.

speed of sound graphDuring our cruise, the sound speed value we are using (1540 m/sec) is the mean value of the measured sound speed vs. depth profile, with slight margin of error on the minimum values.  Therefore, any miscalculations based on the constant will provide a reading more shallow, rather than more depth.

The EK60 echosounder emits a frequency of 18kHz, with most of the power in an 11° conic sector directed downward(see diagram).  In order to find the area covered by the pulse, we first need to find the diameter (d) and the vertical depth (Z) or the max beam range (R).

sonar effective area; provided by C. Thompson

Math question of the day: What is the area covered by one sonar ping from the Pisces? If you know that your vertical depth is 75m, and the bisect on the beamwidth (11°) angle, use some trigonometry to help find your radius. [Tan 5.5 = r/75].  Once you have the value of r, use the formula for area [A=3.14(r*r)]

Previous Answers:

Trigonometry of Navigation post: 18 m/s @ 34°SE

Bandit Reels post: about 14.6 nautical miles

The STEM of Mapping post: layback = 218m, layback w/ catenary = 207m

Coming soon . . . A trip underwater – A closer look at NOAA dive tables

Heidi Wigman: The Trigonometry of Navigation, May 29, 2015

NOAA Teacher at Sea
Heidi Wigman
Aboard NOAA Ship Pisces
May 27 – June 10, 2015


Mission: Reef Fish Surveys on the U.S. Continental Shelf
Geographical Area of Cruise: Gulf of Mexico (29°30.456’N  87°47.246’W)
Date: May 29, 2015

Weather: 80°, wind SE @ 8-13 knots , 95% precipitation, waves 2-3 @ 3 sec.

Science and Technology Log

During my time aboard the Pisces, I wanted to focus on the use of mathematics in the day-to-day shipboard operations, and during science ops.  I have been lucky to find math everywhere – even down to the amount of pressure it takes to open a water-safe door (which is a lot).  As the officers navigate the Pisces through the Gulf of Mexico, special attention needs to be on the vast number on oil rigs in the area, as well as getting the scientists to the designated drop points.  As a course is charted through the water, environmental effects (current and wind) can alter its final outcome.  Basically, this is where trigonometry comes in to play – a real-life application, and answer, to the notorious “when am I ever going to use this?”

Suppose that the Pisces is traveling at a cruising speed of 15 m/sec, due East, to get to the spot of deployment for a camera rig.  The ocean current is traveling in a Southern direction at 10 m/sec.  These values are the “component vectors” that, when added, are going to give a resultant vector, and will have both magnitude and direction.  If you think of the two forces acting upon each other as the legs of a right triangle, and the resultant vector as the hypotenuse, then using the Pythagorean Theorem will allow you to compute the resultant velocity.  Use a trig function (invTAN) to find the angle at which the Pisces needs to travel to get to its drop point. 

Personal Log

Time goes by slowly at sea – and that’s a good thing for me! I miss my family and friends, but this is an experience that I am enjoying each minute of. Thanks Pisces crew for being awesome!

Coming next . . . Bandit Reels, CTDs and AUVs – oh my!

am shift (0400-0800) plotting our course
AM watch (0400-0800) plotting our course
DSC_1027
Pisces cruising the Gulf of Mexico
navigation tools of the trade
Navigation tools of the trade