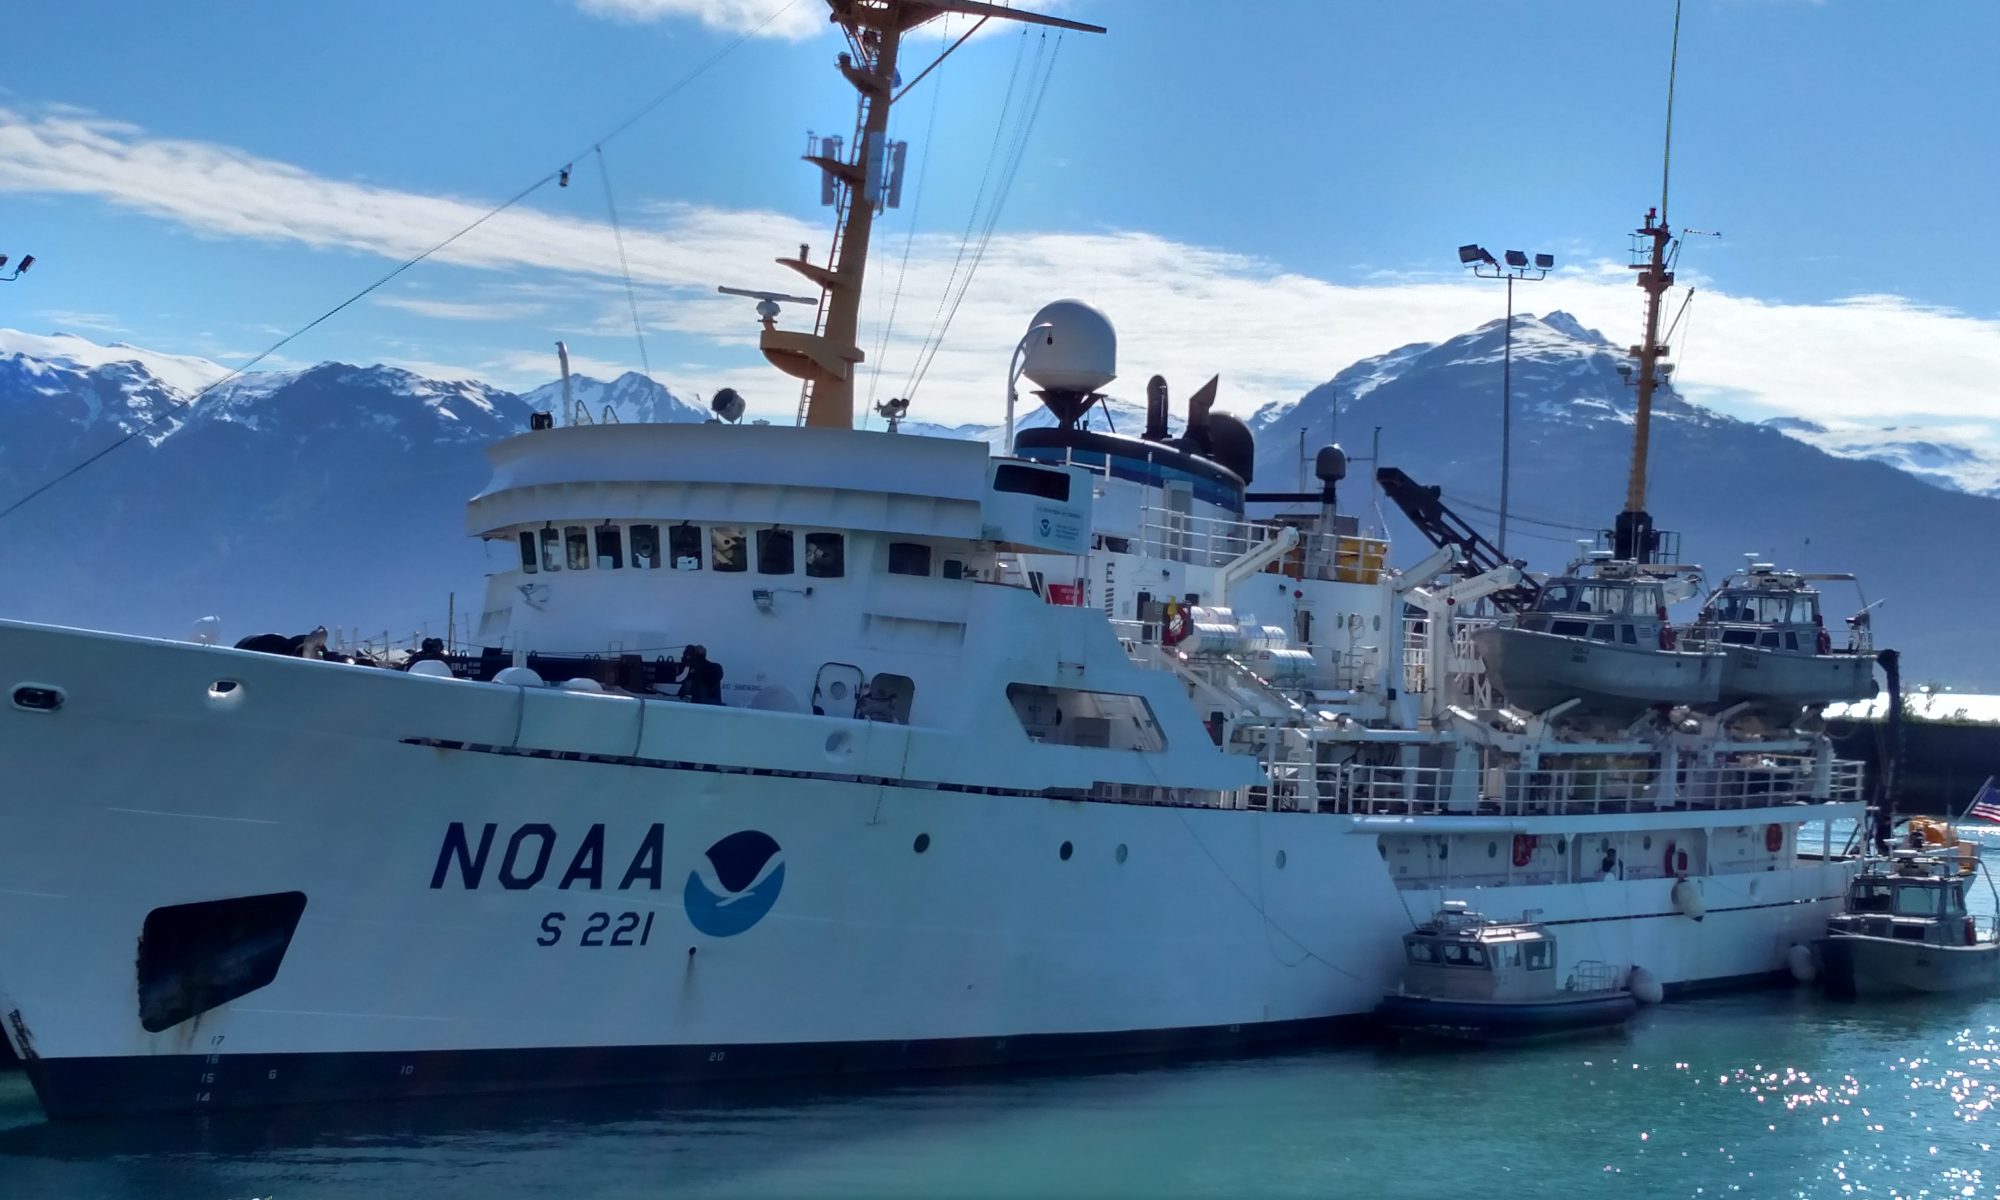
Lauren Wilmoth: Shore Party, October 12, 2014

NOAA Teacher at Sea
Lauren Wilmoth
Aboard NOAA Ship Rainier
October 4 – 17, 2014

Mission: Hydrographic Survey
Geographical area of cruise: Kodiak Island, Alaska
Date: Sunday, October 12, 2014

Weather Data from the Bridge
Air Temperature: 1.92 °C
Wind Speed: 13 knots
Latitude: 58°00.411′ N
Longitude: 153°10.035′ W

Science and Technology Log

The top part of a tidal station.  In the plastic box is a computer and the pressure gauge.
The top part of a tidal station. In the plastic box is a computer and the pressure gauge.

In a previous post, I discussed how the multibeam sonar data has to be corrected for tides, but where does the tide data come from?  Yesterday, I learned first hand where this data comes from.  Rainier‘s crew sets up temporary tidal stations that monitor the tides continuously for at least 30 days.  If we were working somewhere where there were permanent tidal station, we could just use the data from the permanent stations.  For example, the Atlantic coast has many more permanent tidal stations than the places in Alaska where Rainier works.  Since we are in a more remote area, these gauges must be installed before sonar data is collected in an area.

We are returning to an area where the majority of the hydrographic data was collected several weeks ago, so I didn’t get to see a full tidal station install, but I did go with the shore party to determine whether or not the tidal station was still in working condition.

A tidal station consists of several parts: 1) an underwater orifice 2) tube running nitrogen gas to the orifice 3) a nitrogen tank 4) a tidal gauge (pressure sensor and computer to record data) 5) solar panel 6) a satellite antennae.

Let me explain how these things work.  Nitrogen is bubbled into the orifice through the tubing.  The pressure gauge that is located on land in a weatherproof box with a laptop computer is recording how much pressure is required to push those bubbles out of the orifice.  Basically, if the water is deep (high tide) there will be greater water pressure, so it will require more pressure to push bubbles out of the orifice.  Using this pressure measurement, we can determine the level of the tide.  Additionally, the solar panel powers the whole setup, and the satellite antennae transmits the data to the ship.  For more information on the particulars of tidal stations click here

Tidal station set-up.  Drawing courtesy of Katrina Poremba.
Tidal station set-up. Drawing courtesy of Katrina Poremba.
Rainier is in good hands.

The tidal station in Terror Bay did need some repairs.  The orifice was still in place which is very good news, because reinstalling the orifice would have required divers.  However, the tidal gauge needed to be replaced.  Some of the equipment was submerged at one point and a bear pooped on the solar panel.  No joke!

After the tidal gauge was installed, we had to confirm that the orifice hadn’t shifted.  To do this, we take manual readings of the tide using a staff that the crew set-up during installation of the tidal station.  To take manual (staff) observations, you just measure and record the water level every 6 minutes.   If the manual (staff) observations match the readings we are getting from the tidal gauge, then the orifice is likely in the correct spot.

Just to be sure that the staff didn’t shift, we also use a level to compare the location of the staff to the location of 5 known tidal benchmarks that were set when the station was being set up as well.  As you can see, accounting for the tides is a complex process with multiple checks and double checks in place.  These checks may seem a bit much, but a lot of shifting and movement can occur in these areas.  Plus, these checks are the best way to ensure our data is accurate.

Micki and Adam setting up the staff, so they can make sure it hasn't moved.
ENS Micki and LTJG Adam setting up the staff, so the surveyor can make sure it hasn’t moved.
Mussels and barnacles on a rock in Terror Bay.
Leveling to ensure staff and tidal benchmarks haven't moved.
Leveling to ensure staff and tidal benchmarks haven’t moved.


Today, I went to shore again to a different area called Driver Bay.  This time we were taking down the equipment from a tidal gauge, because Rainier is quickly approaching the end of her 2014 season.  Driver Bay is a beautiful location, but the weather wasn’t quite as pretty as the location.  It snowed on our way in!  Junior Officer Micki Ream who has been doing this for a few years said this was the first time she’d experienced snow while going on a tidal launch.  Because of the wave action, this is a very dynamic area which means it changes a lot.

In fact, the staff that had been originally used to manually measure tides was completely gone, so we just needed to take down the tidal gauges, satellite antenna, solar panels, and orifice tubing.  The orifice itself was to be removed later by a dive team, because it is under water.  After completing the tidal gauge breakdown, we hopped back on the boat for a very bumpy ride back to Rainier.  I got a little water in my boots when I was hopping back aboard the smaller boat, but it wasn’t as cold as I had expected.  Fortunately, the boat has washers and driers.  It looks like tonight will be laundry night.

Raspberry Bay
Driver Bay

Personal Log 

The food here is great!  Last night we had spaghetti and meatballs, and they were phenomenal.  Every morning I get eggs cooked to order.  On top of that, there is dessert for every lunch and dinner!  Don’t judge me if I come back 10 lbs. heavier.  Another cool perk is that we get to see movies that are still in the theaters!  They order two movies a night that we can choose from.  Lastly, I haven’t gotten seasick.  Our transit from Seward to Kodiak was wavy, but I don’t think it was as bad as we were expecting.  The motion sickness medicines did the trick, because I didn’t feel sick at all.

Did You Know? 

NOAA (National Oceanic and Atmospheric Administration) contains several different branches including the National Weather Service which is responsible for forecasting weather and issuing weather alerts.

Animal Spotting

There are sea otters everywhere!

Sea otter (Enhydra lutris) sighting.


Gregory Cook, The Dance, August 7, 2014

NOAA Teacher at Sea

Gregory Cook

Aboard NOAA Ship Oscar Dyson

July 26 – August 13, 2014

Mission: Annual Walleye Pollock Survey

Geographical Area: Bering Sea

Date: August 7, 2014

Science and Technology Log: Abiotic Factors in the Bering Sea

Ecosystems are made up of biotic and abiotic factors. Biotic is just another word for “stuff that is, or was, alive.” In a forest, that would include everything from Owl to Oak Tree, from bear to bacteria, and from fish to fungi. It includes anything alive, or, for that matter, dead. Keep in mind that “dead” is not the same as “non-living.”

Salmon and Black-Legged Kittiwake
The salmon and the black-legged kittiwake are both biotic members of the sub-arctic ecosystem.

“Non-living” describes things that are not, cannot, and never will be “alive.” These things are referred to as “abiotic.” (The prefix a- basically means the same as non-). Rocks, water, wind, sunlight and temperature are all considered abiotic factors. And while the most obvious threat to a salmon swimming up river might be the slash of a bear’s mighty claw, warm water could be even more deadly. Warm water carries less dissolved oxygen for the fish to absorb through their gills. This means that a power plant or factory that releases warm water into a river could actually cause fish to suffocate and, well, drown.

Bering Panorama
A 90 degree panorama of the Bering Sea from atop the Oscar Dyson. I’d show you the other 270°, but it’s pretty much the same. The sea and sky are abiotic parts of the sub-arctic ecosystem.

Fish in the Bering Sea have the same kind of challenges. Like Goldilocks, Pollock are always looking for sea water that is just right. The Oscar Dyson has the tools for testing all sorts of Abiotic factors. This is the Conductivity Temperature Depth sensor (Also known as the CTD).

CTD Deployment
Survey Technicians Allen and Bill teach me how to launch The Conductivity Temperature Depth Probe (or CTD).

The CTD sends signals up to computers in the cave to explain all sorts of abiotic conditions in the water column. It can measure how salty the water is by testing how well the water conducts electricity. It can tell you how cloudy, or turbid, the water is with a turbidity sensor. It can even tell you things like the amount of oxygen dissolved in the ocean.

To see how abiotic factors drive biotic factors, take a look at this.

Thermocline
The graph above is depth-oriented. The further down you go on the graph, the deeper in the water column you are. The blue line represents temperature. Does the temperature stay constant? Where does it change?

I know, you may want to turn the graph above on its side… but don’t. You’ll notice that depth is on the y-axis (left). That means that the further down you are on the graph, the deeper in the sea you are. The blue line represents the water temperature at that depth. Where do you see the temperature drop?


Right… The temperature drops rapidly between about 20 and 35 meters. This part of the water column is called the Thermocline, and you’ll find it in much of the world’s oceans. It’s essentially where the temperature between surface waters (which are heated by the sun) and the deeper waters (typically dark and cold) mix together.

OK, so you’re like “great. So what? Water gets colder. Big deal… let’s throw a parade for science.”

Well, look at the graph to the right. It was made from another kind of data recorded by the CTD.

Fluoresence
Fluoresence: Another depth-oriented graph from the CTD… the green line effectively shows us the amount of phytoplankton in the water column, based on depth.

The green line represents the amount of fluorescence. Fluorescence is a marker of phytoplankton. Phytoplankton are plant-like protists… the great producers of the sea! The more fluorescence, the more phytoplankton you have. Phytoplankton love to live right at the bottom of the thermocline. It gives them the best of both worlds: sunlight from above and nutrients from the bottom of the sea, which so many animals call home.

Now, if you’re a fish… especially a vegetarian fish, you just said: “Dinner? I’m listening…” But there’s an added bonus.

Look at this:

CTD Oxygen
Oxygen data from the CTD! This shows where the most dissolved oxygen is in the water column, based on depth. Notice any connections to the other graphs?

That orange line represents the amount of oxygen dissolved in the water. How does that compare to the other graphs?

Yup! The phytoplankton is hanging down there at the bottom of the thermocline cranking out oxygen! What a fine place to be a fish! Dinner and plenty of fresh air to breathe! So here, the abiotic (the temperature) drives the biotic (phytoplankton) which then drives the abiotic again (oxygen). This dance between biotic and abiotic plays out throughout earth’s ecosystems.

Another major abiotic factor is the depth of the ocean floor. Deep areas, also known as abyss, or abyssal plains, have food sources that are so far below the surface that phytoplankton can’t take advantage of the ground nutrients. Bad for phytoplankton is, of course, bad for fish. Look at this:

The Cliff and the Cod
The blue cloud represents a last grouping of fish as the continental shelf drops into the deep. Dr. Mikhail examines a cod.

That sloping red line is the profile (side view of the shape of the land) of the ocean floor. Those blue dots on the slope are fish. As Dr. Mikhail Stepanenko, a visiting Pollock specialist from Vladivostok, Russia, puts it, “after this… no more Pollock. It’s too deep.”

He goes on to show me how Pollock in the Bering Sea are only found on the continental shelf between the Aleutian Islands and Northeastern Russia. Young Pollock start their lives down near the Aleutians to the southeast, then migrate Northwest towards Russia, where lots of food is waiting for them.

Pollock Distribution
Alaskan Pollock avoid the deep! Purple line represents the ocean floor right before it drops off into the Aleutian Basin… a very deep place!

The purple line drawn in represents the drop-off you saw above… right before the deep zone. Pollock tend to stay in the shallow areas above it… where the eating is good!

Once again, the dance between the abiotic and the biotic create an ecosystem. Over the abyss, Phytoplankton can’t take advantage of nutrients from the deep, and fish can’t take advantage of the phytoplankton. Nonliving aspects have a MASSIVE impact on all the organisms in an ecosystem.

Next time we explore the Biotic side of things… the Sub-arctic food web!

Personal Log: The Order of the Monkey’s Fist.

Sweet William, a retired police officer turned ship’s engineer, tells the story of the order of the monkey’s fist.

William and the Monkey's Fist
Sweet William the Engineer shows off a monkey’s fist

The story goes that some island came up with a clever way to catch monkeys. They’d place a piece of fruit in a jar just barely big enough for the fruit to fit through and then leave the jar out for the monkeys. When a monkey saw it, they’d reach their hand in to grab the fruit, but couldn’t pull it out because their hands were too big now that they had the fruit in it. The monkey, so attached to the idea of an “easy” meal wouldn’t let go, making them easy pickings for the islanders. The Monkey’s Fist became a symbol for how clinging to our desires for some things can, in the end, do more harm than good. That sometimes letting go of something we want so badly is, in the end, what can grant us relief.

Another story of the origin of the monkey’s fist goes like this: A sea captain saw a sailor on the beach sharing his meal with a monkey. Without skipping a beat, the monkey went into the jungle and brought the sailor some of HIS meal… a piece of fruit.

No man is an Island. Mt. Ballyhoo, Unalaska, AK

Whatever the true origin of the Order is, the message is the same. Generosity beats selfishness at sea. It’s often better to let go of your own interests, sometimes, and think of someone else’s. Onboard the Oscar Dyson, when we see someone committing an act of kindness, we put their name in a box. Every now and then they pull a name from the box, and that person wins something at the ship store… a hat or a t-shirt or what have you. Of course, that’s not the point. The point is that NOAA sailors… scientists, corps, and crew… have each other’s backs. They look out for each other in a place where all they really have IS each other.

And that’s a beautiful thing.

Kimberly Gogan: A Ship Full of Science! April 9, 2014

NOAA Teacher at Sea
Kim Gogan
Aboard NOAA Ship Gordon Gunter
April 7 – May 1, 2014

Mission: AMAPPS & Turtle Abundance Survey,  Ecosystem Monitoring
Geographical area of cruise:  North Atlantic Ocean
Date: Wednesday, April 9th

Weather Data from the Bridge
Air Temp: 5.5 Degrees Celsius
Wind Speed: 9.0 Knots
Water Temp: 4.6 Degrees Celsius
ater Depth: 41.2 Meters

The Science Teams (Photo Credit to Mark Weekley)
The Science Teams – Photo by Mark Weekly

Science and Technology Log

If Science at Sea is what I wanted, this is the ship for it!  The evening of our departure from Newport, R.I. on Monday, April 7th, the group of scientists met in the staff lounge for a meeting of the minds. I soon found out that there was an array of scientist on the ship all with different goals and science they wanted to conduct. On this ship we have two teams of Oceanographers, a day team and a night team. The Oceanographers are generally taking underwater tests and samples using a variety of equipment. We also have the Marine Mammal Observer Team who are on the look out for any sort of mammals that may poke head out of the water such as whales and dolphins.

There is also a group of Birders collecting data on any bird sightings. And lastly we have our Acoustics, or sound team, that is listening for the sounds of marine mammals. I also learned at that meeting that it would take a lot of teamwork and collaboration on the part of each of the Scientist crews, as well as the NOAA Corps and crew to make it all happen.

Every day the representatives from each team have to get together to coordinate the timing of each of the events that will happen throughout the day. The Mammal and Birding Observer teams are on the same schedule and can collect sighting data throughout the day from 7 AM to 7 PM, only stopping for lunch, as they need daylight to conduct their work. The daytime Oceanographers plan their work of collecting samples around the observer teams, sending off their collection equipment before 7AM, at lunch, and then again at 7PM when the observers teams are done. The nighttime Oceanographers are not working during the same time as other scientists so this gives them the opportunity to to do as many test and collections as they can without interrupting anyone else’s work. The Acoustic team can work anytime of day or during any kind of weather without conflicting with anyone as long as the water is deep enough to drop their equipment. It sounds like an easy schedule but there are many things, like weather, technology and location, that could disrupt this carefully orchestrated schedule of science. When that happens, and it has, everyone must be flexible and work together to make sure everyone can conduct the science they need.

Me helping to bring the Bongo net back onto the ship for cleaning. (Photo credit Chris)
Me helping to bring the Bongo net back onto the ship for cleaning. – Photo by Chris Tremblay
Jerry Prezioso tying the bottom of the Bongo nets getting them really to be put in the water.
Scientist Jerry Prezioso tying the bottom of the Bong nets getting them really to be put in the water.

Science Spotlight

Since there is so much science happening on the ship that I am doing every day, I am going to have to share just one thing at a time or I would be writing for hours! Today’s science spotlight is about scientist Jerry Prezioso and the Bongo nets. Jerry is an Oceanographer who works at the NOAA Lab in Narragansett, R.I. Jerry primarily studies plankton distribution. He has been on many trips on NOAA ships since he was 18!

Today Jerry taught me how to do a Bongo net sample that is used to collect plankton from the various water columns. At the top of the net there is a piece of equipment called a CTD (Conductivity Temperature & Depth Unit) that communicates with the computers in the lab on the ship. The scientists in the lab use that piece of equipment to detect how far down the net is going and when it is close to the bottom, as well as collect data on the water temperature and salinity.

Once the CTD is set and turned on, the Bongo net can be lowered into the water. The nets have weights on them to sink them close to the bottom. Once the nets are close a scientist at the computer has the cable operator pull the nets up and out of the water. Once they are on deck they have to be washed down so all the organisms that were caught in the netting go to the cod end of the nets. The cod ends of the nets are opened up and the organisms are rinsed into a sieve where they will carefully be transferred into glass bottles, treated with formaldehyde and sent to a lab for sorting. There were lots of organisms that were caught in the net. Some that we saw today were: Copepods, Comb Jellies or Ctenophora, Herring Larva, aquatic Arrow Worms or Chaetognaths and tons of Phytoplankton and Zooplankton. The Bongo nets are towed several times a day and night to collect samples of plankton.

Jerry Prezioso and I washing down the Bongo Nets.
Jerry Prezioso and I washing down the Bongo Nets. – Photo by Chris Tremblay.
A shot of some of the creatures we caught being filtered into sampling jars for processing.

Personal Log

The start to the trip has been a little rough. It feels like this is the first day we have been able to do anything. Monday we had to sit in port and wait for a scientist to calibrate some equipment before we left so we didn’t get underway until bed time. When we awoke, the weather was bad and the seas were very rough. Several people were very sick and some still are. We were only able to drop one piece of acoustic equipment all day (more on that in another blog).  We also had to change the plans on where we were going and move closer to shore due to the weather.

On a ship you need to be very flexible as things are changing all the time! Today was the the first day we were able to do any real science for a sustained amount of time and there were definitely lots of bugs and kinks that needed to be worked out. On top of dropping the BONGO nets with Jerry, I was also able to spend some time and fill in some shifts on the the decks with the Marine Mammal team watching for whales and dolphins. We had a few cool sighting of Humpbacks, Minke, and a Right Whales! (More on them and what they do in another blog too.) On another note, the state rooms are huge and I am sharing a room with one of the acoustic scientists, Genevieve. She is very nice and helpful. The food on the ship is spectacular! I am very surprised how good it is and how many choices there are every meal. All and all things are off to a good start and there is so much more I have to share with everyone about what all these scientist do and it is only our first “real” day!

Did You Know? 

Did you know that North Atlantic Right Whales have a V- shaped blow. Their blow holes (two) are separated which gives them the characteristic blow shape.

Check out this link  to the website at Northeast Fisheries Science Center’s Protected Species Branch (NEFSC PSB) Right Whale Team and the work we do there. There is an interactive Google map site and wonderful links.

Boarding the NOAA Ship Gordon Gunter.
Boarding the NOAA Ship Gordon Gunter in Newport, R.I.


Sue Cullumber: Testing the Water and More, June 19, 2013

NOAA Teacher at Sea
Sue Cullumber
Onboard NOAA Ship Gordon Gunter
June 5–24, 2013

Mission: Ecosystem Monitoring Survey
Date: 6/19/2013
Geographical area of cruise: The continental shelf from north of Cape Hatteras, NC, including Georges Bank and the Gulf of Maine, to the Nova Scotia Shelf

Weather Data from the Bridge:
Latitude/longitude: 3853.256 N, 7356.669W
Temperature: 18.6ºC
Barometer: 1014.67 mb
Speed: 9.7 knots

CTDscreen
CTD reading on the computer. Blue is density, red is salinity, green is temperature and black indicates the depth.

Science and Technology Log:

Even before the plankton samples are brought onboard, scientists start recording many types of data when the equipment is launched. The bongos are fitted with an electronic CTD (conductivity, temperature and density) and as they are lowered into the ocean the temperature, density and salinity (salt content) are recorded on a computer. This helps scientists with habitat modeling and determining the causes for changes in the zooplankton communities. Each bongo net also has a flow-through meter which records how much water is moving through the net during the launch and can is used to estimate the number of plankton found in one cubic meter of water.

ZIplankton
Zooplankton (Z) and Icthyoplankton (I) samples.

The plankton collected from the two bongo nets are separated into two main samples that will be tested for zooplankton and icthyoplankton (fish larvae and eggs). These get stored in a glass jars with either ethanol or formalin to preserve them. The formalin samples are sent to a lab in Poland for counting and identification. Formalin is good for preserving the shape of the organism, makes for easy identification, and is not flammable, so it can be sent abroad.  However, formalin destroys the genetics (DNA) of the organisms, which is why ethanol is used with some of the samples and these are tested at the NOAA lab in Narragansett, Rhode Island.

sueplankton
Holding one of our zooplankton samples – photo by Paula Rychtar.

When the samples are returned from Poland, the icthyoplankton samples are used by scientists to determine changes in the abundance of the different fish species. Whereas, the zooplankton samples are often used in studies on climate change. Scientists have found from current and historic research (over a span of about 40 years) that there are changes in the distribution of different species and increases in temperature of the ocean water.

At the Rosette stations we take nutrient samples from the different water depths. They are testing for nitrates, phosphates and silicates. Nutrient samples are an important indicator of zooplankton productivity. These nutrients get used up quickly near the surface by phytoplankton during the process of photosynthesis (remember phytoplankton are at the base of the food chain and are producers). As the nutrients pass through the food chain (zooplankton eating phytoplankton and then on up the chain) they are returned to the deeper areas by the oxidation of the sinking organic matter. Therefore, as you go deeper into the ocean these nutrients tend to build up.  The Rosettes also have a CTD attached to record conductivity, temperature and density at the different depths.

Chris-DICtests
Scientist, Chris Taylor, completing the dissolved inorganic carbon test.
CO2test
The dissolved inorganic carbon test uses chemicals to stop any further biological processes and suspend the CO2 in “time”.

Another test that is conducted on the Rosettes is for the amount of dissolved inorganic carbon. This test is an indicator of the amount of carbon dioxide that the ocean uptakes from outside sources (such as cars, factories or other man-made sources). Scientists want to know how atmospheric carbon is affecting ocean chemistry  and marine ecosystems and changing the PH (acids and bases) of the ocean water. One thing they are interested in is how this may be affecting the formation of calcium in marine organisms such as clams, oysters, and coral.

New word: oxidation – the chemical combination of a substance with oxygen.

canal
Cape Cod canal.

Personal Log:

This week we headed back south and went through the Cape Cod canal outside of Plymouth, Massachusetts. I had to get up a little earlier to see it, but it was well worth it.  The area is beautiful and there were many small boats and people enjoying the great weather.

smallboat
Small boat bringing in a new group to the Gordon Gunter.

We also did a small boat transfer to bring five new people onboard, while three others left at the same time. It was hard to say goodbye, but it will be nice to get to know all the new faces.

dolphinsthree
Common Dolphins swimming next to the Gordon Gunter.

So now that we are heading south the weather is warming up. I have been told that we may start seeing Loggerhead turtles as the waters warm up – that would be so cool.  We had a visit by another group of Common Dolphins the other day. They were swimming along the side of the ship and then went up to the bow. They are just so fun to watch and photograph.

We have been seeing a lot of balloons (mylar and rubber) on the ocean surface. These are released into the air by people, often on cruise ships, and then land on the surface. Sea turtles, dolphins, whales and sea birds often mistake these for jelly fish and eat them.  They can choke on the balloons or get tangled in the string, frequently leading to death. Today, we actually saw more balloons than sea birds!!! A good rule is to never release balloons into the air no matter where you live!

balloon
A mylar balloon seen in the water by our ship.

Did you know?  A humpback whale will eat about 5000 pounds of krill in a day. While a blue whale eats about 8000 pounds of krill daily.

Question of the day?  If 1000 krill = 2 pounds, then together how many krill does a humpback and blue whale consume on a daily basis.

Blue Whale, Balaenoptera Musculus

Sue Cullumber: Can’t Wait to Head Out As a NOAA Teacher at Sea! May 21, 2013

NOAA Teacher at Sea
Sue Cullumber
(Soon to be) Onboard NOAA Ship Gordon Gunter
June 5– 24, 2013

Mission: Ecosystem Monitoring Survey
Date: 5/21/13
Geographical area of cruise:  The continental shelf from north of Cape Hatteras, NC, including Georges Bank and the Gulf of Maine, to the Nova Scotia Shelf

hikein
My students on a field-trip to the desert.
endofday
Howard Gray School in Scottsdale, Arizona.

Personal Log:

Hi my name is Sue Cullumber and I am a science teacher at the Howard Gray School in Scottsdale, Arizona. Our school provides 1:1 instruction to students with special needs in grades 5-12 and I have been teaching there for over 22 years!  In less than two weeks I will be heading out to the Atlantic coast as a NOAA Teacher at Sea.  I am so excited to have this opportunity to work with the scientists aboard the NOAA ship Gordon Gunter.

I applied to the NOAA Teacher at Sea program for the following reasons:

First, I feel that directly experiencing “Science” is the best way for students to learn and make them excited about learning. To be able to work directly with NOAA scientists and bring this experience back to my classroom gives my students such an amazing opportunity to actually see how science is used in the “real world”.

GALAPAGOS, ECUADOR
Visit to Española Island – photo by Pete Oxford
IMG_5384
Students holding “Piggy” and our other baby Sulcata tortoises.

Secondly, I love to learn myself, experience new things and bring these experiences back to my students. Over the past several years I have had the opportunity to participate in several teacher fellowships.  I went to the Galapagos Islands with the Toyota International Teacher Program and worked with teachers from the Galapagos and U.S. on global environmental education. From this experience we built an outdoor habitat at Howard Gray that now houses four tortoises.  Students have learned about their own fragile desert environment, animal behavior and scientific observations through access to our habitat and had the opportunity to share this with a school in the Galapagos. I worked with Earthwatch scientists on climate change in Nova Scotia and my students Skyped directly with the scientists to learn about the field research as it was happening. Last summer I went to Japan for the Japan-US Teacher Exchange Program for Education for Sustainable Development. My students participated in a peace project by folding 1000 origami cranes that we sent to Hiroshima High School to be placed in the Hiroshima Peace Park by their students. We also  held a Peace and Friendship Festival for the community at Howard Gray.

cranesgroup-copy
Completion of the 1000 cranes before sending them to Hiroshima.
IMG_6468
Japanese teachers learn about our King Snake, Elvis, from the students.

This year we had a group of Japanese teachers visit our school from this program and students taught them about many of the sustainable activities that we are working on at school.  Each has brought new ideas and amazing activities for my students to experience in the classroom and about the world.

edgeofcanyon
Dusk at the south rim of the Grand Canyon.

Lastly, Arizona is a very special place with a wide variety of geographical environments from the Sonoran Desert (home of the Saguaro) to a Ponderosa Pine Forest in Flagstaff and of course the Grand Canyon!  However, we do not have an ocean and many of my students have never been to an ocean, so I can’t wait to share this amazing, vast and extremely important part of our planet with them.

So now I have the chance of a lifetime to sail aboard the NOAA ship Gordon Gunter on an Ecosystem Monitoring Survey. We will be heading out from Newport, RI on June 5th and head up the east coast to the Gulf of Maine and then head back down to Norfolk, Virginia. Scientists have been visiting this same region since 1977 from as far south as Cape Hatteras, NC to the an area up north in the Bay of Fundy (Gulf of Maine between the Canadian provinces of New Brunswick and Nova Scotia).  They complete six surveys a year  to see if the distributions and abundance of organisms have changed over time. I feel very honored to be part of this research in 2013!

Gordon Gunter
NOAA Ship Gordon Gunter (photo credit NOAA)

One of the activities I will be part of is launching a drifter buoy. So students are busy decorating stickers that I will be able to put on the buoy when I head out to sea.  We will be able to track ocean currents, temperature and GPS location at Howard Gray over the next year from this buoy.  Students will be studying the water currents and weather patterns and I plan to hold a contest at school to see who can determine where the buoy will be the following month from this information. While out at sea my students will be tracking the location of the Gordon Gunter through theNOAA Ship Tracker and placing my current location on a map that one of my students completed for my trip.

IMG_9292
Spending time with my husband, Mike, and son, Kyle.

Outside of school, I love to spend most of my free time outdoors – usually hiking or exploring our beautiful state and always with my camera!  Photography is what I often call “my full-time hobby”.  Most of my photos are of our desert environment, so I look forward to all amazing things I will see in the ocean and be able to share with my husband and son, students and friends!  One of my passions is to use my photography to provide an understanding about the natural world, so I am really looking forward to sharing this fantastic adventure with everyone through my blog and photos!

wellearnedrest3
Enjoying the view during one of my hikes in the Sonoran Desert.