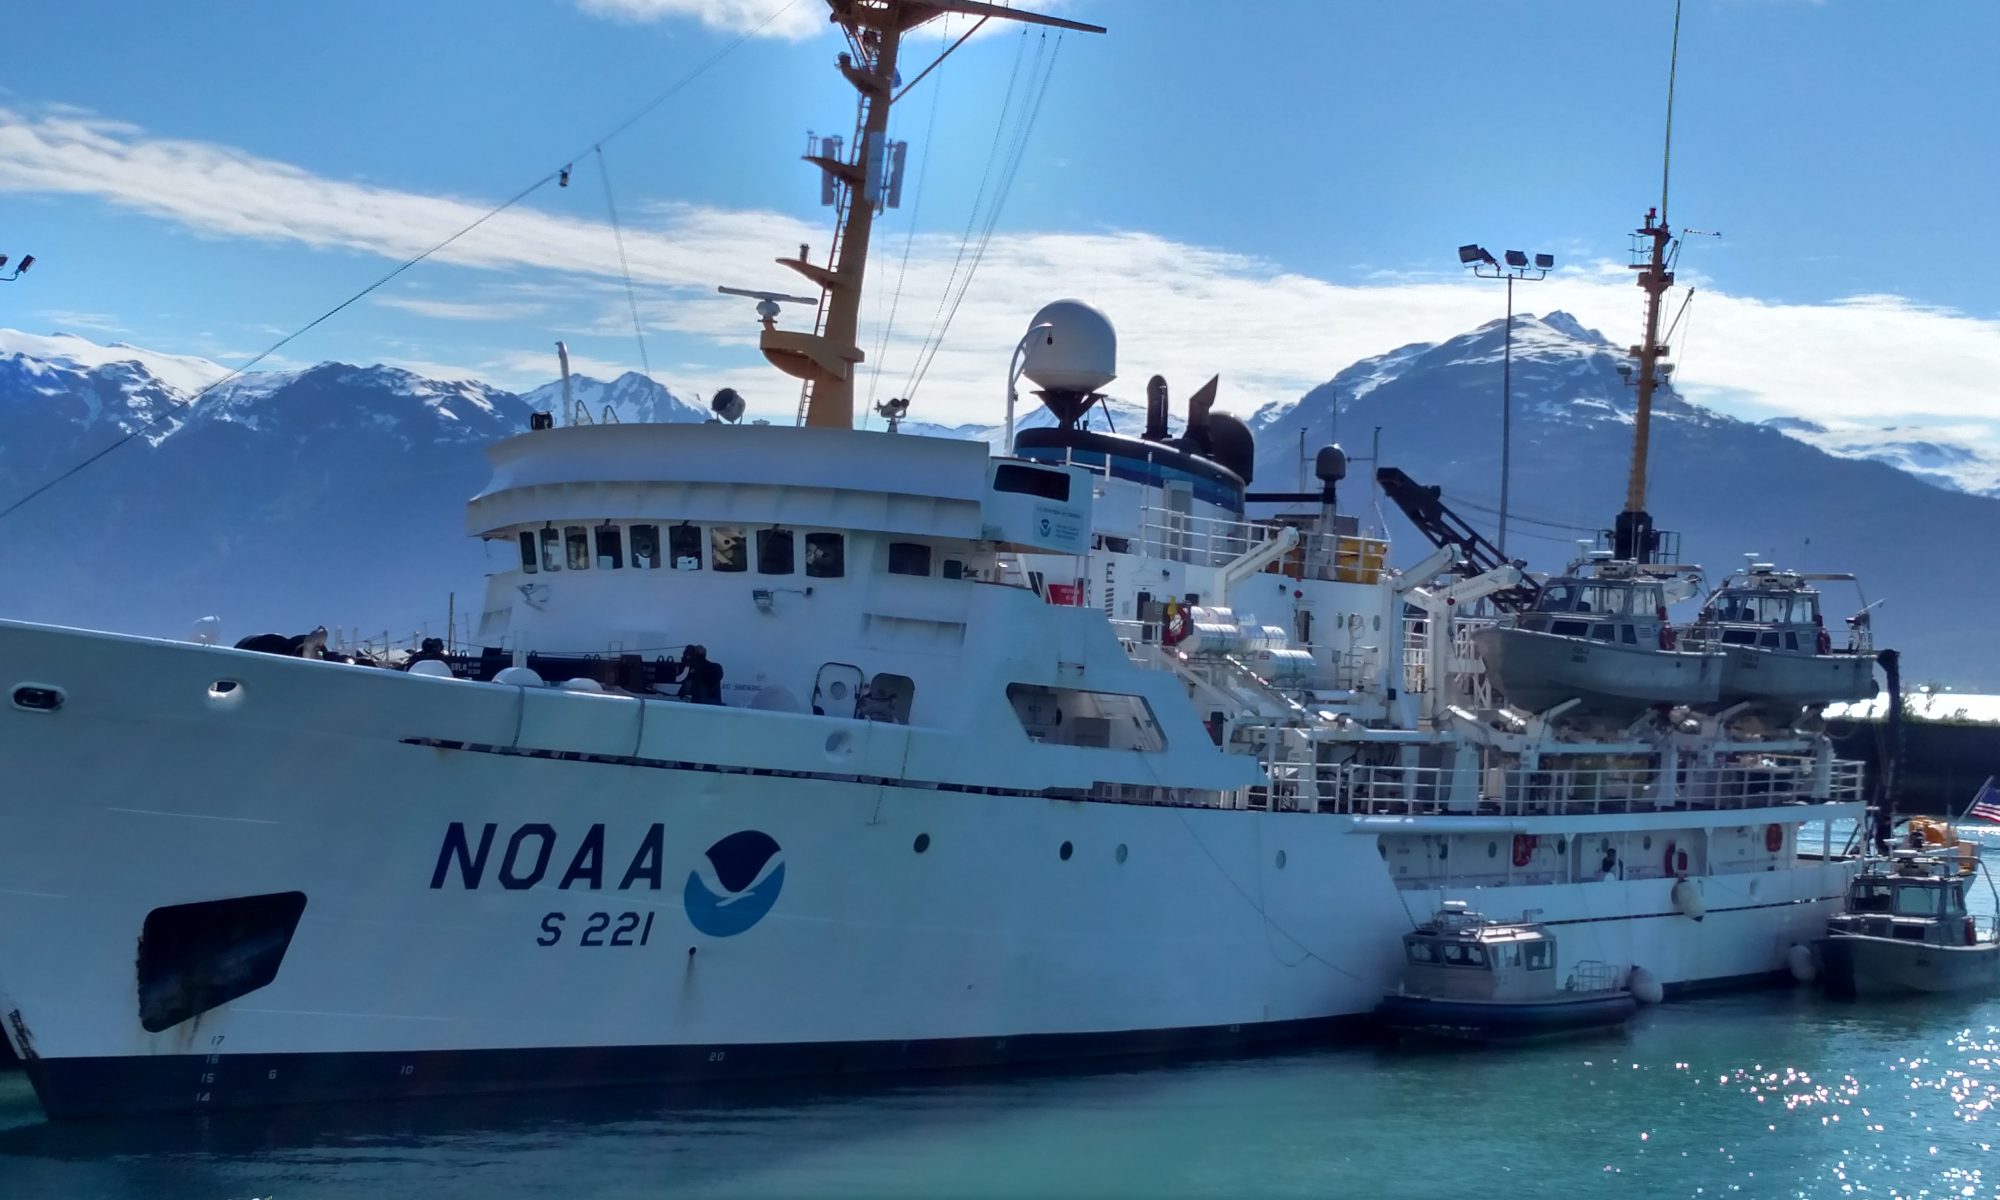
Lisa Hjelm, July 29, 2008

NOAA Teacher at Sea
Lisa Hjelm
Onboard NOAA Ship Rainier
July 28 – 15, 2008

Mission: Hydrographic Survey
Geographical area of cruise: Pavlov Islands, Alaska
Date: July 29, 2008

As soon as we pulled away from the pier the incredible beauty of Alaska began to unfold all around us.

Science and Technology Log 

We set sail at precisely 1300, in bright sunshine. Once we were underway everyone was busy. The gangplank and onshore equipment were stowed away. Survival suits, hardhats and lots of instructions were handed out to the newcomers. Before I knew it I had been in and out of a survival suit and knew my job and location in case of fire or any other possible emergency. I made sure I knew where my lifeboat was as well (#7). This is after all my first adventure at sea. As soon as possible I stationed myself on the Bridge where I spent most of my time during the transit from Kodiak to our work site at the Pavlof Islands. I was very interested in learning about the navigation of the RAINIER, but initially I was distracted by the islands, volcanoes and wildlife to be seen in every direction. Puffins, with their funny orange feet, were everywhere and in one of the narrow passages I saw at least ten sea otters. As we moved beyond Kodiak Island we frequently saw the spouts of whales. Our transit time was 32 hours at 13 knots, so I did get to spend time observing the Bridge in full operation.

Scenery in transit
Scenery in transit

There were always at least three people at work on the Bridge, usually more. Everyone worked a four hour shift, and they were alert, attentive, observant, and busy every minute of that time. The ship’s position was updated on a nautical chart every 15 minutes as was the weather log. I noticed there was a NOAA cloud identification chart posted on the wall, the same one I use in my classroom. Two Ensigns were responsible for directing the ship, monitoring radar, speed, weather, our exact location, updating the chart and using binoculars to scan the horizon in all directions. A member of the Deck Crew was at the helm steering the boat and providing a third set of eyes scanning the horizon in all directions.  There was constant communication amongst the three of them about what they were seeing and doing. We saw and monitored the progress of many fishing trawlers, an occasional log and whales. Whales were most easily spotted by their spouts and the RAINIER shifted course slightly whenever necessary to avoid them.

The Captain was on the Bridge whenever we went through narrow passages, and she was called when fishing boats got within a certain distance of the RAINIER. It was exciting to see people collecting data and using all of the skills taught in science. I was seeing science in action. It was absolutely clear that everyone knew his or her job and did it well. As a result, my first night at sea, I slept like a baby, rocked by the waves.

View of the Bridge, in transit from Kodiak to Pavlof Islands, AK

Personal Log 

When I arrived in Kodiak it was cool and drizzly. Patches of snow were visible on the tops of nearby hills and lilacs were just beginning to bloom, very different from NH weather in late July. Our lilacs bloom on Memorial Day. A van from the ship picked me up and Ensign Anna-Liza Villard-Howe showed me to my bunk and gave me a quick tour of the ship. After practicing climbing into and out of an upper bunk and stowing my stuff, I spent some time investigating on my own. My first impression was that NOAA Ship RAINIER was similar to Hogwarts, lots of narrow passageways and staircases that moved around when I wasn’t looking. Now that I’ve been aboard for a couple of days, I know it’s only the ship that moves, not the staircases, and I’ve learned the way to my favorite place so far, the Bridge.

Ensign updating the chart
NOAA Teacher at Sea, Lisa Hjelm, learns the ropes

Gary Ledbetter, July 22, 2008

NOAA Teacher at Sea
Gary Ledbetter
Onboard NOAA Ship Rainier
July 7 – 25, 2008

Mission: Hydrographic Survey
Geographical area of cruise: Pavlov Islands, Alaska
Date: July 22, 2008

Weather from Bridge 
Winds W/NW 10-15 building to 20
Partly Sunny, High 55 F
Seas 2-4 feet

NOAA Teacher at Sea, Gary Ledbetter, helps prepare the CTD for a cast.

Science and Technology Log 

Navigation 

Take a close look at some of the electronic communication and navigation equipment in the picture above. Which one do you think is the most important?  Well, it’s probably not in this picture.  Depending on who you ask you will get a different answer as to which piece of equipment is the most important.  One would think with the advancements in electronics, it would be the GPS, or some other piece of high tech equipment.  Although the most important piece is related to some of the high tech equipment, the instrument itself is not even close to being on the list of the latest and greatest technological equipment – it’s the compass; more specifically the gyro compass.

History 

Unlike many things we may feel are rather mundane, the gyrocompass has an interesting history. Apparently taking a patent out for something that doesn’t work is not a new phenomenon because the gyrocompass was patented in 1885 (only about 20 years after the end of the Civil War) by Geradus van den Bos…. and yes, it didn’t work! Four years later, Captain Author Krebs designed an electronic gyroscope for use aboard a French submarine. Then, in 1903, Hermann Anschutz-Kaempfre refined the gyrocompass, applied for and also was granted a patent. Five years later, in 1908, Anschutz-Kaempfre, with the help of Elmer Ambrose Sperry did more research on the compass and was granted an additional patent in both Germany and the United States.  Then things started to heat up.  Sperry, in 1914, tried to sell this gyrocompass to the German Navy and Anschutz-Kaempfre sued Sperry for patent infringement.  As happens today, the attorneys got involved and various arguments were presented.  Now it even gets more interesting – Albert Einstein got involved.  First, Einstein agreed with Sperry and then somewhere during the proceedings, Einstein had a change of heart and jumped on the Anschutz-Kaempfre bandwagon.  The bottom line?  Anschutz-Kaempfre won in 1915.

A myriad of navigation equipment exists aboard the RAINIER.

So What? 

OK, this history is all well and good, but what does a gyrocompass do that any regular compass can’t do? In a nutshell, a gyrocompass finds true north, which is the direction of the Earths rotational axis, not magnetic north – the direction our Boy Scout compass pointed.  Another factor of the gyrocompass is that it is not affected by metal such as the ships hull.  Put your Boy Scout compass next to a large metal object and see what happens.  Also remember one thing:  When you tried to find magnetic north with a Boy Scout compass, you had to hold it very, very still. Try reading a regular compass aboard a ship that is not only moving through the water, but is being tossed about by the waves and currents of the ocean.  The gyrocompass addresses this concern also. Without going into a lot of detail (and yes there are a lot of details, even about a compass) friction causes torque, which makes the axis of the compass to remain perpendicular.  In other words as the ship rolls and pitches, torque makes the axis of the compass to remain perpendicular to the earth. You then have an instrument that can read true north in nearly all weather conditions.

The electronic gyrocompass aboard the RAINIER

Definition 

Torque: A turning or twisting force

Personal Log 

I was a victim!  I was a victim of NOAA!  In fact, I was a very, very willing victim!  NOAA’s safety record is very high and they conduct numerous safety drills to maintain that record and to insure the safety of all aboard. On July 20th I was asked if I wanted to play the “victim” in an upcoming safety drill.  Of course I jumped at the chance. I was to play an unconscious fire victim with broken bones. After I staged the “accident” the various medical and fire suppression teams came to my rescue. These drills are very serious part of NOAA’s operation and are taken seriously by the crew – but that didn’t mean I didn’t have fun in the process!!

Gary plays the part of the “victim” during a safety drill on the RAINIER.

Gary Ledbetter, July 15, 2008

NOAA Teacher at Sea
Gary Ledbetter
Onboard NOAA Ship Rainier
July 7 – 25, 2008

Mission: Hydrographic Survey
Geographical area of cruise: Pavlov Islands, Alaska
Date: July 15, 2008

Weather from Bridge 
Winds SE/E @ 5 knots
Temperature:  High 45 degree F
Seas 1-3 feet

This is the Reson Sea Bat 7125, the type of sonar on the bottom of one of the RAINIER’s launches.

Science and Technology Log 

Sonar 

Sonar, which is short for sound navigation and ranging, is a system that uses sound to communicate, navigate, detect other vessels, and determine the depth of the water.  A hydrographic survey ship, such as the RAINIER, extensively uses sonar on their survey boats.

A Very Brief History 

Using sound to detect objects is nothing new. In fact man has been using it for hundreds of years. Even before man was using sound, bats use their own form of sonar (more commonly referred to as radar) for navigation.  As early as 1490 Leonardo Da Vinci inserted a tube in water, put his ear to the tube and reportedly was able to detect vessels.  Not surprisingly, the use of the “echo locate” system was given a big boost following the Titanic disaster of 1912.  The British Patent Office gave English meteorologist Lewis Richardson, the world’s first patent for an underwater echo ranging devise within one month of the sinking of the famous ship.

Matt from Earth Resources Technology working on one of the survey launches

Sonar usually plays an important part when we watch World War II war movies depicting the Navy hunting enemy submarines.  These depictions were more than just Hollywood.  In fact, the British were ahead of the U.S. in sonar technology even prior World War I.  In 1916 Canadian physicist Robert Boyle took along with AB Wood, under the direction of the British Board of Invention and Research, produced a prototype for active sound detection in 1917.  This was really secret stuff! In fact it was so secret that the word used to describe that early work, called “supersonics”, was changed to ASD’ics. This term eventually morphed into ASDIC.  It even gets more interesting.  The Admiralty made up a story that ASDIC stood for “Allied Submarine Detection Investigation Committee.  Many people today still think that’s what ASDIC means even no committee with this name has even been found in the Admiralty archives.

It seems like we Americans always have to change the name of something, (you history buffs know that Britain had something called the wireless… but we changed it to radio) so we did the same thing with ASDIC.  We changed it to SONAR, primarily because it was closely related to RADAR. The name change became official in 1948 with the formation of NATO’s standardization of signals. Thereafter, ASDIC was changed to SONAR for all NATO countries.

The lines you see make up the grid the survey boats follow. The ones scratched out are the ones we have completed.

So Just What Is This Sonar…? 

There are two basic types of sonar: Active and Passive.  We’ll briefly discuss passive first.  Passive listens without transmitting.  It is used to determine the absence or the presence of something – primarily in the water.  To come directly to the point it is detecting any sound that comes from a remote location.  Listening to those sounds helps identify the sound.  (Back to Hollywood: remember the scene in nearly any navy warfare movie when the sonar operator of the ship is talking with the captain:  “it sounds like a X4IY9, Class H2 Russian sub, Captain). The sound of the sub was not being produced in any form from the ship, but from a remote location – the sub. Now you have an idea of passive sonar.

Active Sonar 

Yours truly trying his hand at driving the boat

Active Sonar creates a “ping”. This ping travels through the water until it strikes something; it then bounces back. The bouncing is called reflection, or an echo.  The ping is created, normally, electronically. When the ping is transmitted it travels through the water, strikes an object and bounces back (the echo). This time is measured and converted into range (distance) by knowing the speed of sound. Sounds pretty simple, right?  Unfortunately numerous variables can affect the time it takes for the echo to return such as salt content (sounds travels faster through salt water than fresh water), the density of the water, and even the temperature of the water. Then there is the “noise”, or other disturbances in the water: fish, seaweed, dirt, trash, etc., that effect an accurate measurement.  All of these variables have to be taken into consideration by the survey technicians and scientists.

The survey boats from the RAINIER use different types of sonar. The sonar on the boat I was recently on is called the Reson SeaBat. Instead of simply one “ping”, it produced a swatch of 128 degrees consisting of 256 pings across the ocean floor.  It then transmits these pings back to the boat.  Think in terms of a triangle, with the top of the triangle being the sonar unit on the boat. The sonar transmits the pings across the ocean floor and sends back numerous signals instead of just one.

Yours truly trying his hand at driving the boat

Personal Log 

Yesterday I was aboard survey boat (called a launch) RA 4.  These boats are deployed and retrieved each morning and night. On the ocean each boat follows a predetermined grid across the ocean much like mowing your lawn.  Deploying the boats, retrieving the boats, and following the grid looks really simply until you do it yourself, and then you realize how difficult it really is.  I guess when you watch experts do something, they make it look easy.  The sea was nearly mirror smooth.  Although it was cloudy and cool, there was little or no rain or wind. This makes the process much easier as well as more enjoyable.  Tim, a NOAA Ensign was operating the onboard computer system that kept track of the sonar readings.  I was able to try my hand at driving the boat and operating the computer.  I’m not going to talk about how well I did, but as I said before, they make their job look so easy!

Gary Ledbetter, July 7, 2008

NOAA Teacher at Sea
Gary Ledbetter
Onboard NOAA Ship Rainier
July 7 – 25, 2008

Mission: Hydrographic Survey
Geographical area of cruise: Pavlov Islands, Alaska
Date: July 7, 2008

Weather Data from the Bridge 
Winds SE/E @ 10 knots
Drizzle, Seas 1-3 feet
Temperature: High 45 degree F.

NOAA Teacher at Sea, Gary Ledbetter

Background 

The Office of Coast Survey (OCS) is a part of the National Oceanic and Atmospheric Administration (NOAA) that conducts hydrographic surveys. In short, they measure the depth and bottom configuration of bodies of water using sonar technology. From these measurements our nation’s nautical charts are developed to assist in safe navigation of the United States waters.  Additionally the surveys also locate and publish sea-floor materials that may inhibit safe ocean travel such as pipeline and cables, shipwrecks, and other obstructions. NOAA hydrographic surveys have also been instrumental in locating the wreckage of TWA Flight 800, John F. Kennedy Jr.’s plane, and EgyptAir flight 990. OCS has conducted over 10,600 surveys since it began in the early 1900s. *

Science & Technology Log 

If you are like me, you probably thought that sonar was simply aimed at the bottom of the ocean and a graph-like image came back. Well, this is essentially true – but there is a lot more to it than that.  Prior to even using that technology, another research tool must be used: The CTD recorder.  “CTD” means, Conductivity-Temperature-Depth recorder. This instrument measures either directly or indirectly such factors as temperature, saline, and density.

ENS Junior Officer Christy Schultz preparing to lower the CTD Recorder, which sits  in the metal cage in front of her
ENS Junior Officer Christy Schultz preparing to lower the CTD Recorder, which sits in the metal cage in front of her

Although measuring these characteristics are not new (Benjamin Franklin did some of these measurements as far back as the 18th century), the methods of taking these measurements have drastically changed. The present technology was developed in the 1960’s where the instrument itself is placed in the water it is measuring.  The instrument then takes a continuous measurement of conductivity, temperature and depth, which are recorded continuously.  These measurements are taken up to 24 times per second.  That kind of speed creates a very high-resolution description of the water being tested. When the instrument is measuring conductivity, it is simply discovering how easily electricity passes through the water sample being tested.  Since electricity passes through water more easily with a higher salt content; the more easily electricity is passed, the higher the salt content.

The CTD normally uses a thermistor: a platinum thermometer, or a combination of these to measure temperature.  The accuracy is quite amazing:  greater than 0.005 degrees Celsius. Last, but not least, the CTD measures pressure.  This pressure is measured in decibars.  Depth and pressure are directly related.  In other words, if you are at 340 meters below the surface, the meter will indicate about 350 decibars (dbars). Once all these measurements are taken, they can either be stored in the actual instrument or they can be transferred to a computer when the CTD is withdrawn from the ocean. OK, you may say, this is all well and good, but what does it have to do with mapping the ocean floor (the technicians call this, “mowing the ocean”)?   The simple answer:  All these conditions affect the speed of sound.  Therefore when the sonar “pings” the computer will compensate for variables (temperature, density and salinity); this creates a more accurate reading of the ocean depth at any particular spot. **

Personal Log 

I am discovering that hydrographic surveys are both simplistic, and complex.  Simplistic in terms that the survey boats simply follow a pre-established grid and collect computerized data.  They collect this data by following a pre-determined grid much like someone mowing their lawn.  In fact the surveyors call it “mowing the ocean”.  However, the interpreting of this data is the job of several engineers and engineer technicians which may take several hours or possibly all night.

*Information obtained from NOAA website, ** Information obtained from the CTD website

Terry Welch, July 1, 2008

NOAA Teacher at Sea
Terry Welch
Onboard NOAA Ship Rainier
June 23-July 3, 2008

Mission: Hydrographic Survey
Geographical Area: Pavlov Islands, Gulf of Alaska
Date: July 1, 2008

Weather Data from the Bridge 
Wind: S/SE 15-20
Precipitation: clearing
Temperature:  High 47 Seas 1-3’

NOAA Teacher at Sea, Terry Welch, at the helm of the RAINIER

Science and Technology Log 

Today, we are in transit to Seward after surveying the Pavlof Island area for the past week.  We cut our surveying down a day due to incoming weather.  The RAINIER made good headway and we stayed ahead of the storm.  The seas never seemed all that bad in the last 12 hours and today we have sun! I spent some time observing what the ensigns (ENS) and crew do on the bridge while underway. There are always 2-4 people on a “watch” and they continually monitor navigation instruments, weather, and look for any possible obstructions like boats out there. A “watch” lasts four hours.

The RAINIER uses two different kinds of radar to track vessels or land around us. The ensigns also observe through binoculars a lot.  When I was at the bridge, there were two larger fishing vessels ahead of us. The radar tracks how far a boat is in nautical miles from us, their speed and direction headed.  Many larger boats and ships carry an AIS (Automatic Identification System), which allows the exchange of ship data such as identification, position, course and speed, with nearby ships. GPS (Global Positioning System) plays an important role in their navigation also and is tied into theequipment.

RADAR on the bridge of the RAINIER

The ensigns and captain also plan out our routes using maps, compasses, and straight edges.  Plotting our course is done the old fashioned way – paper and pencil. Below is ENS Schultz plotting our course. I spent a little time in the plotting room, where the hydrographic crew cleans up the data that has been collected during the day. I mentioned in an earlier log that the Multibeam SONAR system collects sounds waves, casually called “pings” that are bounced off the ocean floor and are sent back to the system.  How well these transmissions are sent and received depends on several physical factors of the water including water depth, temperature, salinity and conductivity.  I was a little stumped on how all of these factors play a roll in understanding the data and Ian, the Hydrographer Tech, reminded me about Snell’s Law, which describes how waves refract differently through different mediums.  There are a couple of short QuickTime movies on the NOAA education website that show Multibeam sonar at work.  Click here.

ENS Christie Schultz plots the RAINIER’s course with old fashioned pencil and paper.

The “casts” we took every few hours with the CTD (Conductivity-Temperature-Depth) instrument help the software determine the speed of sound by applying Snell’s Law, more or less, and make corrections for the differences in the water layers. It’s interesting to note that the first layer of water may have much less salinity than deeper water due to stream flow into the ocean.  In a column of water:  as the temperature increases, sound speed increases; as the pressure increases, sound speed increases; and as salinity increases, sound speed increases.  For more info on Snell’s Law and sound waves, go here.

Personal Log 

The CTD instrument
The CTD instrument

The sun came out for most of the day today, which enabled me to see the wonderful mountains around here.  We are transiting through the Shelikof Straight just north of Kodiak and south of the Alaska Peninsula.  We should be in Seward in the morning.

Questions of the Day: 

  1.  How do sounds waves travel through water differ from light waves?
  2. What is the speed of light and speed of sound?
  3. Is the speed of sound different in salt water rather than fresh water?

Animals Seen Today: Porpoises along the bow

The magnificent mountains surrounding Shelikof Straight