Melissa Barker: Reflections from Land, July 20, 2017


NOAA Teacher at Sea

Melissa Barker

Aboard NOAA Ship Oregon II

June 22 – July 6, 2017


Mission: SEAMAP Groundfish Survey

Geographic Area of Cruise: Gulf of Mexico

Date: July 20, 2017

Weather Data from the Bridge: I am now back in Longmont, Colorado

Latitude: 40 08.07 N

Longitude: 105 08.56 W

Air temp: 31.1 C


Science and Technology Log

One of the major questions I had before my Teacher at Sea voyage was how the level of oxygen in the water will affect the species we collect. Typically, in the summer, a dead zone forms in the Gulf of Mexico spreading out from the mouth of the Mississippi river. You can see an image of the dead zone from 2011 below.

Hypoxia2011
Bottom Dissolved Oxygen Contours, Gulf of Mexico, 2011

Phytoplankton, or microscopic marine algae, are the base of the marine food web. There are two main classes, diatoms and dinoflagellates, which are both photosynthetic and typically live towards the top of the water column. We did not sample plankton on our leg of the cruise, but if you want to learn more you can check out this site: https://oceanservice.noaa.gov/facts/phyto.html. In the summer, phytoplankton and algae can build up due to excess nutrients in the water that are running off from urban areas, agriculture and industry. Much of our sampling was near the mouth of the Mississippi River, which is a significant source of excess nutrients. The extra nitrogen and phosphorus in the runoff cause the excess growth of photosynthetic organisms which leads to a buildup of zooplankton (heterotrophic plankton). Once the phytoplankton and zooplankton die and sink to the bottom they are decomposed by oxygen consuming bacteria which deplete the oxygen in the water column. According to NOAA, hypoxia in aquatic systems refers to an area where the dissolved oxygen concentration is below 2 mg/L. At this point, most organisms become physiologically stressed and cannot survive.

4911433052_f535276bdf_b
How The Dead Zone Forms: Infographic by Dan Swenson, NOLA.com/The Times-Picayune

Tropical Storm Cindy, which kicked up just as I was arriving in Galveston, brought significant freshwater into the gulf and mixed that water around so we did not see as many low oxygen readings as expected. While I was talking with Andre about hypoxia when we were on the ship, he used the analogy of stirring a bowl of soup. There is a cool layer on top, but as you stir the top layer and mix it with the lower layers, the whole bowl cools. Similarly, the oxygen rich freshwater from the storm is mixed around with the existing water, reducing the areas of low oxygen. You can see in the map below that we had fewer hypoxic areas than in 2011.

2017-hypoxia-contours
Bottom Dissolved Oxygen Contours, Gulf of Mexico, 2017

We used the CTD to obtain oxygen readings in the water column at each station. In the visuals below you can see a CTD indicating high oxygen levels and a CTD indicating lower, hypoxic, oxygen levels. The low oxygen CTD was from leg one of the survey. It corresponds with the red area in the hypoxia map above.

Non Hypoxic station copy
CTD for a non-hypoxic station
Hypoxic Station copy
CTD of a hypoxic station

 Personal Log and Reflections

P1030035
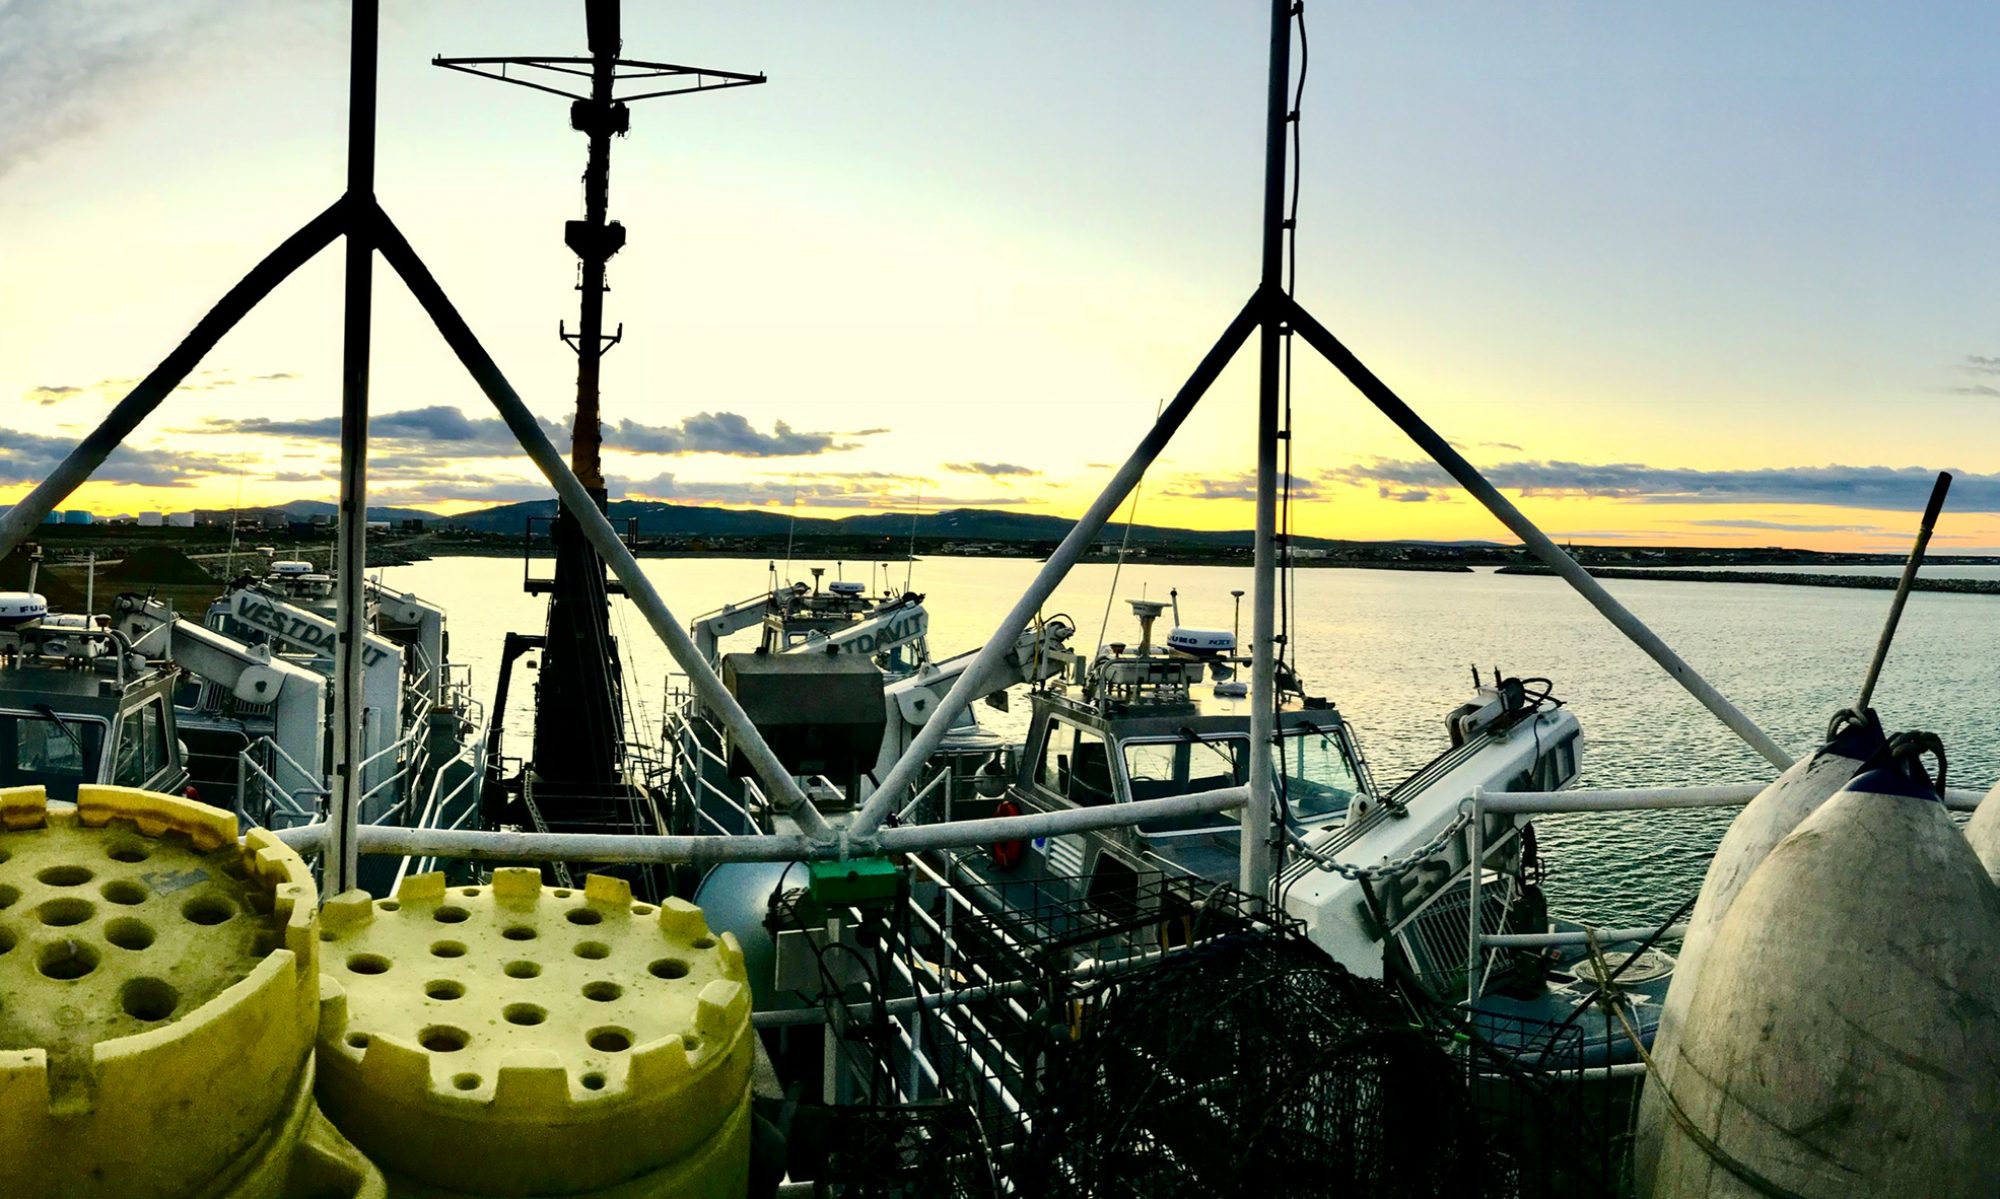
Final sunset over the Gulf of Mexico

When I arrived back on land I still felt the rocking of the Oregon II. It took two to three days before I felt stable again. As friends and family ask about my experience, I find it hard to put into words. I am so grateful to the NOAA Teacher at Sea program for giving me this incredible experience and especially thankful to Science Field Party Chief Andre Debose and my day shift science team members, Tyler, David and Sarah, for teaching me so much, being patient and making my experience one that I will never forget.

The ocean is so vast and we have explored so little of it, but now, I have a strong understanding of how a large scale marine survey is conducted. Being an active participant in fisheries research was definitely out of my comfort zone. The experience helped stretch me and my learning and has giving me great insight to bring back to share with my students and school community. The map below shows our journey over the two weeks I was on the ship traveling along the Texas, Louisiana, Mississippi and Florida coasts.

Summer GroundfishLEG2 Oregon II ALL
The blue line maps our route on the Oregon II

My experience on Oregon II has also re-engaged me with the ocean. As a child, I spent time each summer on an island off the coast of Maine and even got to go fishing with my Dad and his lobsterman buddies. But for the last 20 years or so, my exposure to the ocean has been limited to just a few visits. My curiosity for the marine world has been reignited; I look forward to bringing more fisheries science and insight into my classroom.

P1030010 (1)
Brown shrimp (Penaeus aztecus) on the left Pink shrimp (Penaeus duorarum) on the right

I mentioned in a previous blog that our shrimp data was sent daily to SEAMAP and made available to fisheries managers and shrimpers to allow them to make the best decisions about when to re-open the shrimp season. According to Texas Parks and Wildlife (TPWD), the commercial shrimp season for both the state and federal waters re-opened just after sunset on July 15, 2017. TPWD said, “The opening date is based on an evaluation of the biological, social and economic impact to maximize the benefits to the industry and the public.” It is satisfying to know that I was part of the “biological evaluation” to which they refer.


Finally, I took some video while out at sea and now with more bandwidth and time, I’ve been able to process some of that video to shed additional light on how fisheries research is conducted. I’ve added two videos. The first one shows the process of conducting a bottom trawl and the second one show the fish sorting and measuring process. Enjoy!


Did You Know?

You can use the following sites to help you make smart sustainable seafood choices:

FishWatch (http://www.fishwatch.gov)

Monterey Bay Aquarium (http://www.seafoodwatch.org). There is also a free app you can put on your phone so you can do a quick look up when you are at a restaurant, the grocery or a fish market.


The largest Gulf of Mexico dead zone recorded was in 2002, encompassing 8,497 square miles. The smallest recorded dead zone measured 15 square miles in 1988. The average size of the dead zone from 2010-2015 was about 5,500 square miles, nearly three times the 1,900 square mile goal set by the Hypoxia Task Force in 2001 and reaffirmed in 2008.

(source: http://www.noaanews.noaa.gov)


Dawson Sixth Grade Queries

Thank you to the Dawson sixth graders (now seventh graders!) for your great questions. I look forward to speaking with you all when school starts in a few weeks.

What is at the bottom of the low oxygen part of the ocean? (Allison)

There is a lot of accumulated dead organic matter that is decomposed by oxygen consuming bacteria.

What do you find in the dead zone? Do less animals live there? (Leeham, Mae, Shane, Alfie, Bennett)

Typically, trawls are smaller and the diversity of organisms decreases in the low oxygen areas. Often you will find resilient organisms like croaker. There is a lot of research looking at which organisms can live in dead zones and how these organisms compensate for the low levels of oxygen.

Is there any way to fix the dead zone? What can we do about the dead zone? (Isaac, Owen, Ava)

It is estimated that seventy percent of the excess nitrogen and phosphorus that runs off into the Gulf of Mexico comes from industrial agriculture. Reducing the amount of fertilizer used to grow our food would help decrease the extent of the dead zone area. Perhaps one of you will come up with a way to feed our communities in a more sustainable way or a technology that can remove these excess nutrients before the water reaches the Gulf.

Thanks for reading my blog!

img_3346.jpg
Safety first on the Oregon II.


Carol Schnaiter, Home Again! June 25, 2014

NOAA Teacher at Sea

Carol Schnaiter

Aboard NOAA Ship Oregon II

June 7 – 21, 2014

Mission: I am back home in Amboy, IL, now so my mission is getting back to a “normal” schedule and getting my land legs back!

Weather: Partly sunny, 82 degrees

Date: June 25, 2014

Early morning work
Early morning work!

Science and Technology:

Hypoxia or low oxygen levels in the water is my final topic. The “dead zone” may seem like it does not relate to me being home, but in reality it really does.

This “dead zone” is affected by many things such as the oceanographic conditions, but a major cause is excessive nutrient pollution from agriculture and waste water. Being from a rural agricultural area I wonder how much of what we are doing here in the north affects the ocean waters far away?

So how does this all start? The nitrogen and phosphorus that flows into the water fuels the growth of algae, later when the algae dies and decays, it sinks to the bottom. At the bottom the bacteria will devour the dissolved oxygen from the water. With little or no oxygen the organisms living there must either move, if they can, or they will die.

Where does this nitrogen and phosphorus come from? Most of this can be found in fertilizers from agriculture, golf courses and suburban lawns, discharges from sewage treatment plants, and even from erosion of soil full of nutrients. Since past spring was very rainy and there were floods near the Mississippi River much of this was taken from the soil into the water. The flood waters then drained back into the river and into the gulf carrying many of these nutrients.

How do we know this is happening and that it is getting worse? On the NOAA Ship Oregon II and other ships there are daily checks of the water oxygen levels. Tests similar to these have been conducted for many years. The results are compared and they show that changes in the oxygen levels are happening and not for the better.

While on the ship the scientist performed these tests using the CTD.  Water taken from the CTD is handled very carefully so no oxygen is added by accident. As chemicals are added, you can see the changes where the oxygen in the water bonds to the chemicals. The results of these tests are compared to the results collected by the computer.  Having both tests generate similar results show more proof of the oxygen levels.

CTD coming up
CTD coming up!

I noticed that when the ship was closer to land, the oxygen levels would be lower and Lead Scientist Kim Johnson said as the ship traveled closer to the mouth of the Mississippi River, the levels would drop even more. (I plan on watching the results as they are posted.)

Can anything be done to stop this? Some scientist say one of the solutions would be to use fewer fertilizers another would be to maybe watch when the chemicals were added, so there would be less runoff.

Of course checking septic systems and sewage treatment plants to be sure they are up to code and working correctly would help. These solutions sound simple, but maybe people do not even realize what happens up north and how it really does affect what is going on at the bottom of the ocean.

Maybe our Amboy Marsh is the beginning, a place where the water can be filtered.

Here is a map showing the levels of oxygen in the water.

http://noaateacheratsea.blog/wp-content/uploads/2014/06/20140625_051938-1.jpg

Personal Log:

I have been home now for four days. My land legs are back and I only feel dizzy when closing my eyes while washing my hair in the shower. I want to thank everyone for reading my blogs, I hope you enjoyed my adventure and learned something new.

As I look through my pictures, memories of the sixteen days I spent at sea flood my mind. I look at the safety precautions that were taken to make sure everyone on the ship stayed safe. The drills, the posting of where everyone was to go and what they were suppose to do in case of an emergency, and the sign stating how many days the ship had gone without a problem. I always felt safe, everyone was very careful and followed rules to ensure the safety of everyone….just like we do at school!

Accident free days
525 Days without an accident!
Ship's emergency bullets
Emergency bullets

I also think about how what seemed like a tiny space became my home away from home. Everything you need to survive on a mere 178 ft ship! Two showers for everyone to share, three heads (toilets) and one washing machine and one dryer. I thought it would be impossible, but it just proved my husband’s theory that we have too much in our home!

laundry area
Laundry Area!
Shower room
Two showers to share with everyone!

I want to tell you how thankful I am that NOAA has this wonderful program and allowed me to participate. I know many teachers applied for this and I am honored that I was selected. Thank you to the scientists aboard the ship: Kim, for EVERYTHING, the Night Shift: Taniya, Andre, Lee, Chrissy, and Rebeca for all of their guidance and help.

The deck crew: Chris, Chuck and Mike-thanks for your support and for making the night go by so quickly!  Master Dave Nelson and ALL the members of his crew for their help in explaining everything and the tours on the ship!

This survey opened my eyes to what is happening under the water and how fragile life in the deep blue sea really is. It confirmed my thinking that we (the human race) need to look closely at what we are doing everyday and how it affects others. I plan on following the NOAA Ship Oregon II during the rest of the summer groundfish survey and during the fall groundfish survey. I want to see how the oxygen level changes, how the data collected affects the shrimp season, and follow the members of the ship!

Day One
Our first day together! (Photo by Karen Mitchell)

I cannot wait to share with my students and with anyone that will listen! Would I do this again? YES, I would go back to sea in a minute if I had the chance!

Crystal Davis, Day Three at Sea, June 25, 2014

NOAA Teacher at Sea

Crystal Davis

Aboard NOAA Ship Oregon II

June 23 – July 7, 2014

Mission: SEAMAP Summer Groundfish Survey

Geographical Area of Cruise: Gulf of Mexico

Date: Wednesday June 25, 2014

Weather: Overcast and Cloudy

Waves:1.5 meters

Science and Technology Log:

Getting ready to lower the CTD
CTD with Niskin Bottles and instument panels
CTD with Niskin Bottles and instrument panels

The Oregon II carries an instrument called a CTD (Conductivity, Temperature, Depth) that is lowered into the ocean by a crane. On the bottom of the CTD are sensors that detect and relay information back to a computer onboard the Oregon II. On top of the sensors are Niskin (gray) bottles that are manually opened before the CTD is lowered into the water, and are tripped by the Watchleader (closing and trapping water inside) when it reaches the desired depth. Data from the CTD is sent to the ship where it is recorded and stored. After the CTD is back on board, the water from the Niskin bottles is used to check the amount of dissolved oxygen. This data is then combined with numerous stations/stops and used to create a real time map of the dissolved oxygen levels in the Gulf of Mexico.


Real Time Dissolved Oxygen Map from the Oregon II

One of the missions of the SEAMAP cruise is to measure the amount of dissolved oxygen (DO) in the Gulf of Mexico. Dissolved oxygen is the amount of oxygen that is present in the water and is available for marine life. When the dissolved oxygen content drops below 2mg/L, the water is considered to be hypoxic and the area may be called a dead zone. Basically, what this means is that marine life cannot survive because they do not have enough oxygen.

If you can imagine living at the top of Mt. Everest without an oxygen tank, that is what living in hypoxia would be like to a fish.  While the majority of organisms cannot survive in a dead zone, those organisms that do survive have been found to have permanent changes in their reproductive systems, such as smaller ovaries and fewer eggs in female fish. Dead zones in the Gulf of Mexico are due to runoff from Nitrates and Phosphates that come from fertilizers, detergents and human/animal waste. Because of hypoxia, phosphate detergents have been banned in the Great Lakes and you may even notice that some of your household detergents say “phosphate free”.

Personal Log:

Overall I’m pretty exhausted both mentally and physically. While I have taught my Environmental Students about some of the things I am doing, it’s my first time putting these into practice myself. Although I am grateful for the experience, it is a bit much to take it all in and I feel slightly overwhelmed. Luckily, I will have the chance to perform these tasks over and over before the Oregon II returns to shore. And more importantly, I am working with an amazing team of scientists who are happy to answer all of my questions and walk me through procedures multiple times.

I’m slowly adjusting to being in a different time zone, but am definitely feeling the time change. I am on the night shift which means I start work at midnight and finish at noon. This is unusual for me since I like to be in bed by ten every night. On the bright side, my night shift means I get to beat the heat during the middle of the day when the temperatures are in the eighties.

Immersion Suit
Finally in my Survival Suit


Yesterday we had an emergency abandon ship drill where we had to don survival suits. You put them on as though you were getting into a sleeping bag. This meant a lot of rolling around on the floor for me, but I like to think I entertained the crew while I was doing it. My dad thinks I look like Sebastian from the Little Mermaid in my suit, but I’m confident that I will be a warm lobster until rescue arrives in the unlikely event I have to abandon ship.


Did You Know?

Male seahorses, not female seahorses, carry fertilized eggs and give birth to their young. They will also eat any of their offspring that don’t swim away quickly enough. It pays to be a female seahorse!

Christina Peters: Finding Plankton on Oregon II, July 13, 2013

NOAA Teacher at Sea
Chris Peters
Onboard NOAA Ship Oregon II
July 10 – 19, 2013

Mission: SEAMAP Summer Groundfish Survey
Geographic Area of Cruise: Gulf of Mexico, leaving from Pascagoula, MS
Date: July 13, 2013 

Weather and Location:
Time: 23:24 Greenwich Mean Time (7:24 p.m. in Rockville, MD)
Latitude:  25.5340
Longitude:  -82.0215
Speed (knots):  9.30
Water temperature:  28.90 degrees Celsius
Salinity (PSU = Practical Salinity Units): 35.38
Air temperature:  31.20 degrees Celsius
Relative Humidity:  65%
Wind Speed (knots):  8.92
Barometric Pressure (mb): 1013.34
Depth (m) = 19.20

Science and Technology Log

Our Mission

In my introduction I explained that SEAMAP is a state, federal, and university program.  In fact, there is a managing unit called the SEAMAP– Gulf Subcommittee of the Gulf States Marine Fisheries Commission’s Technical Coordinating Committee who manages the activities and operations, including collecting samples and interpreting data, of the Gulf participants, including the Mississippi Laboratory of NOAA and the states of Louisiana, Mississippi,Texas, Alabama, and Florida, as well as certain universities.  Parts of the program include bottom trawls, CTD deployment, and Bongo and Neuston tows.  The bottom trawls involve towing nets at randomly selected spots for ten to thirty minutes. The sea life caught in the nets, normally shrimp and other animals that live at the bottom of the Gulf, are sorted, identified and measured.  All of the data is recorded and helps to determine where the fish and shrimp are, and how much exists in the Gulf.  Because the NOAA Laboratory and the states have worked so well together on this project, most of the trawls were completed on earlier legs of the trip and on the state boats.  We have had opportunities, though, to observe and identify some of the fish from an earlier leg that had been put on ice.  We’ll come back to that process a bit later.

The first twenty-four hours underway were spent heading to our first station, off the southwest coast of Florida.  We have spent much of our time on this leg of the trip completing plankton collections.  My students should remember that plankton includes small and microscopic (too small to see with only your eyes) organisms. The organisms may be animals, plants and plant-like organisms, or bacteria.  The plankton found in the water can tell what the animal population looks like, or will look like if the conditions of the water do not change too much.  Plankton is also a source of food for certain animals, so looking at plankton can give us information about whether enough of a food source is present for those animals.  The purpose of the Bongo and Neuston tows is to collect plankton.  Before we do those tows at each station, however, we deploy the CTD to collect some important information.

Bringing in the CTD
A scientist and deckhand help bring in the CTD
Taking water samples from the CTD
The chief scientist, Kim Johnson, takes water samples from the CTD to verify it’s dissolved oxygen readings.

CTD stands for Conductivity, Temperature, and Depth.  The machine collects data in those areas, as well as other data.  The conductivity data tells how much salt (salinity) is in the water because the amount of salt affects how well the water will conduct (allow to pass through) electricity.  The CTD also measures the oxygen content of the water.  Remember learning about algae bloom in the Chesapeake Bay, and how the algae sucks up all of the oxygen, leaving the plants and animals in the area to die?  When a body of water has an unhealthy level of oxygen, it is called hypoxic.  Scientists are worried about the same kind of thing happening in the Gulf of Mexico, so determining the oxygen content in the water provides important information.  In the stations we have tested so far, the oxygen content has been healthy.  However, we have been far from land and much closer to where the Atlantic Ocean meets the Gulf.  To learn more about hypoxia in the Gulf of Mexico, visit NOAA’s hypoxia page.  Don’t forget to click on the links at the bottom that will take you to descriptions of the problems and causes of hypoxia in the Gulf.

After bringing the CTD back onto the deck, it is time to start a Neuston tow.  The Neuston net is very fine, and attaches to a one meter by two meter frame at the top.  The net gets narrower, and attaches to a “cod end”, a plastic cylinder with screened openings, at the bottom.  This is hoisted out of the boat and into the water by a crane.  It takes several people to launch the Neuston, as the frame is heavy, and it can be hard to manage in the wind.

Neuston net before deployment
The Neuston net is tied down to the boat until it is ready to be deployed.

The Neuston is pulled through the water, with about a foot above the surface, and the rest below.  The purpose is to collect plankton on or near the surface of the water.  Since sargassum, or seaweed, often floats on the surface of the water, sometimes the Neuston collects a lot of that.  We continue to tow the net for ten minutes, and then retrieve it into the boat, again using the crane.  While we did not do trawls and pull in large fish, we did see different kinds of baby fish at almost every station.

Neuston net
The Neuston net is dragged at the top of the water for five to ten minutes

The Bongo contains two 61 centimeter, circular, sturdy plastic frames, to which fine nets are attached.  These nets also narrow to a small area, to which cod ends are attached.  The Bongos are lowered off the port side by using the J frame. The bongos are towed from the surface to the bottom, but no deeper than 200 meters.  The bongo also has the flowmeters on it to calculate how much water passes through the net. The sample is used to estimate the populations, number, and location of animals in parts of the Gulf.  The Bongo also has instruments attached to it that measure temperature, salinity (salt), and depth.  In addition, the bongos have flowmeters attached to calculate how much water passes through the nets.

Bongo nets
The Bongo nets must be rinsed down before being brought into to boat to make sure no plankton is stuck at the top of the nets.

These are complicated tools, and some of the instruments are electronic.  If the instruments are not working correctly, the scientists and engineers must have a back-up plan.  In fact, at one station, the Bongo instruments were not giving accurate readings when the head of the watch (the scientist in charge) looked at the readings from inside.  The back-up plan was for the deckhands to use less accurate depth finding instruments when lowering the Bongo.  This can sometimes present a problem because if the instruments are off, and the Bongo drags on the bottom, a lot of mud can end up in the sample.  Fortunately, a little troubleshooting, in the form of tightening some connections, solved the problem.  Sometimes it’s easy to forget to check the obvious!

Once the Neuston and Bongo are up, we can detach the cod ends, and get to work preserving the plankton samples.  The plankton from the Neuston, and from each of the Bongo cod ends, are preserved and stored separately.  The Neuston and right Bongo plankton are rinsed through a very fine sieve with a chemical solution that is mostly ethanol, and then poured through a funnel into a jar, which is finally filled with the ethanol solution.  The left Bongo plankton is handled similarly, but instead of being stored in ethanol, it is stored in salt water from the Gulf, and a small amount of formalin.  Formalin contains a small amount of formaldehyde, and is used to preserve tissues.  It is a toxic chemical that is harmful to humans, and must be handled very carefully, always using gloves.  The samples are later sent to various laboratories to be sorted and counted.  In addition to providing information about amount and location of different species, scientists can also use the preserved plankton to determine the age, as specific as the number of days old, and genetics of the baby sea animal. The formalin helps preserve the otoliths a LOT better, where the ethanol helps preserve the tissue and/or DNA better.  The otolith is part of the inner ear of the animal and is the part that is used to determine age.

Work station at the stern of the boat
The work station at the stern of Oregon II is where we rinse the plankton and add the chemicals for preservation.
Rinsing the plankton
Sometimes we have to remove jellyfish from our samples. The plankton must be rinsed off the jellyfish before counting and discarding them.

With stations normally being about three hours apart, it would seem like we should have a lot of down time.  However, when there is a lot of sargassum in the Neuston, it must be rinsed to try to get the plankton out of it.  This can take quite a long time.  In addition, sometimes we do get small fish or other animals that need to be sorted, counted, measured and weighed.

Sargassum
There were over 300 of these file fish in one plankton sample. The color made them difficult to find in the sargassum.
A pipe fish from one of the Neuston samples.  What does it remind you of?
A pipe fish from one of the Neuston samples. What does it remind you of?
Plankton sample
This is a plankton sample from a Neuston tow after it has been preserved in ethanol.

Don’t forget to track our progress by visiting http://shiptracker.noaa.gov/shiptracker.html and choosing Oregon II.  While you are there, don’t forget to check out the different types of maps available for tracking Oregon II.  Look in the upper left-hand corner (Streets, Topo, Imagery, NOAA Nautical Charts, and Weather).

Personal Log

Settling in and enjoying the ride

The first three days of the trip had us motoring through incredibly calm waters and sunny days.  Some of the veteran crew members commented that they had never seen the Gulf so calm.  As we traveled further from Pascagoula, the water started getting bluer and bluer.  It is hard to describe the deep blue that we sailed through and the camera just doesn’t seem to capture it.  As we left the waters around Pascagoula, we saw many large ships, possible oil tankers, and quite a few oil rigs.  However, once we passed them, we’ve barely seen another boat.  It is something to look out from the bow of the boat and see nothing but water in every direction.

A calm day in the Gulf of Mexico

As promised, the food on board is delicious. The cooks take great pride in the food they serve, and there are always choices at every meal.  We’ve had beef tenderloin, veal parmesan, omelets, fresh fruit, fresh vegetables, pasta, Mexican, chocolate custard pie, cookies, pecan pie – all homemade!  The galley is also well-stocked with snacks.  Meals are served on a strict schedule – about an hour and a half for each meal.  However, if you know you will miss a meal, the cooks are happy to set some food aside for you, nicely wrapped in the refrigerator.  Luckily for me, I have the day shift, and if I miss a meal, it is normally breakfast.

Everyone on the ship has been very encouraging and helpful.  Some of the guys did a dive and brought me back some interesting shells to share with my students.  The other scientists have been incredibly patient and helpful.  Kim, the chief scientist, is a great teacher and is always looking for opportunities for me to learn something new, or practice something I just learned!

Did you know?

The starboard side of the ship is the right side, and the port side is the left side.  Starboard comes from the old Anglo-Saxon word, “steorbord” because the steering oar was on the right side of the boat.  Because of this, the ship would pull up to the dock, or port, on the left side. This would avoid damaging the steering oar.

Questions for my students:

What unit of measurement do you think we use to measure the small fish found in the Neuston and Bongo tows?

Can you think of any sea animals that use plankton as their main source of food?  It is okay to research this before you answer!

Thank you for visiting my blog.  I hope you will check back in a few days for an update!

Sarah Boehm: The Dead Zone, July 5, 2013

NOAA Teacher at Sea
Sarah Boehm
Aboard NOAA Ship Oregon II
June 23 – July 7, 2013 

Mission: Summer Groundfish Survey
Geographic area of cruise: Gulf of Mexico
Date: July 5, 2013

Weather at 19:13
Air temperature: 26°C (79°F)
Barometer: 1017mb
Humidity: 93%
Wind direction: 135°
Wind speed: 18 knots
Water temp: 27°C
Latitude : 28° 44’ N
Longitude: 85° 32’ W

Science and Technology Log

Mr. Cummiskey, the other science teacher at CDCPS, asked if we saw an influence from farming along the Mississippi River in the Gulf ecosystem. At first it seems crazy that something happening over a thousand miles away can have an impact on an ecosystem as vast as the Gulf of Mexico, but it really is happening and part of our research is to monitor the effects. The first clue I had that something was changing was the color of the water. In the deep waters off Texas the water was a beautiful clear blue. As we got closer to the Mississippi delta the sea water turned a murky brown–a mix of mud brought down by the river and the phytoplankton that was thriving in the nutrient dense waters. Just like eating too much food is bad for people’s health, too many nutrients is actually bad for an ecosystem.

CTD
The CTD instrument. The bottles on the top collect water and the instruments on the bottom take measurements.

Each time we get to a sampling station we start by taking measurements of the water quality with the CTD (conductivity temperature and depth). From the bridge the officers control the ship to keep it in one place. Then the deck crew uses a winch and pulley system to move the heavy CTD equipment overboard and down into the water almost to the sea floor. All the way down and back up the machine is taking dozens of readings a second that are transmitted back to a computer in the dry lab.

The CTD records the depth, water temperature, the salinity (how salty the water is), and the dissolved oxygen. We are most concerned with the oxygen level because it greatly impacts the organisms living in the water. Fish and marine invertebrates breathe oxygen molecules that are mixed in with the water. Without enough dissolved oxygen in the water they will suffocate and die. Healthy levels in the Gulf of Mexico are 4 to 6 milligrams of O2 per liter of water.  If there is less than 2 mg/L it is considered hypoxic, meaning there is not enough oxygen. This map uses the data we have collected this cruise to show dissolved oxygen levels in the bottom waters of the Gulf. The green and yellow colors shows the healthy areas, the orange areas are hypoxic.

Click on the map for a larger version. The map is updated as new data comes in.

hypoxia map

See those orange areas in close to the coast of Louisiana? That is known as the Dead Zone. Runoff of fertilizer and other nutrient sources wash down rivers and out to sea where they contribute to algae blooms. When the algae dies it sinks and is decomposed, a process that uses up a lot of oxygen. Check out this video to learn more. All my 6th graders should notice similarities between this situation and the virtual pond we worked with this spring.

Hypoxia video

Not only do the oxygen levels change, but the composition of the fish trawls changed dramatically too.  At station #144 we had an oxygen reading of 3 mg/L and an average sized trawl (26 kg) with a variety of species. At station #146 we had an oxygen reading of 1 mg/L (which is hypoxic) but pulled up a huge net of fish that filled 18 buckets. The total weight was 340 kg, but over 300 kg was just two species – croaker and butterfish. We were surprised by this catch and so did another oxygen reading and found while our nets started in hypoxic waters, during the 30 minute trawl we moved into better water with 3 mg/L of oxygen .  At station #147 we had a very low oxygen reading of only 0.2 mg/L. Our trawl only brought up 1.7 kg, most of which were jellies and crabs with just a few little fish.  There just wasn’t enough oxygen to support more life. Why was station #146 so huge? As the low oxygen waters spread out from the Mississippi River delta, critters were fleeing the hypoxia zone and moving to better water. So along the edge of the dead zone is an area with high population density; the oxygen refugees and the fish swooping in to eat them.  However, not all creatures can move themselves out of the way. Creature like bivalves and gastropods (clams and snails) don’t have the capability to move much and so get caught in the annual hypoxic zone of the Gulf.

big catch
Bringing up the big catch at station 146

Hypoxia zones caused by nutrient runoff from fertilizer and other man-made sources do not just happen in the Gulf of Mexico. They have also been recorded in the Chesapeake Bay, Long Island Sound and at the mouths of rivers around the world. They can also happen in fresh water ponds and lakes.

The CTD is our main method of recording oxygen levels, but we need to make sure it is functioning properly. So each day we also take a water sample and use a titration method to find the amount of dissolved oxygen. Check out the colorful chemical reactions in this video.

Personal Log

People, like fish, need oxygen and water to survive. Out on the ship oxygen in the air is easy to come by, but fresh water is another story. We are surrounded by water of course, but cannot drink the salt water. I tracked down out Chief Engineer, Sean Pfarrer, to find out more about where all the fresh water on board comes from.

RO
The reverse osmosis machine

Down in the engine room there is a reverse osmosis machine that processes salt water and turns it into fresh water. The salt water is pumped into the machine under 950 psi of pressure. The pressurized water is forced through a selectively permeable membrane that lets water molecules through, but not the larger salt molecules. (My 6th graders should find this all sounding familiar) The super salty water left behind is pumped back out to sea, and the fresh water is used on board. Our sinks, showers and laundry all use fresh water. We go through about 1,000 gallons a day, which is close to the 1,200 gallon limit of the RO system (but only about half what 30 average Americans would use on land). To conserve fresh water the heads (toilets in sailor speak) flush with salt water.

RO element
A rod from the RO machine. Water is pumped in the tube and forced through the yellow filter.

Which brings me to one of my favorite science teacher topics – poop. Thirty people over the course of fifteen days generate a fair amount of waste. What happens to all that poop? Just emptying it into the water would be harmful to the marine environment, so we have a little waste water treatment system right on board. When you flush, it all goes down to the marine sanitation device where poop eating bacteria consume our waste.  The waste water then passes by chlorine tablets that kill any bacteria before it gets dumped into the sea. I’ll admit I’m a little fascinated by the systems and technology that keeps our floating community operating in a rather comfortable fashion.

We completed our science work this afternoon and are now heading back to port. Check out the Ship Tracker to see where we have been.

CDCPS Science Students:

How did sailors long ago during the age of exploration deal with the drinking water problem?

What do you think we could do to lessen the hypoxia problem in the Gulf?