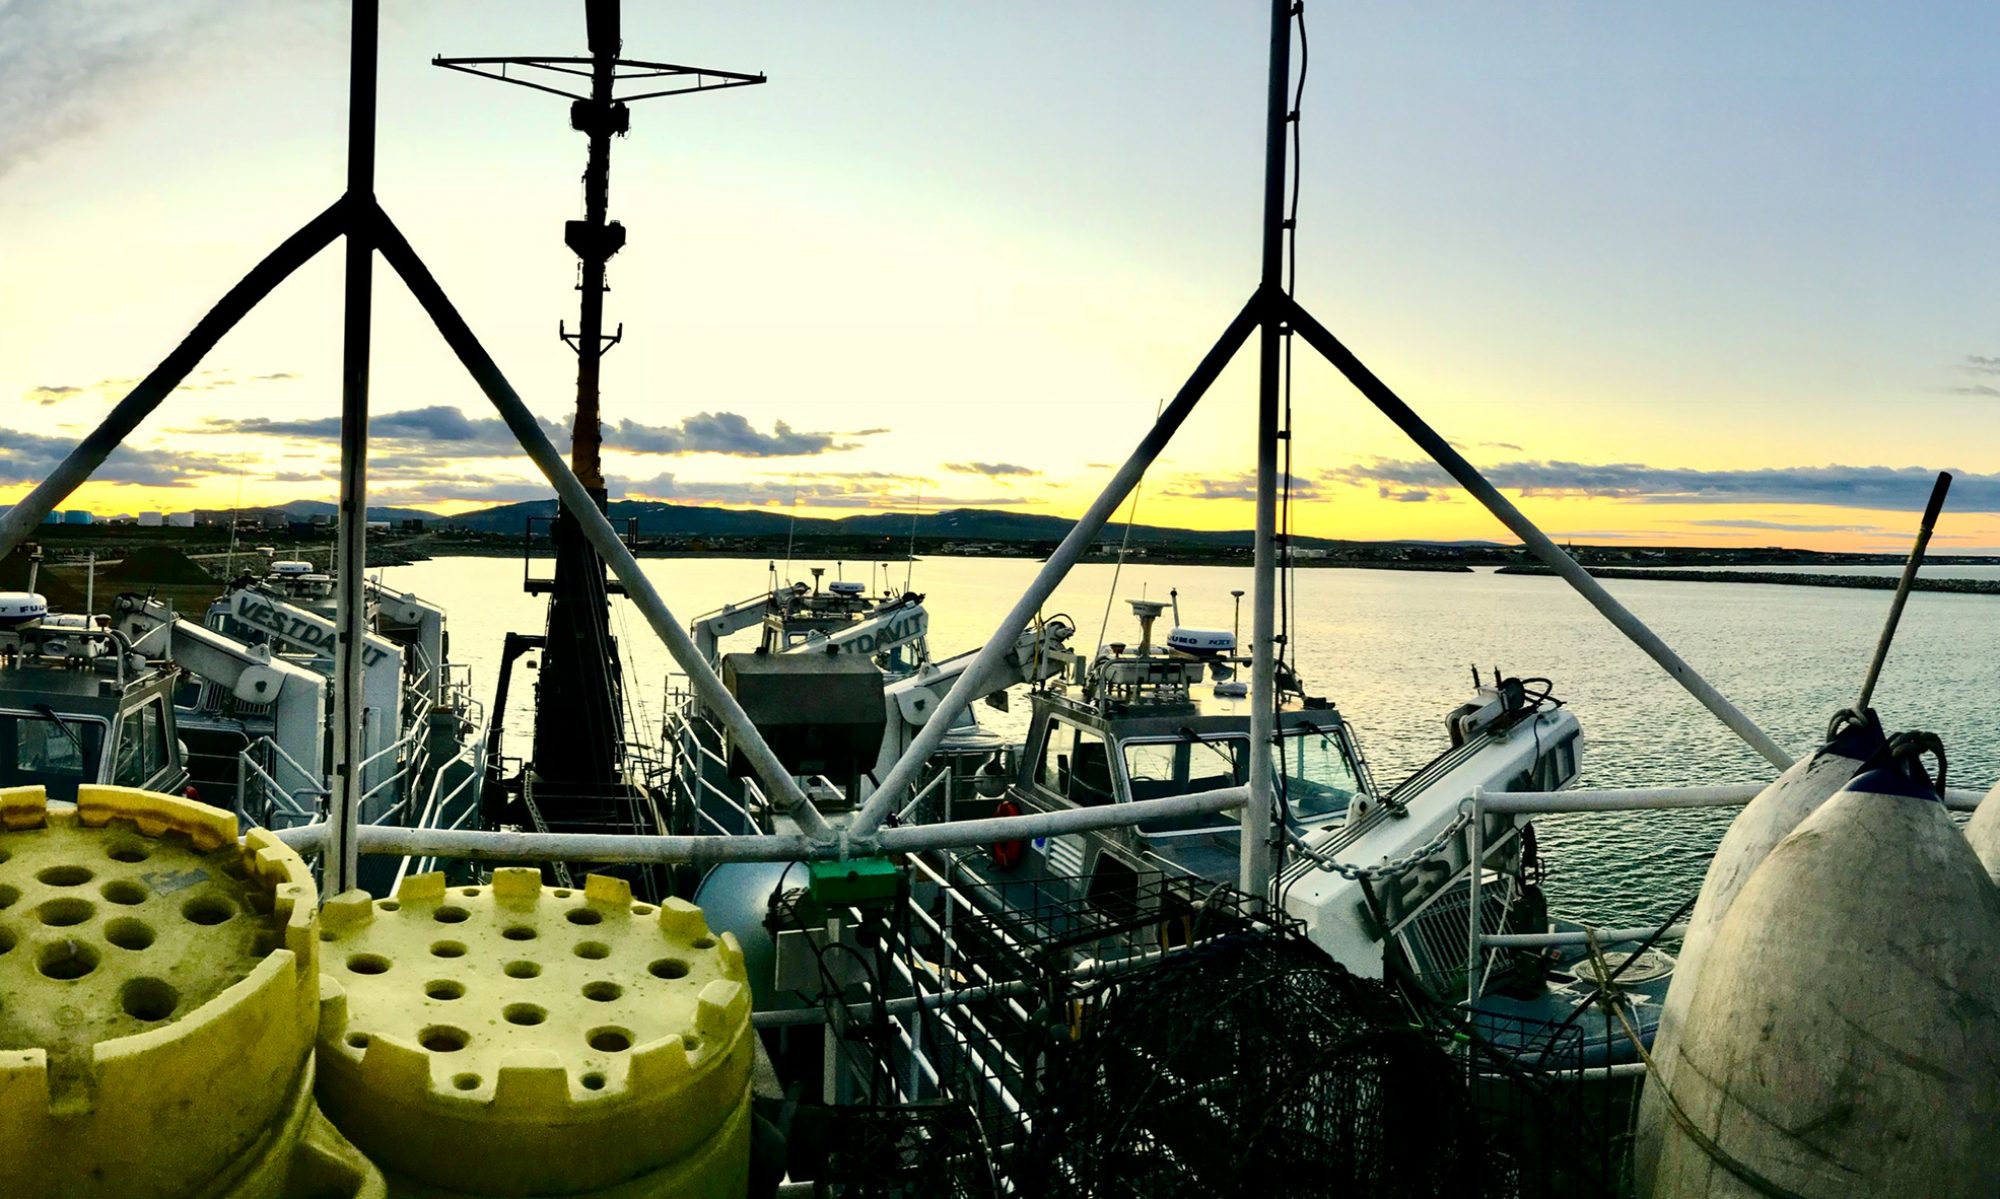
Kathleen Harrison: Shumagin Islands, July 9, 2011

NOAA Teacher at Sea
Kathleen Harrison
Aboard NOAA Ship  Oscar Dyson
July 4 — 22, 2011

Location:  Gulf of Alaska
Mission:  Walleye Pollock Survey
Date: July 9, 2011

Weather Data from the Bridge
True wind direction:  59.9°, True wind speed:  11.44 knots
Sea Temperature:  9°C
Air Temperature:  8.9°C
Air pressure:  1009.74 mb
Foggy with 1 mile visibility
Ship heading:  88°, ship speed:  11 knots

Science and Technology Log

The Shumagin Islands are a group of about 20 islands in the Gulf of Alaska, southwest of Kodiak Island.  They were named for Nikita Shumagin, a sailor on Vitus Bering’s Arctic voyage in 1741.  They are volcanic in origin, composed mostly of basalt.

Shumagin Islands
Bold and mountainous, the Shumagin Islands rise from the sea in the Gulf of Alaska.

Several islands even exhibit hexagonal basaltic columns.  There are about 1000 people who reside in the islands, mostly in the town of Sand Point, on Popof Island.  According to the United States Coast Pilot (a book published by NOAA with extensive descriptions about coastlines for ship navigation), the islands extend out 60 miles from the Alaskan Peninsula.  They are bold and mountainous.

hexagonal basalt
When this island formed, volcanic lava cooled into basalt hexagonal columns.

The shores are broken in many places by inlets that afford good anchorages.  The shores are rockbound close to.  Fishing stations and camps are scattered throughout the group, and good fishing banks are off the islands.  Fox and cattle raising are carried on to some extent.

long range view of SI, Alaskan Peninsula
Shumigan Islands to the left, snow covered peaks of Alaskan Peninsula in background. An amazing sight on a rare sunny day in the Gulf of Alaska.

Sea water quality is very important to the scientists on the Oscar Dyson.  So important, that it is monitored 24 hours a day.  This is called the Underway System.  The sea water comes through an intake valve on the keel of the bow, and is pumped up and aft to the chem lab.  There, it goes through 4 instruments:  the fluorometer, the dissolved Oxygen unit, the Thermosalinograph (TSG), and the ISUS (nitrate concentration).

The fluorometer measures the amount of chlorophyll and turbidity in the sea water once every second.  A light is passed through the water, and a sensor measures how much fluorescence (reflected light) the water has. The amount of chlorophyll is then calculated.  The measurement was 6.97 µg/L when I observed the instrument.  The amount of  phytoplankton in the water can be interpreted from the amount of chlorophyll.  Another sensor measures how much light passes through the water, which gives an indication of turbidity.  Twice a day, a sample of water is filtered, and the chlorophyll is removed.  The filter with the chlorophyll is preserved and sent to one of the NOAA labs on land for examination.

chem lab
Here are all of the water quality instruments, they are mounted to the wall in the chem lab. Each one has a separate line of sea water.

The next instrument that the water passes through will measure the amount of dissolved oxygen every 20 seconds.  Oxygen is important, because aquatic organisms take in oxygen for cellular respiration.  From plankton to white sharks, the method of underwater “breathing” varies, but the result is the same – oxygen into the body.  The oxygen in the water is produced by aquatic plants and phytoplankton as they do photosynthesis, and the amount directly affects how much aquatic life can be supported.

The TSG will measure temperature, and conductivity (how much electricity passes through) every second, and from these 2 measurements, salinity (how much salt is in the water) can be calculated.  The day that I observed the TSG temperature was 8.0°  C, and the salinity was 31.85 psu (practical salinity units).  Average sea water salinity is 35.  The intense study of melting sea ice and glaciers involves sea water temperature measurements all over the world.  A global data set can be accumulated and examined in order to understand changing temperature patterns.

instrument to measure
This instrument measures the amount of nitrate in the sea water. It is called the ISUS.

The last instrument measures nitrate concentration in the sea water every couple of minutes.  It is called ISUS, which stands for In Situ Ultraviolet Spectrophotometer.  Nitrate comes from organic waste material, and tends to be low at the surface, since the wastes normally sink to the bottom.  The normal value is .05 mg/L, at the surface, at 8°C.  Values within the range of 0.00 to 25 mg/L are acceptable, although anything above 5 is reason for concern.

All of the data from these instruments is fed into a ship’s computer, and displayed as a graph on a monitor.  The Survey Technician monitors the data, and the instruments, to make sure everything is working properly.

New Species Seen today:

Whale (unknown, but probably grey or humpback)

Horned Puffin

Dall’s Porpoise

Krill

Chum Salmon

Eulachon

monitor shows current data
The current water quality data is shown on this computer screen beside the instruments.

Personal Log

Living on a ship is quite different from living at home.  For one thing, every item on the ship is bolted, strapped, taped, or hooked to the bulkhead (wall), or deck (floor).  Most hatches (doors) have a hook behind them to keep them open(this reminds me of when I put hooks behind my doors at home to keep little children from slamming them and crushing fingers).  Some hatches (around ladderways (stairwells)) are magnetically controlled, and stay open most of the time.  They close automatically when there is a fire or abandon ship situation or drill.  Every drawer and cabinet door clicks shut and requires moving a latch or lever to open it.  For some cabinet doors that you want to stay open while you are working in the cabinet, there is a hook from the bulkhead to keep it open.

bracket holds copier
The copier machine is held in place by a 4 post bracket that is bolted to the floor.

On every desk is a cup holder, wider on the bottom than the top, designed to hold a regular glass or a cup of coffee.  If one of those is not handy, a roll of duct tape works well for a regular glass.  All shelves and counters have a lip on the front, and book shelves have an extra bar to hold the books in.  Trash cans and boxes are lashed to the bulkhead with an adjustable strap, and even the new copier machine has a special brace that is bolted to the deck to hold it in one place (I heard that the old copier fell over one time when there was a particularly huge wave).  There are lots of great pictures on the bulkheads of the Oscar Dyson, and each one is fastened to the bulkhead with at least 4 screws, or velcro.  There are hand rails everywhere – on the bulkhead in the passageway (hallway) (reminds me of Mom’s nursing home), and on the consoles of the bridge.

hallway hand rails
This view down the hall shows the hand rail. It comes in handy during rough weather.

Desk chairs can be secured by a bungee cord, and the chairs in the mess (dining room)  can be hooked to the deck.

Another thing that is different from home is the fact that the Oscar Dyson operates 24-7 (well, in my home, there could easily be someone awake any hour of the night, but the only thing they might operate is the TV). The lights in the passageways and mess are always on.  The acoustics and water quality equipment are always collecting data.  Different people work different shifts, so during any one hour, there is usually someone asleep.  Most staterooms have 2 people, and they will probably be on opposite shifts.  One might work 4 am to 4 pm, and the other would work 4 pm to 4 am.  That way, only one person is in the room at a time (there is not really room for more than one).  There is always someone on the bridge – at least the Officer of the Deck (OOD) – to monitor and steer the ship.  During the day, there is usually a look out as well.

binoculars on the bridge
These binoculars are used by the look out to scan the surrounding area for anything in the water - whales, boats, islands, kelp, or anything else in proximity to the ship.

His job is to, well, look out – look for floating items in the water, whales, rocks, and other ships (called contacts or targets).  This helps the OOD, because he or she can’t always keep their eyes on the horizon.

I have thoroughly enjoyed living on the Oscar Dyson (we have had calm seas so far), and talking with the NOAA staff and crew.  They are ordinary people, who have chosen an extraordinary life – aboard a ship.  It has challenges, but also great rewards – seeing the land from a different perspective, being up close to sea life, and forging close relationships with shipmates, as well as participating in the science that helps us understand the world’s oceans.

Steven Wilkie: July 3, 2011

NOAA TEACHER AT SEA
STEVEN WILKIE
ONBOARD NOAA SHIP OREGON II
JUNE 23 — JULY 4, 2011

Mission: Summer Groundfish Survey Geographic Location: Northern Gulf of Mexico Date: July 3, 2011 Ship Data

Latitude 29.27
Longitude -94.39
Speed 9.30 kts
Course 298.00
Wind Speed 6.70 kts
Wind Dir. 281.88 º
Surf. Water Temp. 29.90 ºC
Surf. Water Sal. 24.88 PSU
Air Temperature 29.30 ºC
Relative Humidity 75.00 %
Barometric Pres. 1015.75 mb
Water Depth 15.70 m

Science and Technology Log

One of the first expeditions devoted to the study of the world’s oceans was that of the H.M.S. Challenger.  This voyage covered a distance of more than 68,000 nautical miles.   Although other expeditions prior to the Challenger expedition would periodically collect data about the ocean environment, none were devoted solely to the exploration of the chemical, biological and physical attributes of the oceans.

The Voyage of the HMS Challenger
The HMS Challenger’s voyage spanned 4 years and covered close to 70,000 nautical miles.
A sounding device used by the Challenger expedition. This weighted line would be lowered over the side of the ship and the amount of line let out would indicate depth.

If you have read my previous posts, you know how important monitoring the abiotic factors are.  This was no different aboard the Challenger expedition.

And remember it took 23 years to process and publish all of the data, well with the help of computers and the internet, the Oregon II’s data is available in hours.

Michael Hendon (lead scientist) performs a winkler titration to determine dissolved oxygen content. See wet chemistry skills are still important!

Although technology plays a pivotal role in collecting and analyzing the data, computers still need to be cross referenced against tried and true scientific processes.  In order to ensure that all of the CTD equipment is accurate, random water samples are pulled using the CTD’s sample bottles.  A chemical titration, known as the Winkler titration is used to determine the amount of dissolved oxygen present in the water samples.

The method for sampling the living organisms along the bottom of the seafloor has not changed much since the Challenger expedition.  Trawl nets are still the name of the game, although the way they are deployed might vary a bit!

Mike and Cliff bring the Oregon II's trawl aboard complete with catch.

Once the catch is on board, the process begins to collect data (remember that is why NOAA is out here) to better understand how populations are changing in order to set catch limits and analyze human impact.  In the day’s of the Challenger expedition, the work of analyzing samples and collecting their would have been done in a lab aboard ship, and we rely on similar if not more automated facilities onboard the Oregon II.  Follow this link to take a virtual tour of the Challenger’s “Wet lab”. The wetlab onboard the Oregon II is where I spend the majority of my 12 hour watch.   It is here that the catch is brought after we bring it on deck, we sort the catch, count and measure a subsample of what is brought on board.  If we had to measure everything that came up with the net we would never get finished.  By taking a subsample we can split the catch into percentages depending on the weight of the entire catch and count a smaller sample of the catch.  This subsample’s diversity can then be used as a basis for the entire catch.  This saves time and effort on our part and still provides an accurate representation of what was in the net.  A few species are selected to be counted in their entirety, that includes all commercially important shrimp (brown shrimp, pink shrimp and white shrimp) and all red snapper.  We will also pull organisms into our subsample that are unique to the catch such as sharks, rays, skates etc.

Now I am not quite sure how the Challenger expedition determined where it would sample and when, perhaps if they saw something interesting they would simply drop their nets in the water, but with the Oregon II, the sampling sites are predetermined and the method to set up those sites is quite sophisticated.  In order to ensure that the cruise covers the majority of the Gulf of Mexico NOAA uses a method known as independent random sampling.  This method uses a computer program to randomly select stations based on depth data, and spatial area.  By choosing random samples independently, the scientists can rest assured that they haven’t purposefully singled out an area with “good fishing” or “bad fishing” and that the data they collect will represent a more accurate count of the actual fish populations in the Gulf of Mexico.

Steven Wilkie: June 26, 2011

NOAA TEACHER AT SEA
STEVEN WILKIE
ONBOARD NOAA SHIP OREGON II
JUNE 23 — JULY 4, 2011

Mission: Summer Groundfish Survey
Geographic Location: Northern Gulf of Mexico
Date: June 26, 2011

Ship Data:

Latitude 26.56
Longitude -96.41
Speed 10.00 kts
Course 6.00
Wind Speed 4.55 kts
Wind Dir. 150.72 º
Surf. Water Temp. 28.30 ºC
Surf. Water Sal. 24.88 PSU
Air Temperature 29.20 ºC
Relative Humidity 78.00 %
Barometric Pres. 1012.27 mb
Water Depth 115.20 m
Before getting down to work, it is important to learn all precautionary measures. Here I am suited up in a survival suit during an abandon ship drill.

Science and Technology Log

After two days of travel we are on site and beginning to work and I believe the entire crew is eager to get their hands busy, myself included.   As I mentioned in my previous post, it is difficult if not impossible to separate the abiotic factors from the biotic factors, and as a result it is important to monitor the abiotic factors prior to every trawl event.  The main piece of equipment involved in monitoring the water quality (an abiotic factor) is the C-T-D (Conductivity, Temperature and Depth) device.  This device uses sophisticated sensors to determine the conductivity of the water, which in turn, can be used to measure salinity (differing salinities will conduct electricity at different rates).   Salinity influences the density of the water: the saltier the water the more dense the water is.  Density measures the amount of mass in a specific volume, so if you dissolve salt in a glass of water you are adding more mass without much volume.  And since Density=Mass/Volume, the more salt you add, the denser the water will get.   Less dense objects tend to float higher in the water column than more dense objects, so as a result the ocean often has layers of differing salinities (less salty water on top of more salty water).  Often you encounter a boundary between the two layers known as a halocline (see the graph below for evidence of a halocline).

Temperature varies with depth in the ocean, however, because warm water is less dense than cold water. When liquids are cold, more molecules can fit into a space than when they are war; therefore there is more mass in that volume.   The warm water tends to remain towards the surface, while the cooler water remains at depth.  You may have experienced this if you swim in a local lake or river.  You dive down and all of a sudden the water goes from nice and warm to cool. This is known as a thermocline and is the result of the warm, less dense water sitting on top of the cool more dense water.

Here is the fancy piece of technology that makes measuring water quality so easy: the CTD.

Temperature also influences the amount of oxygen that water can hold. The cooler the temperature of the water the more oxygen can dissolve in it.  This is yet another reason why the hypoxic zones discussed in my last blog are more common in summer months than winter months: the warm water simply does not hold as much oxygen as it does in the winter.

The CTD is also capable of measuring chlorophyll.  Chlorophyll is a molecule that photosynthetic organisms use to capture light energy and then use to build complex organic molecules that they can in turn be used as energy to grow, reproduce etc.  The more chlorophyll in the water, the more photosynthetic phytoplankton there is in the water column.  This can be a good thing, since photosynthetic organisms are the foundation of the food chain, but as I mentioned in my earlier blog, too much phytoplankton can also lead to hypoxic zones.

Finally the CTD sensor is capable of measuring the water’s turbidity.  This measures how clear the water is.  Think of water around a coral reef — that water has a very low turbidity, so you can see quite a ways into the water (which is good for coral since they need access to sunlight to survive).  Water in estuaries or near shore is often quite turbid because of all of the run off coming from land.

This is a CTD data sample taken on June 26th at a depth of 94 meters. The pink line represents chlorophyll concentration, the green represents oxygen concentration, the blue is temperature and the red is salinity.

So, that is how we measure the abiotic factors, now let’s concentrate on how we measure the biotic!  After using the CTD (and it takes less time to use it than it does to describe it here) we are ready to pull our trawls.  There are three different trawls that the scientists rely on and they each focus on different “groups” of organisms.

The neuston net captures organisms living just at the water's surface.

The neuston net (named for the neuston zone, which is where the surface of the water interacts with the atmosphere) is pulled along the side of the ship and skims the surface of the water.  At the end of the net is a small “catch bottle” that will capture anything bigger than .947 microns.  The bongo nets are nets that are targeting organisms of a similar size, but instead of remaining at the surface these nets are lowered from the surface to the seafloor and back again, capturing a representative sample of organisms throughout the water column.   The neuston net is towed for approximately ten minutes, while the bongo nets tow times are dependent on depth.   Once the nets are brought in, the scientists, myself included, take the catch and preserve it for the scientists back in the lab to study.

The bongo nets will capture organisms from the surface all the way down to bottom.

The biggest and baddest nets on the boat are the actual trawl nets launched from the stern (back) of the boat.  These are the nets the scientists are relying on to target the bottom fish.  This trawl net is often referred to as an otter trawl because of the giant heavy doors used to pull the mouth of the net open once it reaches the bottom.  As the boat moves forward, a “tickler” chain spooks any of the organisms that might be lounging around on the bottom and the net follows behind to scoop them up.  This net is towed for thirty minutes, and then retrieved and we spend the next hour or so sorting, counting and measuring the catch.

Here you can see the otter trawl net extending off the starboard side of the Oregon II. When lowered into the water the doors will spread the mouth of the net.
Personal Log
I thought that adjusting to a 12 hour work schedule would be tough, but with a 5-month old son at home I feel I am more prepared than most might be for an extended day.  I might go as far as to say that I have more down time now than I did at home!  Although the ship’s crew actually manages the deployment of the majority of the nets and C-T-D, the science team is always involved and keeping busy allows the hours to tick away without much thought.  Before you know it you are on the stern deck of the ship staring at a gorgeous Gulf of Mexico sunset.

As we steam back East, the sun sets in our stern every day, and we have been treated to peaceful ones thus far on this trip.
The sun has long since set.  As I write this it is well after midnight and my bunk is calling.

Kathy Schroeder, May 12, 2010

NOAA Teacher at Sea
Kathy Schroeder
Aboard NOAA Ship Oscar Dyson
May 5 – May 18, 2010

Mission: Fisheries Surveys
Geographical Area: Eastern Bering Sea
Date: May 12, 2010

5/12 Mooring Buoy

Launching a mooring buoy
Today we launched another type of buoy. It is called a Mooring Buoy. Its height is 5 meters above the surface (pictured on left) and 72 meters below the surface, which ends with a concrete dome that weighs 4110 (pictured on right). You can see the mooring being towed by the ship to get it into the right position. It has a barometer (measures atmospheric pressure), an anemometer (measures wind speed) and a thermometer on the top. There are sensors at different depths that measure salinity, chlorophyll, temperature, pressure, and nitrates.The information is transmitted to satellite Pacific Marine Environmental Lab (NOAA) that monitors the surface and subsurface of the Bering Sea. This piece of equipment costs $250,000. There are two other moorings already in this location. One measures ocean currents the other measures acoustic plankton. On one it has an underwater rain gauge. Can you figure out what that means? Headed to the Pribilof Islands today. On the way some crew saw sea ice. I’ll be looking! I love reading everyone’s comments. Keep them coming!

Kathy Schroeder, May 8, 2010

NOAA Teacher at Sea
Kathy Schroeder
Aboard NOAA Ship Oscar Dyson
May 5 – May 18, 2010

Mission: Fisheries Surveys
Geographical Area: Eastern Bering Sea
Date: May 8, 2010

CTD Water Samples 5/8

Today I was able to see a different type of equipment deployed. It is called a CTD (conductivity temperature depth). The CTD went down 150 meters. On the metal frame that holds the CTD are 12 water bottles with caps at each end. The frame is lowered with both end caps open.

Once at its depth the end caps are closed to take a water sample. This is then repeated at 5 different depths on its return to the surface. The water is then put into plastic containers of known volume, which are then taken to a filter (about the size of a quarter) that separates the microscopic plants called phytoplankton from the seawater. The filters with the phytoplankton are then frozen in small plastic vials to be sent to a lab in Seattle where they determine how much chlorophyll was on each filter. The amount of chlorophyll tells us how much phytoplankton was in the water at each depth. Another water sample taken from the CTD is to verify the salinity values measured by the CTD. We haven’t found much pollock the last few hauls. We are now finding Pacific cod, and of course krill and arthropods such as copepods, amphipods, barnacle nauplii. Amber spotted a Minke whale this morning. I hope to see one soon!