NOAA Teacher at Sea
Lindsay Knippenberg
Aboard NOAA Ship Oscar Dyson
September 4 – 16, 2011
Mission: Bering-Aleutian Salmon International Survey (BASIS) Geographical Area: Bering Sea Date: September 11, 2011
Weather Data from the Bridge Latitude: 58.00 N
Longitude: -166.91 W
Wind Speed: 23.91 kts with gusts over 30 kts
Wave Height: 10 – 13ft with some bigger swells rolling through
Surface Water Temperature: 6.3 C
Air Temperature: 8.0 C
Science and Technology Log
On a calm day letting out the CTD is easy.
Today Jeanette and Florence took me under their wing to teach me about the oceanographic research they are conducting onboard the Dyson. At every station there is a specific order to how we sample. First the transducer, then the CTD, then numerous types of plankton nets, and then we end with the fishing trawl. The majority of the oceanographic data that they collect comes from the CTD (Conductivity, Temperature, Depth). The CTD is lowered over the side of the ship and as it slowly descends to about 100 meters it takes conductivity, temperature, and depth readings. Those readings go to a computer inside the dry lab where Jeanette is watching to record where the pycnocline is located.
The results from the CTD. Can you spot where the pycnocline is?
The pycnocline is a sharp boundary layer where the density of the water rapidly changes. The density changes because cold water is more dense than warm water and water with a higher salinity is more dense than water that is lower in salinity. So as the CTD travels down towards the bottom it measures warmer, less salty water near the surface, a dramatic change of temperature and salinity at the pycnocline, and then colder, saltier water below the pycnocline. Once Jeanette knows where the pycnocline is, she tells the CTD to collect water at depths below, above, and at the pycnocline boundary. The water is collected in niskin bottles and when the CTD is back on deck Florence and Jeanette take samples of the water to examine in the wet lab.
Filtering out the chlorophyll from the CTD water samples.
Back in the lab, Jeanette and Florence run several tests on the water that they collected. The first test that I watched them do was for chlorophyll. They used a vacuum to draw the water through two filters that filtered out the chlorophyll from the water. As the water from the CTD passed through the filters, the different sizes of chlorophyll would get stuck on the filter paper. Jeanette and Florence then collected the filter paper, placed them in labeled tubes, and stored them in a cold, dark freezer where the chlorophyll would not degrade. In the next couple of days the chlorophyll samples that they collected will be ran through a fluorometer which will quantify how much chlorophyll is actually in their samples.
Jeanette collecting water from the CTD.
Besides chlorophyll, Jeanette and Florence also tested the water for dissolved oxygen and nutrients like nitrates and phosphates. All of these tests will give the scientists a snapshot of the physical and biological characteristics of the Eastern Bering Sea at this time of year. This is very important to the fisheries research because it can help to determine the health of the ecosystem and return of the fish in the following year.
Personal Log
One of the high points for me so far on the cruise has been seeing and learning about all the new fish that we catch in the net. We have caught lots of salmon, pollock, and capelin. The capelin are funny because they smell exactly like cucumbers. When we get a big catch of capelin the entire fish lab smells like cucumbers…it’s so weird. We have also caught wolffish, yellow fin sole, herring, and a lot of different types of jellyfish. The jellies are fun because they come in all different shapes and sizes. We had a catch today that had some hug ones and everyone was taking their pictures with them.
Now that is a big jelly fish.
Today we also caught three large Chinook or king salmon. Ellen taught me how to fillet a fish and I practiced on a smaller fish and then filleted the salmon for the cook. What is even cooler was that at dinner we had salmon and it was the fish that we had caught and I had filleted. Fresh salmon is so good and I think the crew was happy to get to enjoy our catch.
The catch of the day was a 8.5 kg Chinook salmon.Salmon for dinner, filleted by Lindsay.
NOAA Teacher at Sea Caitlin Fine Aboard University of Miami Ship R/V Walton Smith August 2 – 6, 2011
Mission: South Florida Bimonthly Regional Survey Geographical Area: South Florida Coast and Gulf of Mexico Date: August 4, 2011
Weather Data from the Bridge Time: 10:32pm
Air Temperature: 30°C
Water Temperature: 30.8°C
Wind Direction: Southeast
Wind Speed: 7.7knots
Seawave Height: calm
Visibility: good/unlimited
Clouds: clear
Barometer: 1012 nb
Relative Humidity: 65%
Science and Technology Log
As I said yesterday, the oceanographic work on the boat basically falls into three categories: physical, chemical and biological. Today I will talk a bit more about the chemistry component of the work on the R/V Walton Smith. The information that the scientists are gathering from the ocean water is related to everything that we learn in science at Key – water, weather, ecosystems, habitats, the age of the water on Earth, erosion, pollution, etc.
First of all, we are using a CTD (a special oceanographic instrument) to measure salinity, temperature, light, chlorophyll, and depth of the water. The instrument on this boat is very large (it weights about 1,000 lbs!) so we use a hydraulic system to raise it, place it in the water, and lower it down into the water.
Lindsey takes a CO2 sample from the CTD
The CTD is surrounded by special niskin bottles that we can close at different depths in the water in order to get a pure sample of water from different specific depths. Nelson usually closes several bottles at the bottom of the ocean and at the surface and sometimes he closes others in the middle of the ocean if he is interested in getting specific information. For each layer, he closes at least 2 bottles in case one of them does not work properly. The Capitan lowers the CTD from a control booth on 01deck (the top deck of the boat), and two people wearing a hard hat and a life vest have to help guide the CTD into and out of the water. Safety first!
Once the CTD is back on the boat, the chemistry team (on the day shift, Lindsey and I are the chemistry team!) fills plastic bottles with water from each depth and takes them to the wet lab for processing. Throughout the entire process, it is very important to keep good records of the longitude and latitude, station #, depth of each sample, time, etc, and most importantly, which sample corresponds to which depth and station.
We are taking samples for 6 different types of analyses on this cruise: nutrient analysis, chlorophyll analysis, carbon analysis, microbiology analysis, water mass tracers analysis and CDOM analysis.
The nutrient analysis is to understand how much of each nutrient is in the water. This tells us about the availability of nutrients for phytoplankton. Phytoplankton need water, CO2, light and nutrients in order to live. The more nutrients there are in the water, the more phytoplankton can live in the water. This is important, because as I wrote yesterday – phytoplankton are the base of the food chain – they turn the sun’s energy into food.
Sampling dissolved inorganic carbon
That said, too many nutrients can cause a sudden rise in phytoplankton. If this occurs, two things can happen: one is called a harmful algal bloom. Too much phytoplankton (algae) can release toxins into the water, harming fish and shellfish, and sometimes humans who are swimming when this occurs. Another consequence is that this large amount of plankton die and fall to the seafloor where bacteria decompose the dead phytoplankton. Bacteria need oxygen to survive so they use up all of the available oxygen in the water. Lack of oxygen causes the fish and other animals to either die or move to a different area. The zone then becomes a “dead zone” that cannot support life. There is a very large dead zone at the mouth of the Mississippi River. So we want to find a good balance of nutrients – not too many and not too few.
The chlorophyll analysis serves a similar purpose. In the wet lab, we filter the phytoplankton onto a filter.
I am running a chlorophyll analysis of one of the water samples
Each phytoplankton has chloroplasts that contain chlorophyll. Do you remember from 4th grade science that plants use chlorophyll in order to undergo photosynthesis to make their own food? If scientists know the amount of chlorophyll in the ocean, they can estimate the amount of phytoplankton in the ocean.
Carbon can be found in the form of carbon dioxide (CO2) or in the cells of organisms. Do you remember from 2nd and 4th grade science that plants use CO2 in order to grow? Phytoplankton also need CO2 in order to grow. The carbon dioxide analysis is useful because it tells us the amount of CO2 in the ocean so we can understand if there is enough CO2 to support phytoplankton, algae and other plant life. The carbon analysis can tell us about the carbon cycle – the circulation of CO2 between the ocean and the air and this has an impact on climate change.
The microbiology analysis looks for DNA (the building-blocks of all living organisms – kind of like a recipe or a blueprint). All living things are created with different patterns or codes of DNA. This analysis tells us whose DNA is present in the ocean water – which specific types of fish, bacteria, zooplankton, etc.
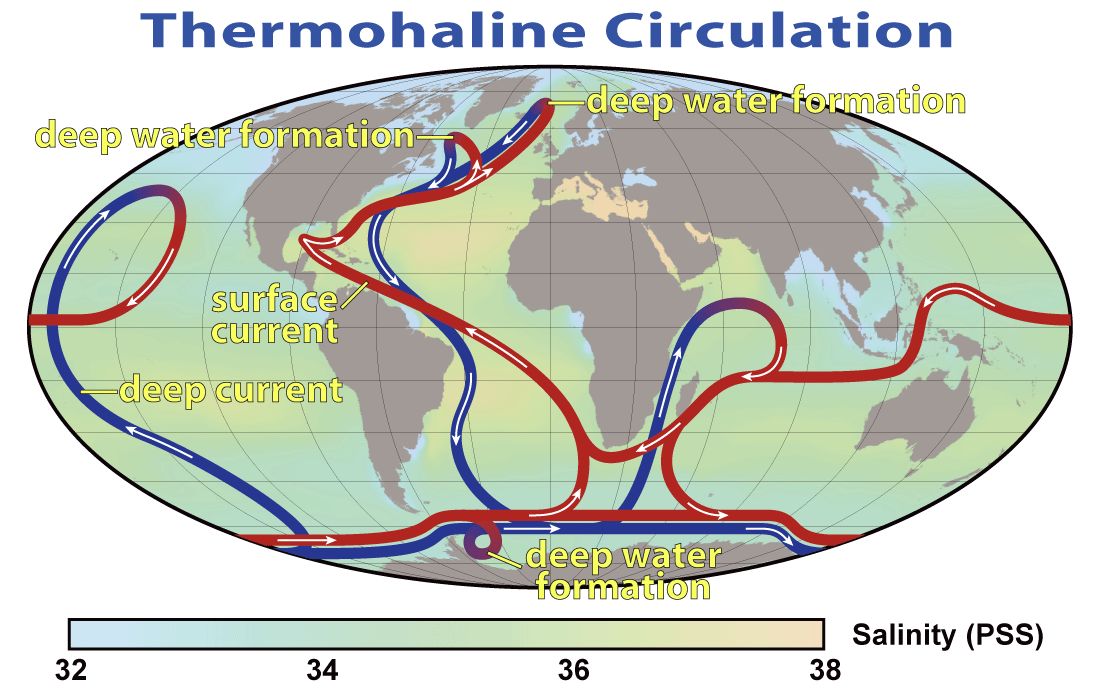
The water mass tracers analysis (on this boat we are testing N15 – an isotope of Nitrogen, and also Tritium – a radioactive isotope of Hydrogen) helps scientists understand where the water here came from. These analyses will help us verify if the Mississippi River water is running through the Florida Coast right now. From a global viewpoint, this type of test is important because it helps us understand about the circulation of ocean water around the world. If the ocean water drastically changes its current “conveyor belt” circulation patterns, there could be real impact on the global climate. (Remember from 2nd and 3rd grade that the water cycle and oceans control the climate of Earth.) For example, Europe could become a lot colder and parts of the United States could become much hotter.
This is an image of the conveyor belt movement of ocean currents
The last type of analysis we prepared for was the CDOM (colored dissolved organic matter) analysis. This is important because like the water mass tracers, it tells us where this water came from. For example, did the water come from the Caribbean Sea, or did it come from freshwater rivers?
I am coming to understand that the main mission of this NOAA bimonthly survey cruise on the R/V Walton Smith is to monitor the waters of the Florida Coast and Florida Bay for changes in water chemistry. The Florida Bay has been receiving less fresh water runoff from the Everglades because many new housing developments have been built and fresh water is being sent along pipes to peoples’ houses. Because of this, the salinity of the Bay is getting higher and sea grass, fish, and other organisms are dying or leaving because they cannot live in such salty water. The Bay is very important for the marine ecosystem here because it provides a safe place for small fish and sea turtles to have babies and grow-up before heading out to the open ocean.
Personal Log
This cruise has provided me great opportunities to see real science in action. It really reinforces everything I tell my students about being a scientist: teamwork, flexibility, patience, listening and critical thinking skills are all very important. It is also important to always keep your lab space clean and organized. It is important to keep accurate records of everything that you do on the correct data sheet. It can be easy to get excited about a fish or algae discovery and forget to keep a record of it, but that is not practicing good science.
It is important to keep organized records
It is also important to stay safe – every time we are outside on the deck with the safety lines down, we must wear a life vest and if we are working with something that is overhead, we must wear a helmet.
I have been interviewing the scientists and crew aboard the ship and I cannot wait to return to Arlington and begin to edit the video clips. I really want to help my students understand the variety of science/engineering and technology jobs and skills that are related to marine science, oceanography, and ships. I have also been capturing videos of the ship and scientists in action so students can take a virtual fieldtrip on the R/V Walton Smith. I have been taking so many photos and videos, that the scientists and crew almost run away from me when they see me pick up my cameras!
Captain Shawn Lake mans the winch
The food continues to be wonderful, the sunsets spectacular, and my fellow shipmates entertaining. Tomorrow I hope to see dolphins swimming alongside the ship at sunrise! I will keep you posted!!
Did you know?
The scientists and crew are working 12-hour shifts. I am lucky to have the “day shift” which is from 8am to 8pm. But some unlucky people are working the “night shift” from 8pm to 8am. They wake-up just as the sun is setting and go to sleep right when it rises again.
Animals seen today…
zooplankton under the dissecting microscope
– Many jellyfish
– Two small crabs
– Lots of plankton
A sampling of zooplankton
– Flying fish flying across the ocean at sunset
– A very small larval sportfish (some sort of bluerunner or jack fish)
Some moon jellyfish that we collected in the tow net
NOAA Teacher at Sea Caitlin Fine Onboard University of Miami Ship R/V Walton Smith August 2 – 6, 2011
Mission: South Florida Bimonthly Regional Survey Geographical Area: South Florida Coast and Gulf of Mexico Date: August 3, 2011
Weather Data from the Bridge
Time: 10:18pm
Air Temperature: 29.5°C
Water Temperature: 31.59°C
Wind Direction: North
Wind Speed: 3 knots
Seawave Height: calm
Visibility: good/unlimited
Clouds: Partially cloudy (cumulos and cirrus)
Barometer: 1011.0mb
Relative Humidity: 72%
Science and Technology Log
The oceanographic work on the boat can be divided into three categories: physical, chemical, and biological. In this log, I will explain a little bit about the part of the research related to the physics of light. Upcoming 5th graders – pay attention! We will be learning a lot about light in January/February and it all relates to this research project.
Brian and Maria are two PhD students who are working with the physical components. They are using several optical instruments: the SPECTRIX, the GER 1500, the Profiling Reflectance Radiometer (PRR), and the Profiling Ultraviolet Radiometer (PUV).
Brian and Maria take optic measurements with the SPECTRIX and GER 1500
The SPECTRIX is a type of spectroradiometer that measures the light coming out of the water in order to understand what is in the water. For example, we can measure the amount of green light that is reflected and red and blue light that is absorbed in order to get an idea about the amount of chlorophyll in the water. This is important because chlorophyll is the biggest part of phytoplankton and phytoplankton are tiny plant-like algae that form the base of the food chain on Earth.
Brian lowers PRR into the water
The PRR and the PUV measure light at different depths to also understand what is in the water and at what depth you will find each thing in the water. The light becomes less bright the further down you go in the water. Most of light is between 0-200 meters of depth. The light that hits the water also becomes less bright based upon what is in the water. For example, you might find that chlorophyll live at 10 meters below the surface. It is important to understand at what depth each thing is in the water because that tells you where the life is within the ocean. Most of the ocean is pitch-black because it is so deep that light cannot penetrate it. Anything that lives below the light level has to be able to either swim up to get food, or survive on “extras” that fall below to them.
Personal Log
These few days have been very fun and action-packed! I arrived on the ship on Sunday afternoon and helped Nelson and the crew get organized and set-up the stations for the cruise. Several other people had also arrived early – two graduate students who are studying the optics of the water as part of their PhD program, one college student and one observer from the Dominican Republic who are like me – trying to learn about what NOAA does and how scientists conduct experiments related to oceanography.
On Monday morning, we gathered for a team meeting to discuss the mission of the cruise, introduce ourselves, and get an updated report on the status of the Mississippi River water. It turns out that the water is going in a bit of a different direction than previously projected, so we will be changing the cruise path of the ship in order to try to intersect it and collect water samples.
I am helping lower the CTD into the water
Monday we all learned how to use the CTD (a machine that we use to collect samples of water from different depths of the ocean) and other stations at the first several stops. It was a bit confusing at the beginning because there is so much to learn and so many things to keep in mind in order to stay safe! We then ate lunch (delicious!) and had a long 4-hour ride to the next section of stops. When we arrived, it was low tide (only 2 ft. of water in some places) so we could not do the sampling that we wanted to do. We continued on to the next section of stops (another 3 hour ride away!), watched a safety presentation and ate another delicious meal. By this time, it was time for the night shift to start working and for the day shift to go to bed. Since I am in the day shift, I was able to sleep while the night shift worked all night long.
Today I woke up, took a shower in the very small shower and ate breakfast just as we arrived at another section of stops. I immediately started working with the CTD and on the water chemistry sampling. We drove through some sea grass and the optics team was excited to take optical measurements of the sea grass because it has a very similar optical profile to oil. The satellites from space see either oil or sea grass and report it as being the same thing. So scientists are working to better differentiate between the two so that we can tell sea grass from oil on the satellite images. The images that Maria and Brian took today are maybe some of the first images to be recorded! Everyone on the ship is very excited!
Several hours later, we came to a part of the open ocean within the Florida Current near Key West where we believe water from the Mississippi River has reached. Nelson and the scientific team believe this because the salinity (the amount of dissolved salt) of the surface water is much lower than it normally is at this time of year in these waters. Normally the salinity is about 36-36.5 PSUs in the first 20 meters and today we found it at 35.7 PSUs in the first 20 meters. This may not seem like a big difference, but it is.
The water from the Mississippi River is fresh water and the water in the Florida Keys is salt water. There is always a bit of fresh water mixing with the salt water, but usually it is not enough to really cause a change in the salinity. This time, there is enough fresh water entering the ocean to really change the salinity. This change can have an impact on the animals and other organisms that live in the Florida Keys.
Additionally, the water from the Mississippi River contains a lot of nutrients – for example, fertilizers that run off from farms and lawns into gutters and streams and rivers – and those nutrients also impact the sea life and the water in the area. Nelson says that this type of activity (fresh water from the Mississippi River entering the Florida Current) occurs so infrequently (only about ever 6 years), scientists are interested in documenting it so they can be prepared for any changes in the marine biology of the area.
For all of these reasons and more, we took a lot of extra samples at this station. And it took almost 2 hours to process them!
In the evening, we stopped outside of Key West and the director of this program for NOAA, Michelle Wood, took a small boat into the harbor because she cannot be with us for the entire cruise.
Sunset over Key West - a beautiful way to end the day
She asked me if I’d like to go along with the small boat to see Key West, since I have never been there before, and of course I agreed! I got some great pictures of the R/V Walton Smith from the water and we saw a great sunset on the way back to the ship after dropping her off with Jimmy Buffet blasting from the tourist boats on their own sunset cruises.
We will be in the Mississippi River plume for most of tonight. Everyone is very excited and things are pretty crazy with the CTD sampling because we are doing extra special tests while we are in the Mississippi River plume. We might not get much sleep tonight. I will explain in my next blog all about the chemistry sampling that we are doing with the CTD instrument and why it is so important.
Did you know?
On a ship, they call the kitchen the “galley,” the bathroom is the “head,” and the bedrooms are called “staterooms.”
One interesting thing about the ship is that it does not have regular toilets. The ship has a special marine toilet system that functions with a vacuum and very thin pipes. If one of the vacuums on one of the toilets is not closed, none of the toilets work!
Animals seen today…
Zooplankton that live in the sargassum (a type of seaweed that usually floats on the water) –baby crab, baby shrimp, and other zooplankton. The sargassum is a great habitat for baby crab, baby shrimp, and baby sea turtles.
NOAA Teacher at Sea
Becky Moylan
Onboard NOAA Ship Oscar Elton Sette July 1 — 14, 2011
Mission: IEA (Integrated Ecosystem Assessment)
Geographical Area: Kona Region of Hawaii
Captain: Kurt Dreflak
Science Director: Samuel G. Pooley, Ph.D.
Chief Scientist: Evan A. Howell
Date: July 13, 2011
Ship Data
Latitude
1940.29N
Longitude
15602.84W
Speed
5 knots
Course
228.2
Wind Speed
9.5 knots
Wind Dir.
180.30
Surf. Water Temp.
25.5C
Surf. Water Sal.
34.85
Air Temperature
24.8 C
Relative Humidity
76.00 %
Barometric Pres.
1013.73 mb
Water Depth
791.50 Meters
Science and Technology Log
Results of Research
CrustaceansChief Scientist guiding the CTD into the ocean
Beginning on July 1st, the NOAA Integrated Ecosystem Assessment project (IEA) in the Kona region has performed scientific Oceanographyoperations at eight stations. These stations form two transects (areas) with one being offshore and one being close to shore. As of July 5th, there have been 9 CTD (temperature, depth and salinity) readings, 7 mid-water trawls (fish catches), over 15 acoustics (sound waves) recordings, and 30 hours of marine mammal (dolphins and whales) observations.
The University of Hawaii Ocean Sea Glider has been recording its data also.The acoustics data matches the trawl data to tell us there was more mass (fish) in the close to shore area than the offshore area. And more mass in the northern area than the south. This is evidence that the acoustics system is accurate because what it showed on the computer matched what was actually caught in the net. The fish were separated by hand into categories: Myctophid fish and non-Myctophid fish, Crustaceans, and gelatinous (jelly-like) zooplankton.
Variety of Non-Myctophid Fish caught in the trawl
The CTD data also shows that there are changes as you go north and closer to shore. One of the CTD water sample tests being done tells us the amount of phytoplankton (plant) in different areas. Phytoplankton creates energy by making chlorophyll and this chlorophyll is the base of the food chain. It is measured by looking at its fluorescence level. Myctophids eat phytoplankton, therefore, counting the amount of myctophids helps create a picture of how the ecosystem is working.
The data showed us more Chlorophyll levels in the closer to shore northern areas . Phytoplankton creates energy using photosynthesis (Photo = light, synthesis = put together) and is the base of the food chain. Chlorophyll-a is an important pigment in photosynthesis and is common to all phytoplankton. If we can measure the amount of chlorophyll-a in the water we can understand how much phytoplankton is there. We measure chlorophyll-a by using fluorescence, which sends out light of one “color” to phytoplankton, which then send back light of a different color to our fluorometer (sensor used to measure fluorescence). Myctophids eat zooplankton, which in turn eat phytoplankton. Therefore, counting the amount of myctophids helps create a picture of how the ecosystem is working. The data showed us more chlorophyll-a levels in the closer to shore northern areas.
Bringing in the catch
The Sea Glider SG513 has transmitted data for 27 dives so far, and will continue to take samples until October when it will be picked up and returned to UH.
Overall the mammal observations spotted 3 Striped dolphins, 1 Bottlenose dolphin, and 3 Pigmy killer whales. Two biopsy “skin” samples were collected from the Bottlenose dolphins. A main part of their research, however, is done with photos. They have so far collected over 900 pictures.
Looking at all the results so far, we see that there is an area close to shore in the northern region of Kona that has a higher concentration of marine life. The question now is why?
We are now heading south to evaluate another region so that we can get a picture of the whole Eastern coastline.
Personal Log
In the driver's seatKrill
And on deck the next morning we found all kinds of krill, a type of crustacean. Krill are an important part of the food chain that feed directly on phytoplankton. Larger marine animals feed on krill including whales. It was a fun process finding new types of fish and trying to identify them.Last night I found a beautiful orange and white trumpet fish. We also saw many transparent (see-through) fish with some having bright silver and gold sections. There were transparent crabs, all sizes of squid, and small clear eels. One fish I saw looked like it had a zipper along the bottom of it, so I called it a “zipperfish”. A live Pigmy shark was in the net, so they put it in a bucket of water for everyone to see. These types don’t ever get very big, less than a foot long.
I have really enjoyed living on this ship, and it will be sad to leave. Everyone treated me like I was part of the group. I have learned so much about NOAA and the ecosystem of the Kona coastline which will make my lessons more interesting this year. Maybe the students won’t be bored!
NOAA Teacher at Sea
Heather Haberman Onboard NOAA Ship Oregon II July 5 — 17, 2011
Mission: Groundfish Survey
Geographical Location: Northern Gulf of Mexico
Date: Saturday, July 16, 2011
Weather Data from NOAA Ship Tracker Air Temperature: 28.5 C (83 F)
Water Temperature: 27.2 C (81 F)
Relative Humidity: 82%
Wind Speed: 9.58 knots
Preface: Scroll down the page if you would like to read my blog in chronological order. If you have any questions leave them for me at the end of the post.
Science and Technology Log
Question of the day: When I view your travels aboard the Oregon II on NOAA’s Ship Tracker website it looks as though you go as far as the continental shelf and then turn back towards the shore again. Why don’t you go into the deep water?
Our groundfish survey course.
Answer: If you were studying animals in the rainforest you would want to make sure to stay in that specific area. You wouldn’t want to include Arctic animals in your report which are from a completely different biome. The same goes for ocean life. As depth, temperature, and amount of light change in the ocean so do the habitats and the animals that live in them. On this groundfish survey we are focusing on offshore species that live in “shallow” waters up to 60 fathoms (361 feet). If we were to go out into the deep water then our reports wouldn’t be as accurate.
Topic of the Day: Science
What is science? Can you come up with a good definition? Difficult isn’t it. There are many definitions that refer to science as the study of the natural world, systematic knowledge, etc. but something that’s often left out of the definition is that it can be used to make predictions.
We have all been conducting scientific experiments since we were old enough to formulate questions about our environment: “Will this ball bounce?”, “Can I get it to bounce higher?”, “Will ball #1 bounce higher than ball #2?” The knowledge we have collected from these experiments allow us to make accurate predictions. “I think ball #2 would be better for playing tennis than ball #1.” Now keep in mind, the more we know about a subject, the better our predictions will be.
Did you know that the ocean covers over 70% of the Earth’s surface but more than 95% of it remains unexplored. This means we have a lot to learn if we want to accurately predict the relationships between the ocean, the atmosphere and the living things on our planet. To address these gaps in our knowledge, thousands of people working for the government, universities and private industries, are trying to collect the information we need to make the most accurate predictions possible. Perhaps by expanding our knowledge we will be better equipped to formulate some solutions to the problems we have created in the seas such as pollution (particularly plastics), climate change and overfishing. These issues are drastically changing oceanic ecosystems which in turn affect the life on our planet.
The beautiful Pacific Ocean. Image: Universe TodayA new venture into deep ocean exploration. Image: ZD Net
One thing that sets science apart from other arenas is that is it based on verifiable evidence. We are not talking about video footage of bigfoot or pictures of UFO’s here, we are talking about evidence that is easily confirmed by further examination or research. I don’t think many people consider all of the expertise that goes into collecting this kind of scientific data–it’s not just scientists.
Not all evidence is verifiable.
Onboard the Oregon II there are engineers that make sure the ship and all its parts are functional, skilled fishermen that operate the cranes and trawling equipment, officers from the NOAA Corps that navigate and assist the captain in commanding the ship, cooks that feed a hungry crew and the scientists. Conducting scientific research is a team effort that requires a variety of skilled personnel.
NOAA Corps member Ensign Brian Adornado with a nautical chart that's used for navigating our ships course.
Too often people underestimate the amount of time and labor that actually goes into collecting the information we have about our planet and its inhabitants. In fact, many people dismiss scientific evidence as unimportant and trivial when in actuality it is based on the most technologically advanced methods that are available. Scientific data, and conclusions derived from the data, are peer-reviewed (looked at by others in the field) before it is published or presented to the general public.
This is why it is so important to take heed to the reports about the changes taking place in the ocean’s waters. Without the data from NASA’s satellites in the sky, NOAA’s ships on the sea and other sources too numerous to mention, we wouldn’t know the extent of the damage that’s being done to the ocean.
Chlorophyll concentrations in the ocean. Image: NASA satellite SeaWIFS
NOAA’s Teacher at Sea program has clearly demonstrated how good science is done. I experienced first hand the importance of random sampling, scientific classification of organisms, repeating trials to ensure the accuracy of results, team work, safety, publishing data for the public to review and always having backup equipment. I’m looking forward to sharing these experiences with my students. Thank you NOAA!
Personal log:
My time aboard the Oregon II is coming to an end. We have finished up our last stations and cleaned up the workrooms. Now its back to Pascagoula, Mississippi. It has been a wonderful experience! For those of you that are wondering what I did each day on the ship it was pretty routine.
9:00 AM : Go to the galley for some juice and coffee. Hot breakfast ends at 8:00 AM but they always have cereal and fresh fruit to eat. In the galley there are two tables that each seat six people. At the end of each table is a small TV so we can watch the news, our anything else that happens to be on DirectTV.
This is a picture of my room. I have the bottom bunk and my roommate sleeps on the top. The curtains are very nice for privacy since we work different shifts.There is a bathroom (head) that my roommate and I share with our two neighbors. Each room has its own entry door to the bathroom.This is the galley where all of our meals are served. It's also stocked with lots of yummy snacks and drinks!
9:30 AM: After some coffee, juice and conversation I head upstairs to the lounge so I can check my e-mail and work on my blog. The lounge has some comfortable seats, a big TV, lots of 8mm movies, two computers for the fishermen, and an internet cord for laptops. Usually David, the ornithologist (bird scientist), is here working when I arrive so we usually chat for a while.
This is the lounge.
11:00 AM: Lunch time! everyday the chefs make amazing food for us to eat. They’ve served bbq ribs, prime rib, turkey, quail, crab cakes, shrimp, mahi-mahi, ham, crab legs, pork loin, steaks and lots of other amazing side dishes and desserts. Both chefs are retired from the Navy where they were also cooks.
12:00 noon: Head to the dry lab to start my shift. At the start of every shift Brittany, our team leader, writes down all of the stations we will be going to as well as how many miles it takes to get there.
This is the "dry lab" where we spend our time waiting for the next trawl or plankton station. In this room there are computers dedicated to navigation, depth imagery and fisheries data.
5:00 PM: Supper time! Back to the galley for some more excellent food!
12:00 midnight: Night crew comes in to relieve us from our 12 hour shift. I quietly enter my room so I don’t wake up my roommate and hit the shower. Then it’s to the rack (my bunk bed) with some ear plugs to block out the sounds of the engine. The slow rocking of the waves makes a person fall asleep quickly after a long day at work.