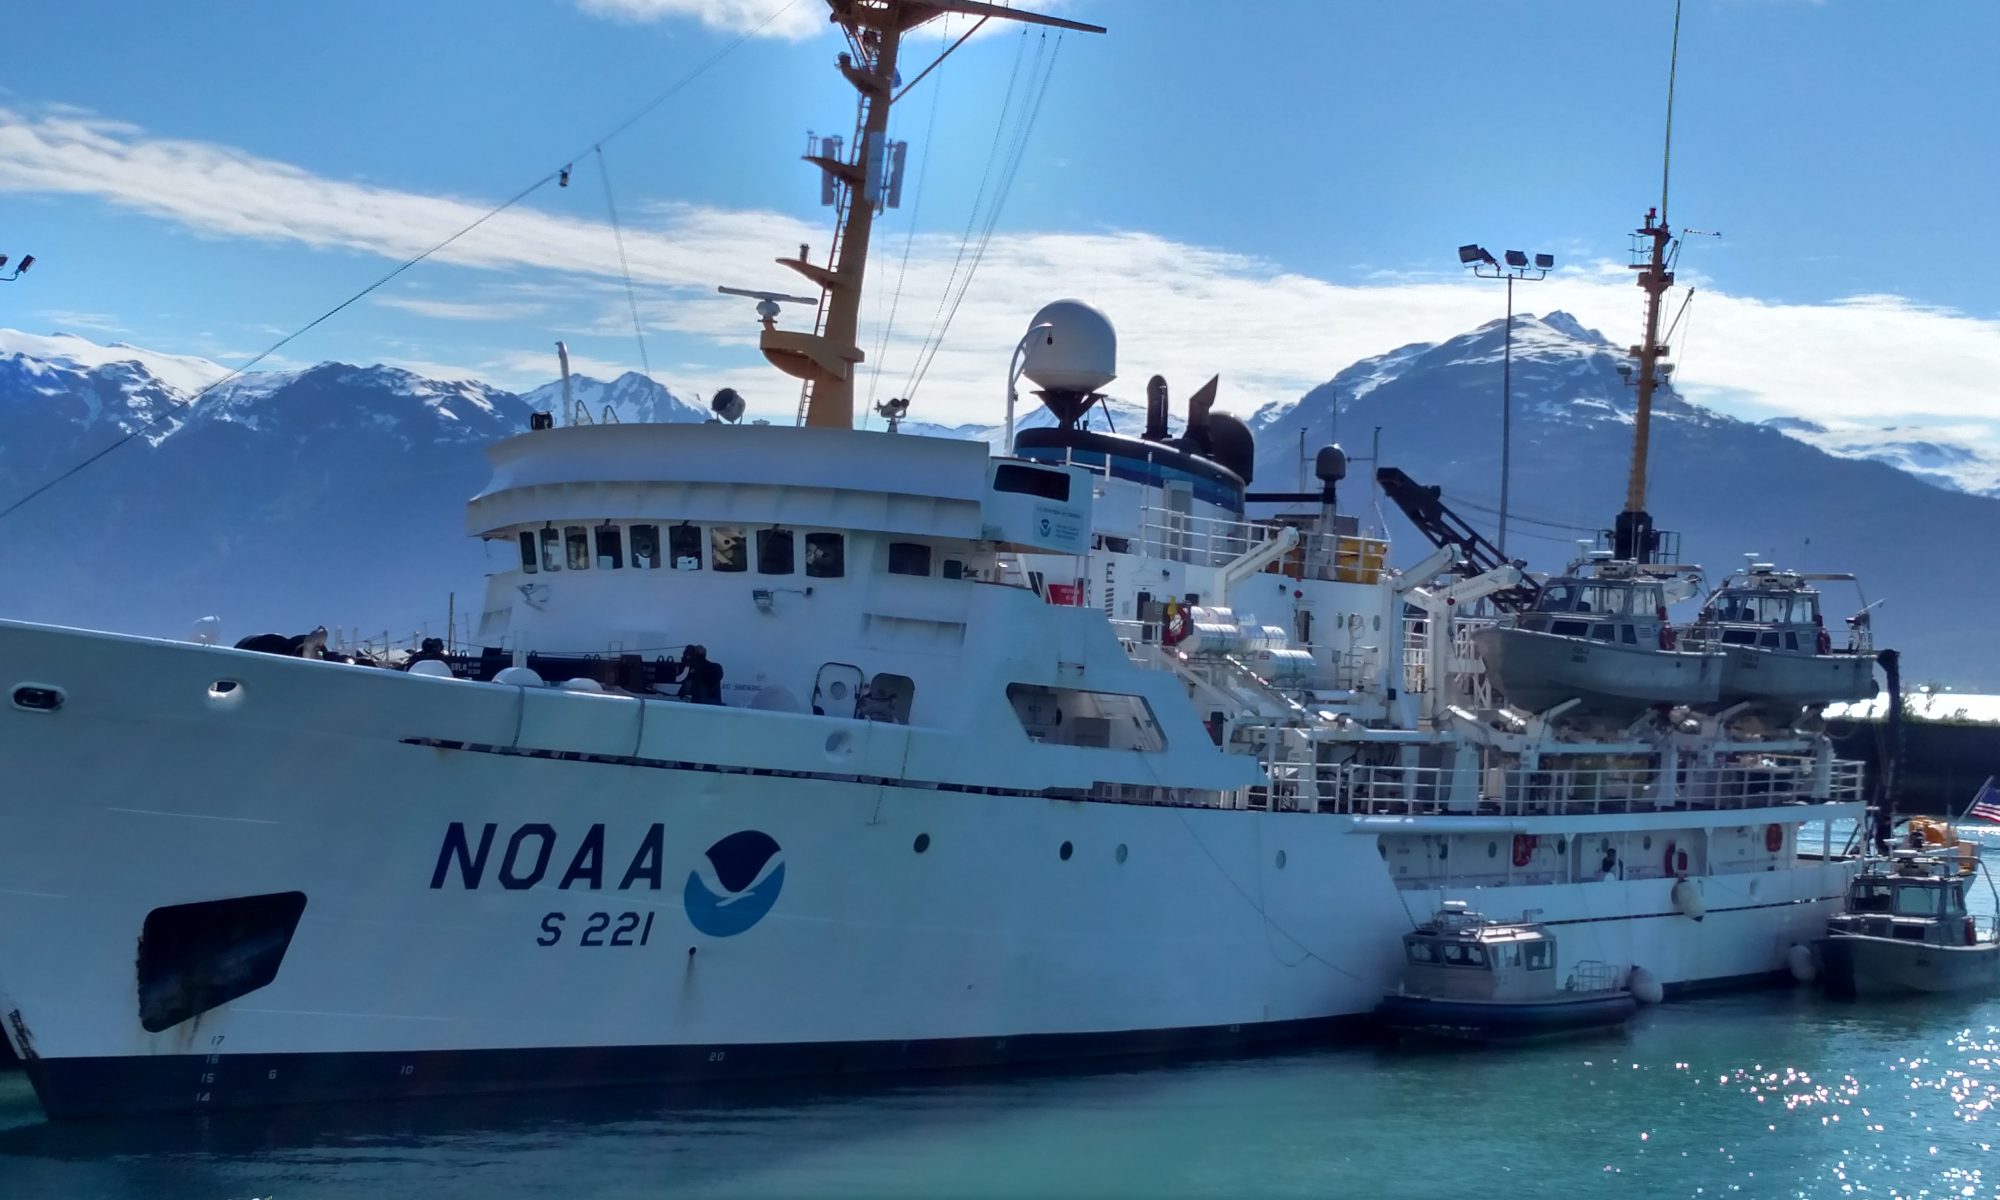
Susan Just, June 17, 2006

NOAA Teacher at Sea
Susan Just
Onboard NOAA Ship Oregon II
June 15 – 30, 2006

Mission: Summer Groundfish Survey
Geographical Area: Gulf of Mexico
Date: June 17, 2006

Weather Data from Bridge 
Visibility: 8-10 nautical miles (nm)
Wind direction: 356◦
Wind speed: 11.1
Sea wave height: 0-1
Swell wave height:1-2
Seawater temperature: 28.2
Sea level pressure: 1016.7
Cloud cover: 5/8 Cumulus, Altocumulus

Science and Technology Log 

This watch began, again, with fish waiting on the deck. We processed that catch just as we had all the others. While we were processing, another catch of fish were being collected. A CTD was also performed. When the fish catch has been processed, it is necessary to return the processed organisms to the sea. There is a shoot in the wetlab designed for this purpose. The shoot has not been working properly so far on this cruise. During our watch it backed up completely. Water was rising up through the drain in the floor. Clearing the blockage took several hours.

The catch was sitting on the deck and we had no reason to believe that we would get the shoot clear any time soon. The Watch Leader elected to process the catch “dry” so we separated and identified the species without the benefit of water to clean the organisms. Following this catch, the shoot was cleared and the lab was cleaned. We are now making our way south to assess the Texas Gulf Coast shrimp prior to the beginning of their season..

Personal Log 

What a mess! Each organism had to be dipped into water just so that we could be sure it was identified properly. We found hundreds of little shrimp that are not even harvested for food purposes.

Question of the Day 

Where do the shrimp live?  Answer: In the mud on the bottom of the sea.

Susan Just, June 16, 2006

NOAA Teacher at Sea
Susan Just
Onboard NOAA Ship Oregon II
June 15 – 30, 2006

Mission: Summer Groundfish Survey
Geographical Area: Gulf of Mexico
Date: June 16, 2006

Weather Data from Bridge 
Visibility: nautical miles  8-10 (nm)
Wind direction: 205.5 ◦
Wind speed: 11.3
Sea wave height: 0-1
Sea swell height: 1-2
Seawater temperature: 28.7
Sea level pressure: 1016.6
Cloud cover: 5/8 Altostratus and cirus

Science and Technology Log 

Tonight we began with a Neuston. Now I know that a Neuston is a rectangular frame to which has been attached a “sock” style net with a round portion at the bottom known as the “cod end.” The Neuston drags at the surface and catches sargassum (sea weed) and also plankton. Why? I’ll need to find out.

Next we pulled in the Bongos. These are round shaped “sock” nets with cod ends. In the cod ends, plankton and other sea life are collected from either the bottom or a maximum depth of 200 feet. The “catch” from both the Neustons and the Bongos are placed into jars with formaldehyde as a preservative. Forty-eight (48) hours later they are transferred to alcohol. They are then shipped out for processing.

The CTD was performed to capture water samples and hydrological data. All of the information is assembled and accompanies the samples to the lab for processing. Finally, we weighed and sorted the catch. Each species is identified by its scientific nomenclature which means we hear a great deal of latin in the wet lab.

Personal Log 

OK, I’m not quite as confused now. I had a great night’s sleep. I am beginning to learn some of the scientific names and I have gotten my fingers onto the computers that record the data regarding the organisms we classify. I’ve started having intelligent conversations with people and I am beginning to make sense of the activities aboard the ship.

Question of the Day 

What is the purpose of collecting the organisms in the Neuston and the Bongos? Answer: Plankton data is part of a long-term study regarding trends in fish populations.

Susan Just, June 15, 2006

NOAA Teacher at Sea
Susan Just
Onboard NOAA Ship Oregon II
June 15 – 30, 2006

Mission: Summer Groundfish Survey
Geographical Area: Gulf of Mexico
Date: June 15, 2006

Weather Data from Bridge 
Visibility: 8-10 nautical miles (nm)
Wind direction: 147◦
Wind speed: 0.1
Sea wave height: 0
Swell wave height: 1
Seawater temperature: 28.6◦
Sea level pressure: 1015.9
Cloud cover: Light Haze

Science and Technology Log 

Our watch began at midnight.  When we arrived in the lab there were fish awaiting processing. All commercial quality shrimp were separated from the catch and a representative sample of the whole was reserved for sorting. The sort included many species which were identified, counted, and weighed.  Individual members of each species were measured and counted, up to twenty (20) per species.  Finally, Two hundred (200) brown shrimp were counted out, separated according to sex and then measured and weighed, individually. Bongo, Neuston and CTD samples were drawn but I was occupied with the fish catches. These catches were repeated constantly throughout the watch until noon at which time we were relieved. Bongo, Neuston and CTD samples were drawn but I was occupied with the fish catches.

Personal Log 

What have I gotten myself into?  I am on the night watch.  This means that my sleeping hours have changed, literally overnight, to between noon and midnight.  Dinnertime has disappeared. Lunch has become the big meal of the day.  I can best describe myself as confused.

So far my impression is that all members of the ship’s crew and the scientific party are professional, helpful and “nice.”  It is easy to recognize the ship’s officers because they are dressed in uniforms.  Everyone else is arrayed in their personal gear and, generally, there is a state of designed “disarray.”

Question of the Day 

What is the most important skill to be learned before becoming a field scientist? Common courtesy/etiquette (be polite!).

Joan Raybourn, August 23, 2005

NOAA Teacher at Sea
Joan Raybourn
Onboard NOAA Ship Albatross IV
August 14 – 25, 2005

Mission: Ecosystem Productivity Survey
Geographical Area: Northeast U.S.
Date: August 23, 2005

Weather Data from the Bridge

Latitude: 44°23’ N
Longitude: 66°37’ W
Visibility: 10 miles
Wind direction: W (270 degrees)
Wind speed: 12.7 knots
Sea wave height: 1’
Sea swell height: 1’
Sea water temperature: 11.1°C
Sea level pressure: 1014.7 millibars
Cloud cover: 1/8 Clear with a few cumulus clouds low on the horizon

Question of the Day: What does “GMT” stand for and how does it affect the date in the log information above?

Yesterday’s Answer: The clock shows 9:17 a.m. There are 24 hours around the clock face. The hour hand is pointing a little past the 9, so that is the hour. To read the minute hand, notice its position. On a twelve-hour clock, this position would indicate about 17 minutes past the hour. Since this clock counts off 24 hours instead of counting to 12 twice, the afternoon and evening hours have their own numbers. For example, 4:00 p.m. on a twelve-hour clock would be 16:00 on a twenty-four-hour clock. There is no need to indicate a.m. or p.m. since each hour has its own unique number.

12

Science and Technology Log

Today I spent some time up on the bridge talking to the crew about weather. The ship collects all kinds of weather data from on-board sensors, including air temperature, air pressure, wind speed and direction, and relative humidity. It also receives weather data from sources outside the ship via satellite link and email. I was especially interested in how the crew determines visibility, cloud cover, sea wave height, and sea swell height, since these represent subjective data. “Subjective” means that someone uses known data and their own experience to make a judgment. Here are some examples.

Visibility just means how far you can see into the distance. This is very hard to judge on the sea because there are no reference points – no objects to “go by” to decide how far away something is. Radar gives an accurate distance from the Albatross IV to objects such as other ships, and on a clear day, the horizon is about twelve miles away. A navigator learns to estimate visibility by combining radar information with how far away objects look in relation to the horizon. It takes a lot of practice to be able to judge visibility using only your eyes!

Cloud cover just means the amount of the sky that is covered by clouds. This is expressed in eighths. Today the cloud cover was about 1/8, meaning about one eighth of the sky had clouds and seven eighths was clear. To make the estimate, mentally divide the sky in half and ask yourself if about half of the sky is cloudy. If you see that less than half the sky has clouds, then mentally divide the sky into fourths, and then eighths. This can be tricky if the clouds are scattered around because it is hard to see a fraction that isn’t all “together”. Once again, this skill takes a lot of practice.

Sea swell height and sea wave height are both descriptors of how the ocean surface is behaving. These are important to observe because they affect the motion of the ship. Swells are large rolling humps of water that are created by the winds from storms. Navigators can tell how far away the storm is by observing the speed of, and length between, the swells. The ship might rock with long, slow swells caused by a storm hundreds of miles away, or with the shorter, faster swells of a storm that is closer. Waves, on the other hand, are caused by local wind; that is, the wind that is blowing right at your location. Waves might just be rippling the water if the wind is light, but can be large if the wind is strong. Both swell height and wave height are estimated in feet from the trough (bottom) to the crest (top) of the wave. Again, this skill takes lots of practice.

Personal Log

Yesterday we got word that a pod of about seventy right whales had been sighted in the Bay of Fundy. This represents a large fraction of this endangered species’ entire population of fewer than 300. Our route has taken us up a little way into the bay, and we have been eagerly watching for whales. We’ve seen several blows in the distance, and occasionally a glimpse of a long back breaking the water. Most of them have been fin whales, but we did see two or three right whales before it was completely dark. It’s exciting to see these giants of the ocean and we hope to see more when the sun comes up.

Joan Raybourn, August 21, 2005

NOAA Teacher at Sea
Joan Raybourn
Onboard NOAA Ship Albatross IV
August 14 – 25, 2005

Mission: Ecosystem Productivity Survey
Geographical Area: Northeast U.S.
Date: August 21, 2005

Weather Data from the Bridge

Latitude: 42°17’ N
Longitude: 69°38’ W
Wind direction: SE (130 degrees)
Wind speed: 10.3 knots
Air Temperature: 19°C
Sea water temperature: 21.8°C
Sea level pressure: 1016.5 millibars
Cloud cover: High, thin cirrus

Question of the Day: Why does sediment collect on the ocean floor more rapidly near the coast than it does further out in the ocean?

Yesterday’s Answer: The stern of the ship is at the back, and the sun rises in the east, so the ship must have been heading west.

9

Science and Technology Log

On this cruise, there are actually two separate but complementary kinds of research going on. We have two scientists from the Environmental Protection Agency (EPA) who are collecting samples of the sediment on the ocean floor, which will be analyzed both biologically and chemically. Biology is the study of living things, so the scientists will look to see what organisms are living in the top layer of the ocean floor. The chemical analysis will show what non-living substances, mainly nitrogen and phosphorus compounds, are present. Chemicals may occur naturally, or may be a result of pollution. This work gives us information about human influence on the ocean ecosystem.

To collect the ocean floor sample, scientists use a sediment grab (picture #1). The “grab” is lowered into the ocean until it hits the bottom, where the container closes and “grabs” a sample of whatever is down there. Then it is hauled back to the surface and opened to see what has been collected. There could be sand, silt, mud, rocks, and any creatures living at the bottom of the ocean. There are two chambers in the grab. From one chamber, the top 2-3 cm of sediment are scooped into a pot, mixed up, and put in jars for later chemical analysis. This thin top layer will yield information about the most recent deposits of sediment. Near the coast, that sample may represent matter that has settled to the ocean floor over a year or so. Further out, that much sediment would take several years to deposit. The contents of the other chamber are dumped into a bucket and washed through a sieve to remove the sediment and leave only the biological parts.

The sieves used for the sediment sample are very much like the ones used for the plankton samples, but bigger and with larger mesh at the bottom (picture #4). The bigger “holes” in the mesh allow silt and sand to be washed out. Whatever is left in the sieve is put into jars and stored in coolers for later analysis. The sample contains evidence of what lives in the benthic layer, the top layer of the ocean floor. This evidence could be plankton, worm tubes, or remains of once-living animals.

At each station where a sediment grab is performed, three water samples are taken, one each from the bottom, the middle, and the surface of the ocean. One liter of each water sample is filtered (picture #6) to analyze its nutrient content. This process is somewhat similar to the chlorophyll filtering I described in yesterday’s log. The filters are saved to be analyzed in laboratories, which will look for both dissolved nutrients and particulate matter. Dissolved nutrients are like the sugar that dissolves in your cup of tea – you can’t see it, but it’s still there. Particulate matter consists of tiny bits (particles) of things such as plankton, whale feces, plants, anything that might be swirling around in the ocean.

The EPA is primarily concerned with human influences on natural environments. By collecting sediment and water data, scientists can see what substances humans are putting into the ocean, and what effects they are having on the plants and animals living there. This work meshes well with the plankton research work, since the health of the plankton is directly influenced by the health of its environment. Everything in the natural world is connected, and we humans must learn how to balance our wants and needs with the needs of all other living things. If we are not careful about how we use our Earth, we will upset the balance of nature and create negative consequences that we may not see for years. For example, if chemicals dumped into the ocean (on purpose or accidentally) kill large numbers of phytoplankton, then the entire food web will be disrupted in a kind of ripple effect, like a stone dropped into a pond. The zooplankton (who eat phytoplankton) will starve, and the animals that eat zooplankton will either starve or move to a different part of the ocean, which in turn changes that part of the ecosystem. From this very small example, maybe you can see how huge our responsibility is to keep our oceans (and other environments) clean.

Personal Log

I am so grateful to Jerry Prezioso, our NOAA chief scientist, and Don Cobb, our EPA scientist. They have included me in all of their operations from Day 1, and have been infinitely patient with my many questions. They have explained things over and over until I “got it”, from procedures for collecting samples to the science behind all their work. It has been eye-opening to be on the student side of learning. Many times I have not even had enough background knowledge to know what questions to ask, or have been almost paralyzed with fear that I might do something wrong and skew someone’s data. I know this experience will help me better understand my students who go through these same feelings of anxiety and joy when they are learning something new.