Heather O’Connell: Sound in Seawater and Sleeping at Sea, June 8, 2018

NOAA Teacher at Sea

Heather O’Connell

NOAA Ship Rainier

June 7 – 21

Mission: Hydrographic Survey

Geographic Area of Cruise: Seattle, Washington to Southeast, Alaska

Date: 6/8/18

Weather Data from the Bridge: Latitude: 48.15° N, Longitude: 122 ° South 58.0’  West, Visibility: 8 nautical miles, Wind: 24 knots, Temperature: 14.2° C

Science and Technology Log

I was fortunate enough to sit in on a survey orientation for new survey technicians and junior officers with Lieutenant Steven Loy. He was on Rainier as the Field Operations Officer, F.O.O., in the past and is currently here as an augmenter filling the role of Senior Watch Officer since he has navigated through the Inside Passage several times. In his two hour orientation, he shared a wealth of knowledge and discussed how multibeam sonar and ultrasounds are two opposite ends to the ultrasonic pulse spectrum.

Multibeam sonar sends out sound and measures the time it takes to return to calculate the depth of the ocean floor. The accuracy of the depth data generated from the multibeam sonar relies on the sound speed profile of the water. The combined effects of temperature, salinity and pressure generate a sound speed profile. Because of the inherent importance of this profile, there are several different ways to measure it. The sound velocity profiler measures this right at the interface of the multibeam sonar. C.T.D.s., or conductivity temperature and depth machines, measure water profile while the ship is stopped. M.V.P.s, or moving vessel profilers, take the water profile as the vessel is moving. Lastly, XBTs are expendable bathythermographs that measure temperature while the ship is in motion.

Sound is affected by different variables as it is energy that travels through a medium as a wave. Lieutenant Loy shared an informative website, The Discovery of Sound in the Sea, where I was able to enhance my understanding. Sound can travel through a liquid, such as water, a gas like air, or a solid like the sea floor. On average, sound travels about 1500 meters per second in sea water. However, the rate changes at different times of day, various locations, changing seasons and varying depths of the water. By looking at sound speed at one particular place in the ocean, you can determine how the different variables affect this sound. Usually, as depth increases, temperature decreases, while salinity and pressure increase.

A multi-beam sensor has a metal plate receiver and a transmitter perpendicular to one another. This array geometry enhances sound.  The sound velocity profiler is next to the receiver and measures right at the interface. To determine the speed of sound right where the beam is generated, sonar is used to measure speed sound across a known distance. This information is then utilized in the overall determination of the depth of the ocean floor. Once this cast is taken, the Seafloor Information System (SIS), can adjust sonar measurements accordingly.

Another way to measure the sound profile of water includes a C.T. D.  This device measures the conductivity, temperature and depth of the water. Conductivity measures the electrical current of the water. The more dissolved salt, or ions in solution, the greater the conductivity and salinity of the water. The depth of the water is directly related to the pressure of the water. Salinity, temperature and pressure affect the sound speed profile of water. This machine has a high data rate that goes up and down the water column. The titanium C.T.D. operates at a high pressure and costs about forty thousand dollars. This accurate technology can only be utilized when the boat is stopped and is used on the smaller survey launches.

C.T.D. used for sound speed profile of water

A third method of measuring sound profile is the M.V.P., moving vessel profiler, which takes the data when the ship is moving. These are calibrated before a survey begins and are an efficient way to collect data. An expansive crane lowers the metal torpedo with the sensor off the fantail, the overhanging back part of the ship, into the water to collect the data. The fish is programmed to stop twenty meters above the ocean floor, at which point it returns to its docked position. On ship Rainier, the deck department deploys the fish with a cable wire and the plot room with the survey technicians controls the sensor.  

Boatswain Kinyon and Survey Technicians Finn and Stedman releasing the torpedo of the M.V.P. into the water

Another way to collect the sound profile of water with a moving vessel is to use an expendable probe. As temperature decreases, the sound speed decreases. Since temperature is the most important factor affecting the speed of sound, an X.B.T., Expendable Bathythermograph, or expendable probe created by the military. With bathy relating to depth and thermo meaning heat, this measures the temperature of the water at a cost of about one hundred dollars. These probes descend at a known rate, so, depth is a function of time.

Sources – Discovery of Sound in the Sea

Personal Log

We left port yesterday at 16:30, which has been a highlight of my NOAA Teacher at Sea Experience thus far. Before leaving port, all hands were assigned a different assignment to help with the launch. I watched the crew bring in the gangway that connects the ship to the port then disassemble it. The crew with hard hats and orange work vests took down poles and neatly tied up different sections by knotting ropes. We slowly progressed out of the port after a cargo ship passed us.  

The deck crew preparing to leave port

Once the ship picked up speed and the ocean breeze was in my hair, I felt a new kind of freedom. With the Seattle skyline behind us and the beautiful green peninsulas in front of us, I was content to be moving forward. Everyone seemed to feel relieved once we were underway. I felt gratitude as I enjoyed watching the sunset from the flying bridge, the area of the ship above the bridge at the front of the ship.

Seattle Skyline
Seattle Skyline

After sunset, I returned to my berth, or sleeping quarters, located in the bow of the ship on the C-deck. I heard the constant white noise of the propellers that got much louder when the pitch, or angle, of them changed. This sound of seawater combined with the rocking motion of the ship lulled me to sleep on our first night at sea.

20180607_203558.jpg
Sunset

Did You Know?

Juneau, the American capital of Alaska, can only be entered by plane or boat. It is inaccessible by roads due to large mountain ranges on either side.

Geoff Carlisle: Oregon II is to NOAA as Millennium Falcon is to Star Wars, June 10, 2018

NOAA Teacher at Sea
Geoff Carlisle
Aboard NOAA Ship Oregon II
June 7 – June 20, 2018


Mission: SEAMAP Groundfish Survey
Geographic Area of Cruise: Gulf of Mexico
Date: June 10, 2018


Geoff & O2
My first day on the NOAA Ship Oregon II!


Science Log

Having spent a few days on the ship now, I’ve come to realize that NOAA Ship Oregon II is a lot like the Millennium Falcon from Star Wars. In Star Wars Episode IV: A New Hope, Han describes the Falcon by saying, “She may not look like much, but she’s got it where it counts, kid. I’ve made a lot of special modifications myself.” Every crew member and scientist that I’ve talked to talks about Oregon II like Han does about the Falcon. The typical conversation starts with them saying that she “may not look like much,” being the oldest and one of the smallest research vessels in the NOAA fleet. But without fail, they immediately begin talking about how versatile the boat is, thanks to the many modifications that have been made over the years (some even joke about how the boat itself may be 50 years old, but none of its parts are). The boat is covered with its many awards and achievements, and has the lowest crew turnover in the NOAA fleet (many of the crew members have worked on the ship for over 20 years!).


50 Years
You can see how much the ship has changed in its 50 years!

On Thursday, we began our two-day “steam” from the NOAA Ship Oregon II’s home port in Pascagoula, Mississippi, to Brownsville, Texas (near the border between the US and Mexico). Upon reaching Brownsville we’ll drop our first trawling nets at various stations, which are randomized locations where we’ll make our measurements.

The data we collect is part of the SEAMAP Summer Groundfish Survey, which the Gulf states of Texas, Louisiana, Mississippi, Alabama, and Florida depend on to assess the health and vitality of groundfish in the Gulf of Mexico. For example, according to the Texas Parks and Wildlife (TPWD), the commercial shrimp season for both the state and federal waters  “is based on an evaluation of the biological, social and economic impact to maximize the benefits to the industry and the public.” Knowing that I helped with the “biological evaluation” they refer to makes the work feel important.


Personal Log

Common tern
Common tern (Sterna hirundo) which fly from Canada to Patagonia every year

Casting off from Pascagoula felt like getting a “best of” tour of the Mississippi Gulf. The first hour of sailing was filled with incredible views of wildlife: groups of pelicans buzzing the ship, terns hovering above the deck, and flocks of seabirds chasing after fishing ships hoping to catch a meal. Every few hours we also see pods of bottlenose dolphins playing in the boat’s wake, and schools of flying fish gliding alongside the boat. The diversity and abundance of life reminded me that the Gulf of Mexico is a fertile ecosystem, with so much to explore.


Dolphins chasing our boat!

Brown pelicans
Brown pelicans (Pelecanus occidentalis) skirting our boat
Fishing vessel
A common sight in the gulf: sea birds stealing from fishing nets
Can't beat the views
Can’t beat the views

Without stations to take measurements, I don’t have many responsibilities yet on the ship, so I spend most of my time getting to know the crew, reading, watching the ocean, and working out. I was worried about what two weeks at sea would do to my triathlon training (it’s the middle of racing season!), but luckily I found a stationary bike with an incredible view. The term “stationary” bike feels almost tongue-in-cheek though, as the boat’s rocking and rolling have caused me to tip over more than once. On the bright side, I’m getting more of an ab workout?


Space is very limited on the boat, so there are a number of pieces of etiquette you learn quickly:

  • If someone is coming down the stairs or a hallway, pull over – you can’t fit two people in any passageways
  • With 30 people on board, but only 12 seats in the galley, make your meals short so others can get in and sit down
  • Don’t sit up too quickly in bed (the pic below is my bed!)
Geoff's bunk on the ship
Geoff’s bunk on the ship

The boat is also constantly moving and humming. You learn quickly that you can’t move too quickly because of the large waves rocking the boat. While the gentle rocking of the ship can help lull you to sleep, every hour or so the waves get so rough that things start falling off of tables, which makes dinner time… fun?

One thing is for sure: the sunsets on the Gulf are unparalleled.

Sunset
The sunsets on the Gulf are unparalleled.


Did You Know?

British composer Ralph Vaughan Williams set text about the sea from American Poet Walt Whitman’s “Leaves of Grass” in his Symphony No. 1, “A Sea Symphony,” for chorus and orchestra. In the piece, Vaughan Williams paints a symphonic picture of the sea that transports the listener, making you feel as if you were at sea. Since setting sail a few days ago, I can’t get this piece out of my head. Have a listen!

https://open.spotify.com/user/1243186021/playlist/6lOxst2QezoMlnJ4TdYAn3?si=xnS-ZDUkQ82YkoEPvRcA2Q

Behold, the sea itself,
And on its limitless, heaving breast, the ships;
See, where their white sails, bellying in the wind, speckle the
green and blue,
See, the steamers coming and going, steaming in or out of port,
See, dusky and undulating, the long pennants of smoke.

Walt Whitman, Leaves of Grass, Book XIII: Song of Exposition

Kimberly Godfrey: Creature Feature, June 8, 2018

NOAA Teacher at Sea

Kimberly Godfrey

Aboard NOAA Ship Reuben Lasker

May 31 – June 11, 2018


Mission: Rockfish recruitment and assessment survey

Geographic Range: California Coast

Date: June 8, 2018


Data from the Bridge

Latitude: 36° 43.508′ N

Longitude: 121° 52.950′ W

Wind: 30.87 knots from the SE

Air Temperature: 12.7°

Waves: 2-3 feet with 6-8 foot swells


Science and Technology Log

We moved up north to continue with our trawls. The first night we trawled just north of Monterey Bay. It was a good thing we did because outside the bay, the wind and swells are rough. We saw lots of jellyfish and lots of krill in our catches. However, I would like to talk a little about a very specific group of fish, rockfish. If you read the mission above, you will recall that rockfish are the primary focus of this survey. Therefore, I think they need a moment in the spotlight to themselves.

While this number may vary, NOAA has over 60 species of rockfish listed on the West Coast. They are an intriguing group of fish for many reasons. First, it is important to note that they are extremely significant to their food web because they are a prey species, but they are also important as a food and income source for humans. Species like the bocaccio rockfish and the yelloweye rockfish are species of concern due to over fishing, and populations are slow to recover. That is enough reason to learn as much possible about these fish.

Yelloweye Rockfish
Yelloweye Rockfish
Bocaccio
Bocaccio

What we know about rockfish species is they can live for a long time. Many can live over 50 years, some can even live over 100 years of age!  Their growth rate is relatively slow, and very few make it to adulthood because they are prey for other fish. During the first year (sometimes more depending on the species), they spend much of their time in the pelagic realm (open water). If they live long enough, they can grow to a size that allows them to settle in the benthic zone (ocean floor). For many species, 60 mm is a large enough size to settle. This is what the term “recruitment” refers to. Once rockfish settle out of the pelagic zone, they have a higher chance of reaching reproductive maturity.

YOY Rockfish
Various species of YOY (Young Of the Year) rockfish caught in one of our trawls. Photo Credit Keith Sakuma

NOAA Fisheries has been surveying the West Coast for rockfish since 1983. They first started in a smaller region from Monterey Bay to Point Reyes, CA. The survey area expanded in 2004 and by 2013 it covered the entire coast of California. The success of the local ecosystem and the commercial fisheries depend on healthy fish populations. The survey tries to collect at least 100 specimens per species of rockfish and take them back to the lab (on land).  Back at the lab the species identifications are determined as many rockfish are difficult to identify to species at this life history stage without using a microscope.  In addition, their size is recorded and tissue samples taken for genetic studies. Then, on select species, otoliths are removed to age the specimens. The otolith is an ear bone. In fish, the ear bone deposits layers of bone in rings. It happens daily and these daily rings can be counted using a microscope to learn how old the fish is. These ages are used by scientists not only to learned how old the fish are, but they can compare this information to the size data collected and estimate the expected size of a fish at any given age.

I had a chance to talk to everyone from the night shift science team about what they do and how they came to work for NOAA:

Keith Sakuma has been working with the survey since 1989. He is the chief scientist and team leader of the night crew. He works hard to make sure we are all focused and efficient because it is a fast-paced work environment. In between hauls, he enjoys the company of his team and a few Dragon Ball episodes. He was born and raised in Hawaii, and went to University of Hawaii for his Bachelor’s degree in Zoology.  In his younger years, Keith worked for the Division of Aquatic Resources, where he spent his days walking up and down the beach to count fisherman and interview them about their catches for the day. He also did snorkel surveys doing fish counts in fisheries management areas.  In addition, he worked on a team that implemented fish aggregating devices, buoys that attract fish for the local fisherman.

While at the University of Hawaii, he was part of the Marine Option program where they teach you various marine skills and connect you with marine research activities. Through this program he completed his scientific diving training, and then participated in two diving surveys. Both surveys documented the impacts of tourism on the reef systems on the island of Lanai Island and Molokini, which is a tiny islet off Maui. On Molokini, tourist traveling to the islet by boat, dropping anchor in the reef, caused a significant amount of damage to the reef. Mitigation included the addition of moorings so boats could tie up and not have to drop anchor, destroying more of the reef.

For his Master’s, he attended San Francisco State University.  His major advisor just returned from a 2-year sabbatical, working with the National Marine Fisheries Service (NMFS) [also known as NOAA Fisheries] on the mid water trawl survey, and suggested that Keith do his Master’s Thesis on the data he collected on the survey. While finishing his Master’s degree, he was offered a full-time position working with NMFS, and has been here ever since. That means he has 29 years put into this work.

Growing up in Hawaii near the ocean definitely influenced his decision to pursue Marine Science. He used to say to others how much he loved the ocean and that the ocean loved him back. He couldn’t wait to spend time at the beach in the water. And while today this remains true, he has mentioned that that cold waters of Pacific Coast are not as affectionate as the warm waters of Hawaii.  The water around the islands is so clear, allowing one to see at a distance the beauty that lies beneath. Here, you must pick the right day at the right time to find tolerable temperatures and some visibility. The murkiness makes it hard to see anything, but that murkiness is what contributes to the productivity of the region.

Even after 29 years, Keith still very much enjoys being at sea. He doesn’t get sea sick, so he can spend time working in the field with real specimens and real-time data rather than just analyzing data collected by other people. He enjoys seeing new people come on and get excited about the work. For anyone interested in pursuing Marine Biology and any research science, it is important to have a strong background in math and statistics, especially in today’s world. He also mentioned how important it is to have computer skills and programming skills. The software used to process and analyze data requires one to read and write programming language. Having these skills make one a stronger candidate when applying for research positions. It also gives one more validity when having to speak about and defend the analysis of the research.

That’s Keith, the Chief Scientist, in a nutshell. I also got to learn more about the rest of the team. Thomas Adams has been working with this survey for 5 years now. He started as a volunteer with NMFS, analyzing marine chlorophyll samples. He always had an interest in Marine Biology, and already had a connection to someone working in a NOAA lab. He was invited to work on the rockfish survey because he was known for being a knowledgeable and efficient worker. He too is very enthusiastic and really enjoys being at sea with Keith and the rest of the team. He is the main provider of Dragon Ball, and the Simpsons, which the team enjoys in between trawls. He recently completed his Bachelor’s degree and plans to go for his Master’s in Marine Biology in the near future.

Melissa Monk is a Research Mathematical Statistician, and is responsible for fisheries stock assessments for West Coast near shore ground fish. She also participates in research related to improving fisheries. Her schedule is on a bi-annual cycle. One year is devoted to stock assessment, and the next year is devoted to research.  During stock assessment years, there is a mad dash that happens around September to learn anything and everything about your assigned species. At the end of the assessment season, there is a week-long panel review of all the data gathered during the assessment. Once the assessment is approved, the information is used for species management and harvest regulations. She received her undergrad in Wildlife Sciences with a minor in Statistics. Her Master’s was in fisheries. She spent half her year monitoring the sea turtle populations in North Carolina, and the other half of the year in classes. She did a lot of quantitative work, research, and recruitment training for her Master’s. She also had a connection to NOAA because her PhD advisor at LSU used to work for NOAA. She learned that NOAA trained people to become stock assessors, and pursued fisheries as a career. Her favorite part about working for NOAA is that her work directly impacts fisheries success.

Rebecca Miller is a GIS Specialist, works on a variety of projects at the Santa Cruz NOAA lab. One project is the spatial mapping of rockfish and other marine species. She maps California fisheries catches in both time and space, and is able to analyze this data as far back as the 1930’s. Her Master’s degree is from Oregon State University in Fisheries Sciences with a minor in Geography. She knew since 6th grade that she wanted to be a Fisheries Biologist. She participated in internships and part-time summer jobs in freshwater salmon fisheries, marine intertidal work, and geodatabase management. She loves the people she works with, and the fact the work is so diverse. There is a lot of field work, lots of data analyses, and different projects to work on. She too enjoys knowing that her work helps to sustain fisheries to be both utilized and conserved.

Stephanie Oakes is from NOAA Fisheries Office of Science and Technology (OST). She got her Ph D. in Marine Sciences, and worked on Antarctic krill in an ecosystem context.  The rockfish survey is similar in the sense the it also surveys species in an ecosystem context.  Being able to participate in surveys like this is important to her because she gets to experience first had what happens during the surveys and how the team operates.  Her personal gratification is that she gets her hands in the catch, in the field like she did for her Ph.D.  NOAA Fisheries OST is there to advocate and ensure sound scientific basis for NOAA Fisheries science programs and resource conservation and management decisions.

Did you know…

Here are some of the species we found during our trawls:

  • Adult and young of year (YOY) anchovy
  • Adult and YOY sardine
  • Jack Mackerel
  • Northern Lamp fish
  • Mexican lamp fish
  • California Lamp fish
  • Blue lantern fish
  • Northern smoothtongue
  • Black smelt
  • Pacific Hake
  • Pacific Sanddab
  • Speckled Sanddab
  • CO Turbot
  • Black-bellied dragon fish
  • High fin dragon fish
  • Barracuddina
  • King-of-the-salmon
  • Market squid
  • Gonatus squid
  • Boreal squid
  • Octopus
  • Electric Ray
  • Wolf Eel
  • Pacific Sea Nettle
  • Purple striped jelly
  • Moon Jelly
  • Krill
  • Pelagic Red Crabs
Pacific Sanddab
Young of Year (YOY) Pacific Sanddab
King of the salmon
King-of-the-Salmon
Krill
Krill. There is mostly one species of krill here, but we’ve seen multiple species in our catches.
Barracudina
Barracudina
Adult Anchovy
Adult Anchovy
Myctophids
Blue lantern fish
Pelagic Red Crab
Pelagic Red Crab
Chryasora colorata
Purple Striped Jelly
Boreal Squid
Boreal squid
Octopus
Octopus
Wolf eel
Juvenile wolf eel Photo Credit Wyatt Sebourn

Lacee Sherman: Teacher Getting Her Sea Legs! June 8, 2018

NOAA Teacher at Sea

Lacee Sherman

Aboard NOAA Ship Oscar Dyson

June 6, 2018 – June 28, 2018


Mission: Eastern Bering Sea Pollock Acoustic Trawl Survey

Geographic Area of Cruise: Eastern Bering Sea

Date:  June 8, 2018


Weather Data from the Bridge on 6/9/18 at 17:00

Latitude: 55° 34.3 N

Longitude: 162° 39.0 W

Sea Wave Height: 2-3 ft

Wind Speed: 12 knots

Wind Direction: 335° NW

Visibility: 8 knots

Air Temperature:  7.1° C

Water Temperature: 8.6° C

Sky:   Blue with scattered clouds


What have you done to protect the oceans lately? Picture of Lacee with finger pointing at camera
World Oceans Day! June 8th, 2018. What have YOU done to protect the oceans today?

Science and Technology Log

On Wednesday, June 6th 2018, NOAA Ship Oscar Dyson left port from Dutch Harbor Alaska at 08:00 to go and fuel up for the upcoming voyage.  Fueling the ship takes hours and during that time, NOAA Ship Oscar Dyson took on over 50,000 gallons of fuel.  After the ship was fueled, it searched for a spot in Captain’s Bay to calibrate the acoustic equipment. In order to calibrate the equipment, a metal ball made of tungsten carbide was suspended beneath the boat under the center board. The ball has known acoustic return values based on density and purity of the metal. It is attached at three points to the boat so that it can be moved under the center board to calibrate each transducer..  The location of the ball is adjusted under each transducer one at a time to the center of each beam.  Adjustments to the equipment will be made if the return from the ball at each transducer is not as it is expected to be.  The scientists had to change the depth of the ball in the water in order to avoid the fish to get an accurate reading.  The calibration can be different depending on the temperature of the water and the salinity (saltiness) of the ocean. A second calibration will be taken at the end of the research cruise and the average will be used in the necessary calculations.  Once calibration was complete and the equipment was retrieved, the ship started heading to the beginning location of the first transect line.

The journey from our calibration point to the start of the first transect line took approximately 23 hours, traveling at 12-13 knots.  The ship reached the northern end of the first transect line at approximately 21:00 (9 pm) on June 7th. The first trawl sample was taken shortly after at sunset, which was approximately 23:30 (11:30 pm).  This is not an ideal time to collect a trawl sample though since the fish move and behave differently at night.  The first trawl sample of the survey that I participated in was on 6/8/18 at approximately 15:30.

Operations on the ship run 24 hours a day, so some members of each team onboard need to be awake and working at all times.  Shifts for the science team are 12 hours long and the day shift runs from 04:00 (4 am) to 16:00 (4 pm) and the night shift is from 16:00 (4 pm) to 04:00 (4 am).  I am assigned to the day shift along with Chief Scientist Denise McKelvey and Fisheries Biologists Sarah Stienessen, Mike Levine, and Scott Furnish. On the night shift for the science team are Nate Lauffenburger, Darin Jones and Matthew Phillips.


In order to collect a trawl sample, members of basically every department on the ship are involved.  The NOAA Corps officers are on the Bridge driving the ship, charting the course that the ship will be traveling on as it collects it’s samples, as well as keeping track of the net, and all of the other duties that they regularly hold.  The stewards keep us all fed and happy. The deck crew are in charge of making sure that all of the nets are hooked up properly and are put into the water correctly as well as controlling the winches that release the nets. The engineers make sure that all equipment is functioning properly.  The survey technicians ensure that all of the scientific instruments used for making any type of measurements are attached to the net at different points, mainly on the kite.  The “kite” is a section of the net primarily used for holding scientific instruments. Some of the scientists are preparing the fish lab and getting dressed in waterproof gear, while the Chief Scientist is on the Bridge with the officers giving direction about where and when to start and stop trawling and exactly how deep the nets should be set. Adjustments to the net are regularly made during the sample collection.

The locations for when trawl samples will be collected is not pre-determined before the start of the research cruise.  The sites for samples are determined in real time by looking at the data collected from the acoustic pings being sent out by the transducers.  There are 5 different frequencies( measured in kilohertz) sent out by the ship’s transducers: 18 kHz, 38kHz, 70 kHz, 120 kHz, and 200 kHz.  The acoustic frequency that may best indicate the presence of pollock is 38 kHz. The chief scientist decides when she wants to “go fishing” based off of looking at the results coming back as echoes to the ship.


Acoustic data points collected at 5 wavelengths
This is what the acoustic data points look like as the ship is moving on the water. All 5 different frequencies are depicted in this image. The top left is 18kHz, bottom left is 38kHz (best for pollock), top right is 70kHz, middle right is 120kHz and the bottom right is 200kHz. Each dot represents an echo received by the ship’s transducers after the sound hits something in the water. The solid red band near the top of each window is the depth of the sonar transducer sending the acoustic pings, while the heavier red band at the bottom of each window is the sea floor.

On this leg of the research cruise thus far, 3 trawl samples have been collected from the transect lines.  I will include more detailed information and photos of the fish processing protocol in my next blog. In the next three pictures, there are temperature and depth profiles of our sample collection.  The depth (in meters) is shown by the shape of the line as it rises and falls, and the color shows the temperature (in degrees Celsius) that goes with the scale on the right of each figure. More specific details are underneath each image.haul 1 profile


haul 2 profile


haul 3 profile

Personal Log

Now that the ship is in the middle of the Bering Sea and is moving, I have learned an important lesson:  You can’t trust the floor. I know that sounds weird, but usually you know exactly where the floor is going to be when you are walking, but when the ship is moving in the water, the floor may be higher or lower than expected, causing a lot of wobbling.  This is especially challenging for someone who is as naturally clumsy as I am. There are times when I feel like a toddler learning to walk again, but I am getting more and more used to it already. At night it feels like being gently rocked to sleep.

I’m learning my way around the ship and I am starting to not walk right past the doors that I need to go into a few times before I remember that it’s the right place.  I am also getting more familiar with the people onboard as well as the schedule. Since my shift that I am working on is from 04:00 (4 am) to 16:00 (4 pm), it took a few days for me to adjust and everyone was very patient with me.  Coffee definitely helps! The meal times are as follows: Breakfast 07:00, Lunch 11:00, Dinner 17:00 and there are always some snacks available in the Galley.

Ocean Selfie! 6/7/18
Photo of TAS Lacee Sherman aboard NOAA Ship Oscar Dyson in the Eastern Bering Sea.

In my downtime on the ship, I have found a new favorite location; the flying bridge!  The flying bridge is located above the Bridge (where the Ship is controlled).  There is a chair up there that makes the perfect spot on a nice day to sit and read for a little while.  It is windy and cold, but worth it!  The view from up there is pretty amazing!

Did You Know?

The NOAA Commissioned Officer Corps is one of the 7 uniformed services in the United States.  The other 6 include:  Army, Marine Corps, Navy, Airforce, Coast Guard, and the Public Health Service Commissioned Corps.

Math Challenges!!!!

If the Dyson regularly travels at 12.5 knots, how many miles per hour is it going?  (Hint: you may want to look at my previous blog before you try this.)

Currently 9 of the people aboard the NOAA Ship Oscar Dyson are women.  If there are 31 total people on the ship, what percentage of them are women?

TAS Brandy Hill: Personal Introduction, June 8, 2018

NOAA Teacher at Sea

Brandy Hill

Aboard NOAA Ship Thomas Jefferson

June 25, 2018 – July 6, 2018


Mission: Hydrographic Survey – Approaches to Houston

Geographic Area of Cruise: Gulf of Mexico

Date: June 8, 2018

Personal Introduction: Hello from Portland, Oregon! With two weeks until departure date and in honor of World Oceans Day, I figured it is time to post my first contribution to the NOAA TAS page.

I am currently wrapping up my third year teaching 6th grade math and science at Twality Middle School in Tigard, OR. We have had a phenomenal year measuring growth in math skills, getting excited learning about body systems and genetics, and completing various engineering projects. Our most recent [project] included building marble roller coasters and taking a trip to Oaks Amusement Park where students convinced me to ride the “Scream’n Eagle” more than once.

ScreaminEagle.png

The “Scream’n Eagle” at Oaks Amusement Park. [Source: http://www.kgw.com]

My awe of the ocean began when my family moved to Oregon when I was nine years old.  A lot of my childhood was spent camping on the coast with family and a fishing boat. On Christmas, my dad gave my sister and I practical outdoorsy gifts including matching rubber crabbing suits. I went on to major in Biology at Oregon State University. As an adult, I enjoy spending weekends and summers traveling outside. This includes trips to the mountains or to the coast for hiking and surfing. I am fortunate to live in an area that allows one to uniquely experience a direct connection between the mountains and the sea.

SaddleMountainView.jpg

View from Saddle Mountain on Earth Day. It was also clear enough to see Mt. Hood,  Mt. St. Helens, Mt. Rainier, the Columbia River, Astoria, and the beach.


Bike.jpg

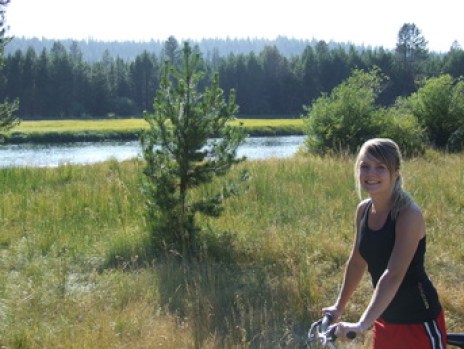
Biking along the Deschutes River near Bend, OR.

I started my teaching career on the Oregon Coast at Toledo Elementary. With the school so close to the ocean and a district committed to teaching the Ocean Literacy Principles, integrating ocean studies into the classroom was an easy task. A continuing sixth grade project at Toledo includes designing, building and competing in the MATE ROV (Underwater Remote Operated Vehicle) competition.

ROVs.jpg

Student submitted ROV: “Greatest of all ROVs” at the 2014 MATE ROV Regional Competition

 In my current position, it has been a bit more challenging to integrate ocean studies into the classroom. I am teaching in a large urban school district and my student numbers have doubled. However, facilitating meaningful student experiences and inspiring a love of the ocean is critical to moving forward and aligns with my own personal passions. I am looking forward to my time aboard the Thomas Jefferson and am excited to make connections and bring hands-on experiences back to my classroom at Twality Middle School.

Diving.jpg

My first dive in Kewalo Harbor with Gabe Scotti from Kaimana Divers. [Source: Chris McKenna]


Happy World Oceans Day!