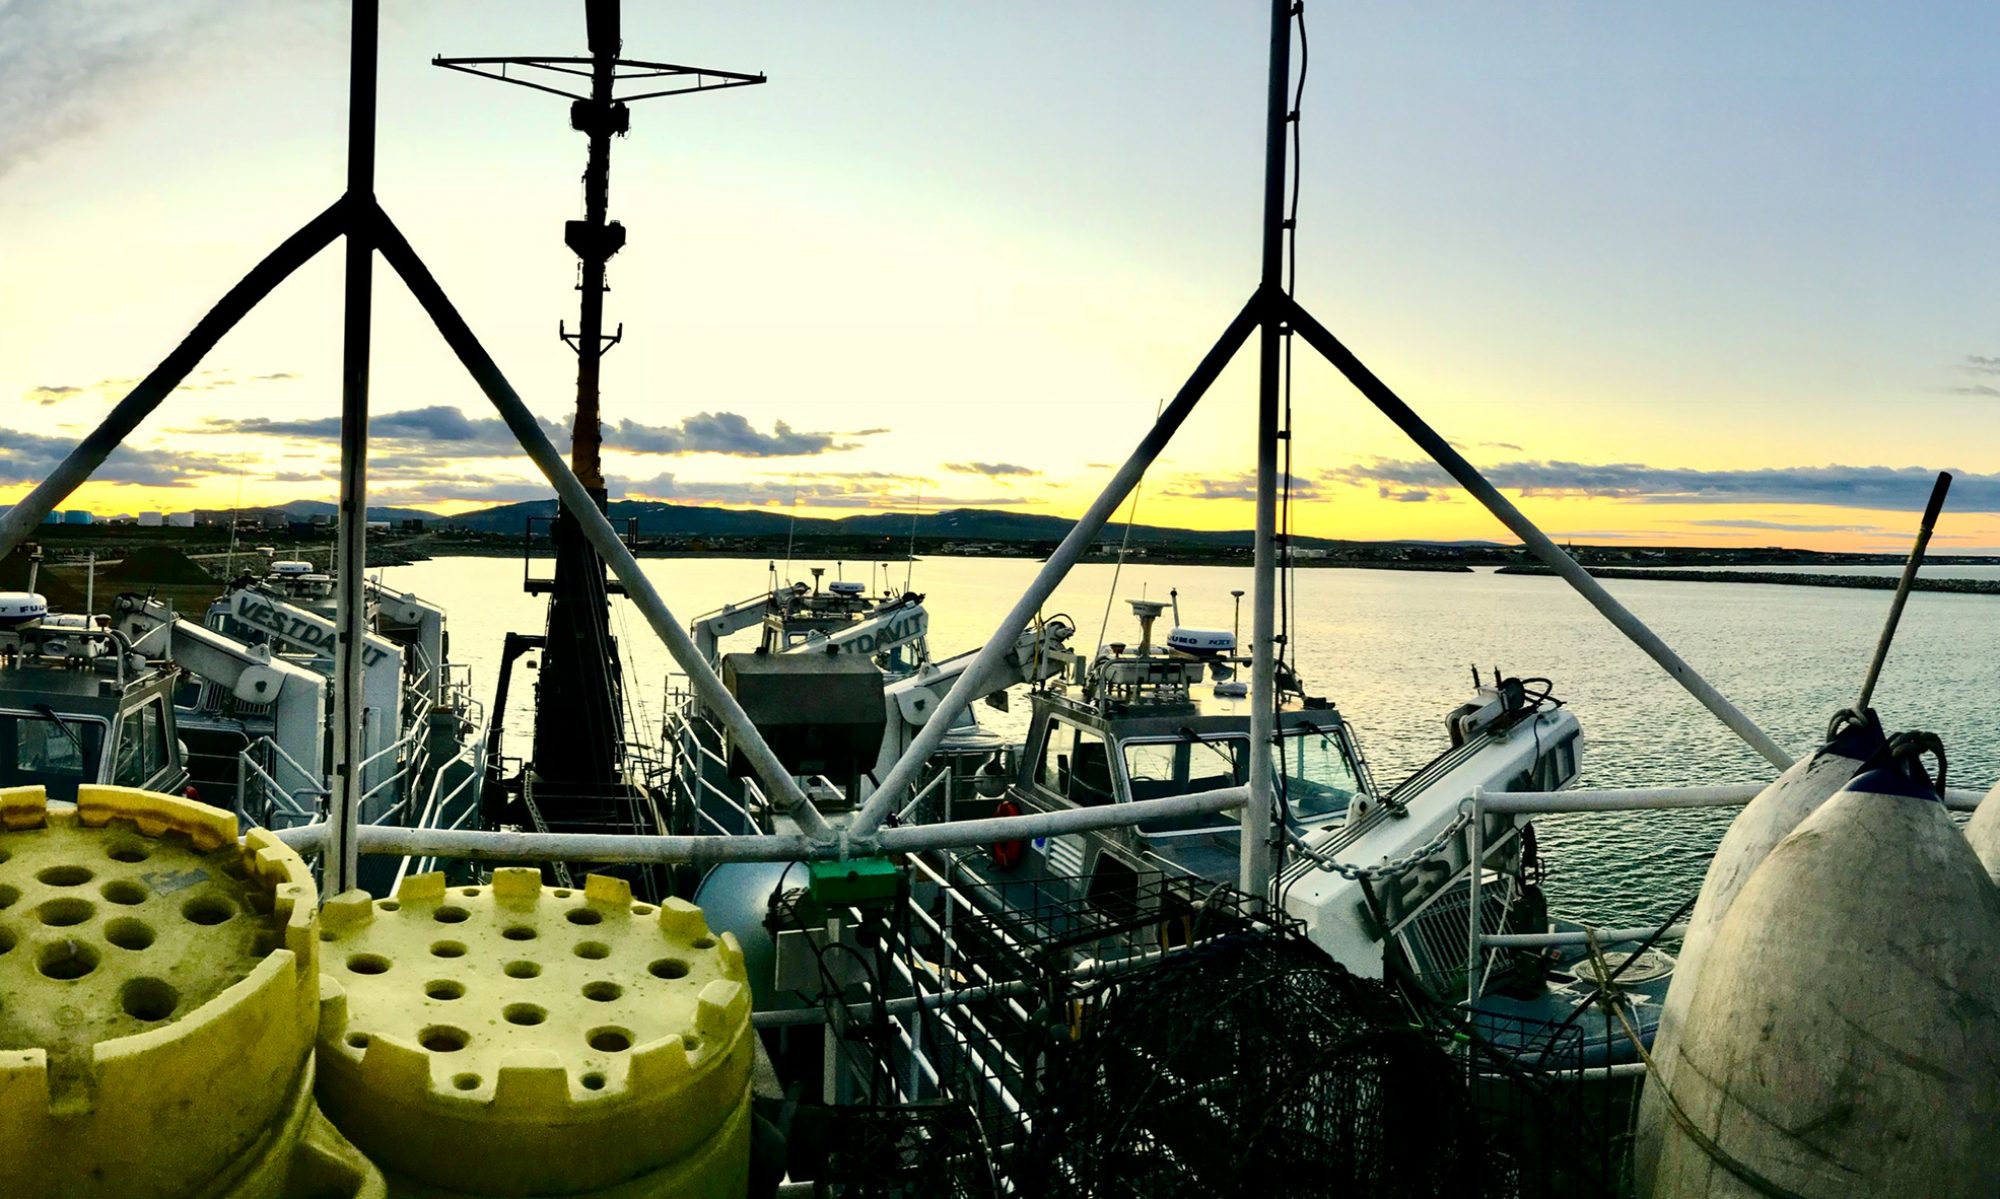
Christine Hedge, August 10, 2009

NOAA Teacher at Sea
Christine Hedge
Onboard USCGC Healy
August 7 – September 16, 2009 

Mission: U.S.-Canada 2009 Arctic Seafloor Continental Shelf Survey
Location: Chukchi Sea, north of the Arctic circle
Date: August 10, 2009

Science and Technology Log 

Christina with a CTD

This trip is all about data collection.  In addition to our main seafloor mapping mission, each day there are buoys, sensors, or weather balloons deployed each collecting important data to help us understand the Arctic environment.  This ocean is a harsh place. The objects that are placed underwater to collect data (like the HARP instruments that were retrieved earlier this week) need to be able to withstand cold, salt, pressure, and for those on the surface, wind and waves. Designing such a device to work for long periods of time in the Arctic must take great engineering skills.

The pressure of the deep ocean is an amazing force.  If you have ever lost your goggles in the deep end of a pool – you know that water pressure increases with depth. Water is much heavier than air (about 1000 times heavier).  Any instrument sent to the bottom of the Arctic Ocean is under a column of water that literally squeezes it with massive weight.  In fact, the weight of just a 10 meter thick slice of ocean is equivalent to the weight of the entire atmosphere.  Of course there is a scientific name for this increase of pressure due to the weight of the water above you. It is called hydrostatic pressure.

A simple experiment to illustrate the type of forces these scientific instruments endure involves Styrofoam cups!  In fact, yesterday folks were encouraged to decorate a Styrofoam cup.  The cups were gathered into a mesh bag and sent down 3800 meters attached to a device, which measures the conductivity, temperature, and depth of the water as it descends (a CTD).

Styrofoam cups after their trip on the CTD

Styrofoam can be thought of as plastic netting filled with air.  This is why it is such a good insulator and so light.  If we squeeze it with our hands, we can make the netting tighter and the Styrofoam becomes tight balls of plastic.  If we lower the Styrofoam cups to great depths within the ocean – just think of the huge amount of hydrostatic pressure they are under!!!

The cups went to a depth of 3800 meters and shrank from about 4 inches to less than 2 inches!  The weight of the water above them squeezed the air from the Styrofoam and gave us teeny cups – the shape didn’t change much – just the size. When engineers build instruments to study the ocean – such forces must be considered carefully.

Something to Think About 

Besides diving into a swimming pool, can you think of another place in your world where pressure changes impact the environment?

Personal Log 

Sea ice
Sea ice

I’m getting used to the life on board a ship. The crew is very helpful. They point me in the right direction when I get lost (which happens a lot) and help me to find basic comforts such as ice, the gym, and the laundry.  I am amazed at how many doors I have to open and close to get from one place to another. The doors, designed to withstand water and fire, are heavy and take some upper body strength when we are in windy conditions.

They can also be very noisy and since someone is always sleeping on a ship that operates 24/7 we need to be considerate and move through them quietly.  The further north we go the calmer the water gets.  It is a real treat to walk out on deck and see the water smooth as glass, the blue and white ice chunks, and nothing but sky in front of us.

Ginger Redlinger, July 29–31, 2007

NOAA Teacher at Sea
Ginger Redlinger
Onboard NOAA Ship Rainier
July 15 – August 1, 2007

Mission: Hydrographic Survey
Geographical Area: Baranof Island, Alaska
Date: July 29–31, 2007

Weather log on the RAINIER.  Data is gathered, then entered into a database.
Weather log on the RAINIER. Data is gathered, then entered into a database.

The RAINIER started its work in South East Alaska in April of this year. Four months and hundreds of nautical miles later it was time to leave: Juneau, Ketchikan, Sitka, Baranof Island, and the Gulf of Esquibel. Three or four research boats were in the water everyday rain or shine, calm or rough water, gathering data. At night, crews’ maintained watch, reviewed data, and planned for the next day’s work. Equipment was checked to ensure everyone’s health and safety.  Quality control ensured that the data gathered met NOAA’s expectations. Now it is time to end the Alaskan part of their work and move to their next working location.

While traveling from South Each Alaska to Washington I reflected on the most memorable parts of the journey.  I immediately remembered the compliments from pleasure boaters and fishermen about NOAA’s work. Next I thought about the ease at which the crew safely delivered and returned their equipment and crew to and from the ship each day.  Then I thought about the NOAA resources I learned about as I studied information about hydrography, technology, satellites, weather, and tides.  And how could I not mention the food – it was great. Good food compensates for the sacrifice of being away from home for such a long time.

Water from the Fraser River (green) and the southern end of  Georgia Strait waters.
Water from the Fraser River (green) and the southern end of Georgia Strait waters.

There would be a short break between the end of this voyage and the start of the next, some would remain on the ship, and for others it meant being “at home” for the first time since April. This is part of the sacrifice that mariners, and those who explore the oceans make.  As we traveled closer to home many off-duty crewmembers gathered on the fly deck to see home slowly approaching from the distance.  They shared stories from the last four months and recalled the moments of laughter on “the big white ship.” After traveling through Canadian waters, around Vancouver Island and into Puget Sound, people began to gather in earnest of the desk. At first I thought it was because we were taking a picture for a “NOAA 200th Anniversary Postcard from the Field,” but many remained on deck. Many were anxious for the first glimpse of their families and their homes.  Many of their family members arrived at the Ballard Locks – waving and communicating their excitement about the reunions that would happen in a few short hours.

Mt. Rainier and Seattle in the distance.

The sun is setting as we traveled past the many marinas for all types of marine vessels, houseboats, and dry-docks. As we passed through crewmembers neighborhoods the fading sunlight was replaced with light shining in their eyes as they talked about the view from their windows, their favorite neighborhood haunts, and local treats that mean “home.” As we turn toward the waters that lead to downtown Seattle the crew on the fly deck is silent. The last embers of sunlight are reflecting on the downtown Skyline, it is spectacular.  We turn away from downtown and travel through the Fremont Cut.  Thank goodness for the navigational skills of this young and talented team – the water traffic from Seattle’s SeaFair was busy. Once we arrived at the NOAA Western Regional Center in Sand Point, CO Noll’s work was done.  He had trained his crew to successfully navigate the ship and complete the mission.  We are all home; the final navigational command is given.

Rear Admiral De Bow handing the Command Coin to Commander Noll

“All Engines Stop” “All Engines Stop, Aye. – All Engines Stopped” “Very Well.” Rear Admiral De Bow was on board to congratulate him, and pass the time-honored command coin.

I hate to admit it, but like a kid at camp leaving a new set of friends knowing that I most likely will not see many of them again, I feel sadness. The memories and lessons will remain.  What a great adventure for a teacher, what a great experience for those who work on the ship, and what a great service provided to those who depend on navigation for commerce, recreation, and those who seek a greater scientific understanding of the earth and how it changes. I can’t wait to share it all with my students and colleagues!!!!

The Seattle skyline at night

Stacey Klimkosky, July 20, 2009

NOAA Teacher at Sea
Stacey Klimkosky
Onboard NOAA Ship Rainier
July 7 – 24, 2009 

Mission: Hydrographic survey
Geographical area of cruise: Pavlov Islands, Alaska
Date: July 20, 2009

Weather Data from the Bridge 
Position: 55°08.590’N, 161°41.110’W
Weather: OVC
Visibility: 10 nautical miles
Wind speed: 8 knts.
Waves: 0-1 ft.
Sea temperature: 8.9°C
Barometric pressure: 980.0mb
Air temperature: Dry bulb=9.4°C, Wet bulb=8.9°C

Science and Technology Log 

I am releasing the springs on the bottom sampler.  Asst. Survey Technician Manuel Cruz waits for the claws to open which will allow us to empty the “g stk M” (green sticky mud) into a bucket for observation.
I am releasing the springs on the bottom sampler. Asst. Survey Technician Manuel Cruz waits for the claws to open which will allow us to empty the “g stk M” (green sticky mud) into a bucket for observation.

One of the most interesting (and fun) mornings onboard Rainier happened during our first week at sea. After doing a few days of surveying from an anchorage off SW Ukolnoi Island, we began a transit to a new anchorage off of Wosnesenski Island. On the way, we took a series of bottom samples from Rainier’s deck. The purpose of taking a bottom sample is to determine the composition of the ocean floor.  It is important to record this data and combine it with bathymetric survey data so that ships will know whether or not the area is good for anchoring. A muddy or sandy bottom is best because the anchor can take hold. A stone-covered bottom is not desirable for anchoring because the anchor cannot dig in, and, if it does, there is this risk that it could break if caught under a large stone.

Taking bottom samples is a rather simple process.  We work in teams of three on deck.  One person is in the Plot Room to record data and prepare for the next sample. On deck, a crew member operates a winch that is attached to an A-frame.  At the end of the cable is a claw-like, spring-loaded bottom sampler that is lowered into the water. As it descends, the winch operator calls out depths to one of the two people taking the sample.  The depth is relayed to the bridge via radio.  When the claw hits bottom, the springs disengage and the claws clamp shut, holding a sample.  The person in the Plot Room listens for the direction “Mark”, and marks the sample’s position on the computer program.  As the sample is raised, the winch operator calls out the depths again.  This information is radioed to the bridge along with any corrections they must make to adjust the ship’s position.  For example, “50-straight up and down” means that the sampler is at 50 meters and the cable is straight up and down (the way you want it to be). A call of “aft” or “forward” means that the cable is coming up at an angle and the bridge must help to correct this.

Once the sample is raised, it is emptied into a bucket and examined for color and composition.  This is radioed to the Plot Room and recorded.  The bottom sampler is readied for the next drop as the Plot Room directs the ship to the next location and readies the computer program for the next data input. During our bottom sampling, the data was all recorded at “g stk M”—green, sticky mud.  It had a sulfuric smell, which, if you think about all of the volcanoes in the area, makes sense.

Personal Log 

This will be my final Ship Log, as we are scheduled to pull anchor this afternoon and start our transit to Kodiak Island. I can’t believe that the end of three weeks is coming to a close.  I was talking to the CO about the number of people and/or agencies who contribute to the production of an individual chart. There are large groups—like NOAA, the Coast Guard and the Army Corps of Engineers, for example.  There are also smaller groups and individuals as well.  Everything from sounding depths to buoy locations to shoreline topography to notes on the locations of buildings, lighthouses and even church steeples are included.  I’ve spent some time studying the current paper chart of the area we have been surveying (#16549:  Alaska Peninsula, Cold Bay and Approaches) and the most striking feature is, of course, the absence of data in the center. I can’t wait to acquire an updated copy when it is available (some sources say, depending upon the priority, could be up to three years; although the NOAA goal is “Ping to Chart in 90 days”). Knowing that I helped to play even a very small part in helping improve navigation safety is a great feeling!

I’d like to thank the officers and crew aboard Rainier for making my Teacher at Sea experience the adventure of a lifetime!  I’ve learned so much about life at sea from new friends who have been patient and hospitable. I leave with a great respect for all of the individuals who call Rainier both work and home for eight or nine months out of the year.  They are away from husbands, wives, children, friends and pets for a long time; however, the community that they have built aboard the ship seems to offset some of the wishing for home.  Safe Sailing and Happy Hydro, my friends!

Panorama of Pavlof Volcano and Pavlof Sister

Did You Know? 
If you are interested in learning more about hydrography and the work done on Rainier, here are some of my favorite links:

-NOAA’s hydrographic survey home page

-Interactive online activity about seafloor mapping

-Search for historic nautical charts and compare how they change from year to year.

Alaska Fun Facts 
Kodiak Island is, at 3,588 sq. miles, the second largest in the United States.  It is the oldest European settlement in Alaska and is known as Alaska’s “Emerald Isle”.  Before its “discovery” by Russian explorer Stephen Glotov in 1763, the island was occupied solely by the Sugpiaq (Alutiiq) people.  In 1912, Kodiak was caught in the drifting ash from the eruption of Novarupta Volcano which buried the island under 18 inches of ash.  A more recent natural disaster targeted the island in 1964, when a 9.2 earthquake struck Alaska and set off a tsunami.  This seismic sea wave virtually destroyed downtown Kodiak and its fishing fleet. Today, over 13,000 residents call Kodiak home.

Stacey Klimkosky, July 17, 2009

NOAA Teacher at Sea
Stacey Klimkosky
Onboard NOAA Ship Rainier
July 7 – 24, 2009 

Mission: Hydrographic survey
Geographical area of cruise: Pavlov Islands, Alaska
Date: July 17, 2009

Weather Data from the Bridge 
Position: 55°13.449’N, 161°22.745’W (Wosnesenski Island)
Weather: OVC, H (overcast, hazy)
Wind: light
Seas: 0-1’
Sea temperature: 8.3°C
Barometric pressure: 1010.8 mb
Air temperature: 12.2°C dry bulb, 11.1°C wet bulb

Here is what the feature (shipwreck) looks like on a chart whose data has been “cleaned” and finalized.  “Wk” is the abbreviation used for wreck on a nautical chart.
The feature (shipwreck) on a chart whose data has been “cleaned” and finalized. “Wk” stands for wreck on the chart.

Science and Technology Log 

Throughout the day when you are on a launch collecting hydrographic survey data, there are terms and concepts that come up repeatedly—namely, low vs. high frequency and resolution.  The multi-beam sonar on the launches has dual frequencies—high and low.  This, combined with the fact that there are multiple beams instead of just one “pinging” off of the ocean bottom, allows the hydrographer to customize the technology for the conditions of the day.  Low frequency is used in deeper water.  The multi-beam is operated in high frequency in shallow water. According to my Hydrographer In Charge (HIC) on a recent survey, Barry Jackson, the depth at which you would change frequencies is about 50 meters.  Low frequency sends out fewer pings per second, but low frequency sound travels further through water.  Conversely, high frequency sends out more pings, but high frequency sound does not travel as far through the water. Therefore, high frequency gives you an image that is more precise.  Why would you want a higher quality image in shallower water?  As a navigator, it is important that the obstructions and underwater features closer to the surface be the most clear, for those are the ones that you are most likely to hit.

Underwater feature identified as a shipwreck by Rainier hydrographers in Elliot Bay, WA.  (l-r: 4m resolution; 2m resolution; 1m resolution)  Courtesy: ENS Shultz
Underwater feature identified as a shipwreck by Rainier hydrographers in Elliot Bay, WA. (l-r: 4m resolution; 2m resolution; 1m resolution) Courtesy: ENS Shultz

The day’s polygon (or survey area) data is also configured to be collected at a certain resolution.  Resolution, like frequency, affects the detail of an underwater feature.  The resolution also depends upon the depth of the water; however, there are more choices.  On Rainier, the resolution changes based upon depth at the following increments.  (On this mission, 4m resolution is the least.)  Note that there is some overlap. To demonstrate how applying different resolutions to the same feature can change how it is viewed, ENS Christy Shultz showed me the bathymetry (the topography of the Earth’s surface underwater) of a shipwreck surveyed in Elliot Bay, near Seattle, WA.  If you look at the corrected data for the object at 4 meter resolution and compare the same image at 2 and 1 meter resolution, you will see that as the resolution gets higher (the number actually gets lower), the image goes from being fuzzy to quite clear.

Chief Boatswain Jimmy Kruger demonstrates how to use a line-throwing device, the PLT.

Personal Log 

There are some days when I do not go out on a survey launch.  These days are great for taking a peek around the ship to see what happens in different departments or to have safety drills and demonstrations.  Recently, we had the second of our weekly abandon ship and fire/emergency drills.  After the drills, the entire crew who was on board (not out on launches) watched a video clip about a piece of rescue apparatus called a PLT, or Pneumatic Line Thrower.  Then we all went to the fantail for a demonstration.  The PLT is a rescue device that a ship can use to get a line out to another ship or individual in distress. It uses compressed air to fire a line attached to a rocket-shaped weight. The demonstration and overall design of the PLT reminded me of a piece of historical rescue equipment familiar to many who live on Cape Cod, MA and other coastal communities–a Lyle gun.

A Lyle gun and Faking box (held the wound line)
A Lyle gun and Faking box

A Lyle gun is a small cannon that was used by the U.S. Lifesaving Service in the late 1800s to fire a lightweight line onto the mast of a sinking ship when conditions were too severe to launch a surf boat.  When the line was secured, a paddle-shaped board that contained instructions, a block and pulley and heavier lines were sent across.  After the line was secured to the mast, the lifesavers would assemble a breeches buoy to haul the sailors to safety across the raging seas. The breeches buoy was a large pair of canvas pants (breeches) secured to a life ring. A pulley system allowed the lifesavers to transfer one man at a time from ship to shore.  You can read more about lifesaving, the Lyle gun and breeches buoy here.

Did You Know? 
Rainier is like a small, self-contained floating city.  She generates her own power, treats her own waste water, and makes her own drinking water.  The ship is only limited by the amount of food and fuel on board.

Alaska Fun Facts 
As I noted in my Ship’s Log #2 on July 10, Wosnesenski Island has a herd of feral cows roaming its treeless hills and valleys.  Since then, I have been given more information about them.  The original bovines were probably brought here by the Osterback family in the early 1900s. The family lived an isolated lifestyle, raising blue fox to trade their pelts to London furriers. You can read more about one of the nine Osterback children, Lily, here.

One Saturday evening, the CO (Commanding Officer) granted shore leave for a beach excursion.  My fellow TAS, Dan Steelquist and I found what is, most likely, left of the Osterback homestead on Wosnesenski Island.
One Saturday evening, the CO (Commanding Officer) granted shore leave for a beach excursion. My fellow TAS, Dan Steelquist and I found what is, most likely, left of the Osterback homestead on Wosnesenski Island.

Dan Steelquist, July 16, 2009

NOAA Teacher at Sea
Dan Steelquist
Onboard NOAA Ship Rainier
July 6 – 24, 2009 

Mission: Hydrographic Survey
Geographical Area: Pavlov Islands, Gulf of Alaska
Date: July 16, 2009

Weather Data from the Bridge 

Latitude: 55°13.522’ N Longitude: 161°22.795’ W Visibility: 10 Nautical Miles Wind Direction: 174° true Wind Speed: 15 knots Sea Wave Height: 0-1ft. Swell Waves: N/A Water Temperature: 8.3° C Dry Bulb: 10.6° C Wet Bulb: 10.6° C Sea Level Pressure: 1021.0 mb

Science and Technology Log 

The primary mission of the Rainier is to gather hydrographic sounding data. For this leg of the summer field session, that data collection is done by a number of small launches that go out to work each day from Rainier. On a typical day four twenty-nine foot survey launches are deployed from the ship, each with an assigned area to gather data. Each launch is equipped with a multibeam sonar device that sends sound signals to the bottom and then times how long it takes for the signal to return to the receiver.  Knowing how fast the signal will travel through the water, the length of time the signal takes to leave and return to the sounder determines the depth of the water at that point.

Here I am preparing the CTD to take a cast.

For many years sonar devices have only been able to measure the water depth directly below a survey vessel.  Now, with multibeam sonar, survey vessels can cover a larger swath of seafloor with hundreds of depth measurements being taken at a time. Once the data is processed, a “painted” picture of the bottom surface can be generated. Once a launch is in its assigned work area, the sonar is turned on and the boat goes back and forth in a prescribed pattern to gather data on water depth, essentially providing total coverage of what the seafloor looks like in that area. The coxswain (person driving the launch) has a computer screen with a chart of the coverage area and steers the launch over the planned area. As the launch moves along the path of sonar coverage its path shows up on the screen as a different color, letting the driver know where the boat has been.

In order for data to be interpreted accurately, there are many steps in the process from data acquisition to actual placement on a nautical chart. There is one very important piece of data that needs to be gathered in the field as the launches do there work with the sonar. Sound waves can vary in speed as they travel through water, depending on certain conditions. In order for accurate depth readings to be acquired, those conditions must be known. Therefore throughout the data gathering session, hydrographers must acquire data on the condition of the water. That is where a CTD cast comes in. CTD stands for conductivity, temperature, depth. Every few hours a CTD cast must be done in order to accurately interpret the data gathered by the sonar. The device is lowered over this side of the launch and allowed to sink to the bottom. As it descends, the CTD gathers data at various depths. When recovered the CTD is connected to a computer and its data is integrated with the sonar data to acquire more accurate depth readings.

Personal Log 

I’ve been on the Rainier now for twelve days. While there are certain routines on board the ship, there isn’t much routine about the work these people do. I continue to be impressed with how everyone applies their skills to their work in order for data to be gathered. Much of the area where we are working has never been charted before and much of what has been charted was done before World War II with lead lines (dropping a piece of lead attached to a line, and counting the measured marks on the line until it hits bottom). The details acquired by multibeam sonar are truly amazing. We will be here in the Pavlof Islands for a few more days and then head back to Kodiak, where I will get off the ship. Not long to go, but there is still much for me to learn!

Something to Think About 
How long would it take you to paint an entire house with dots from a very small paintbrush? That would be like using a lead line to gather depth information. How long would it take you to paint an entire house with a very small, narrow paint brush? That would be single beam sonar. How much time could you save by using a wide paintbrush? That would be multibeam sonar.