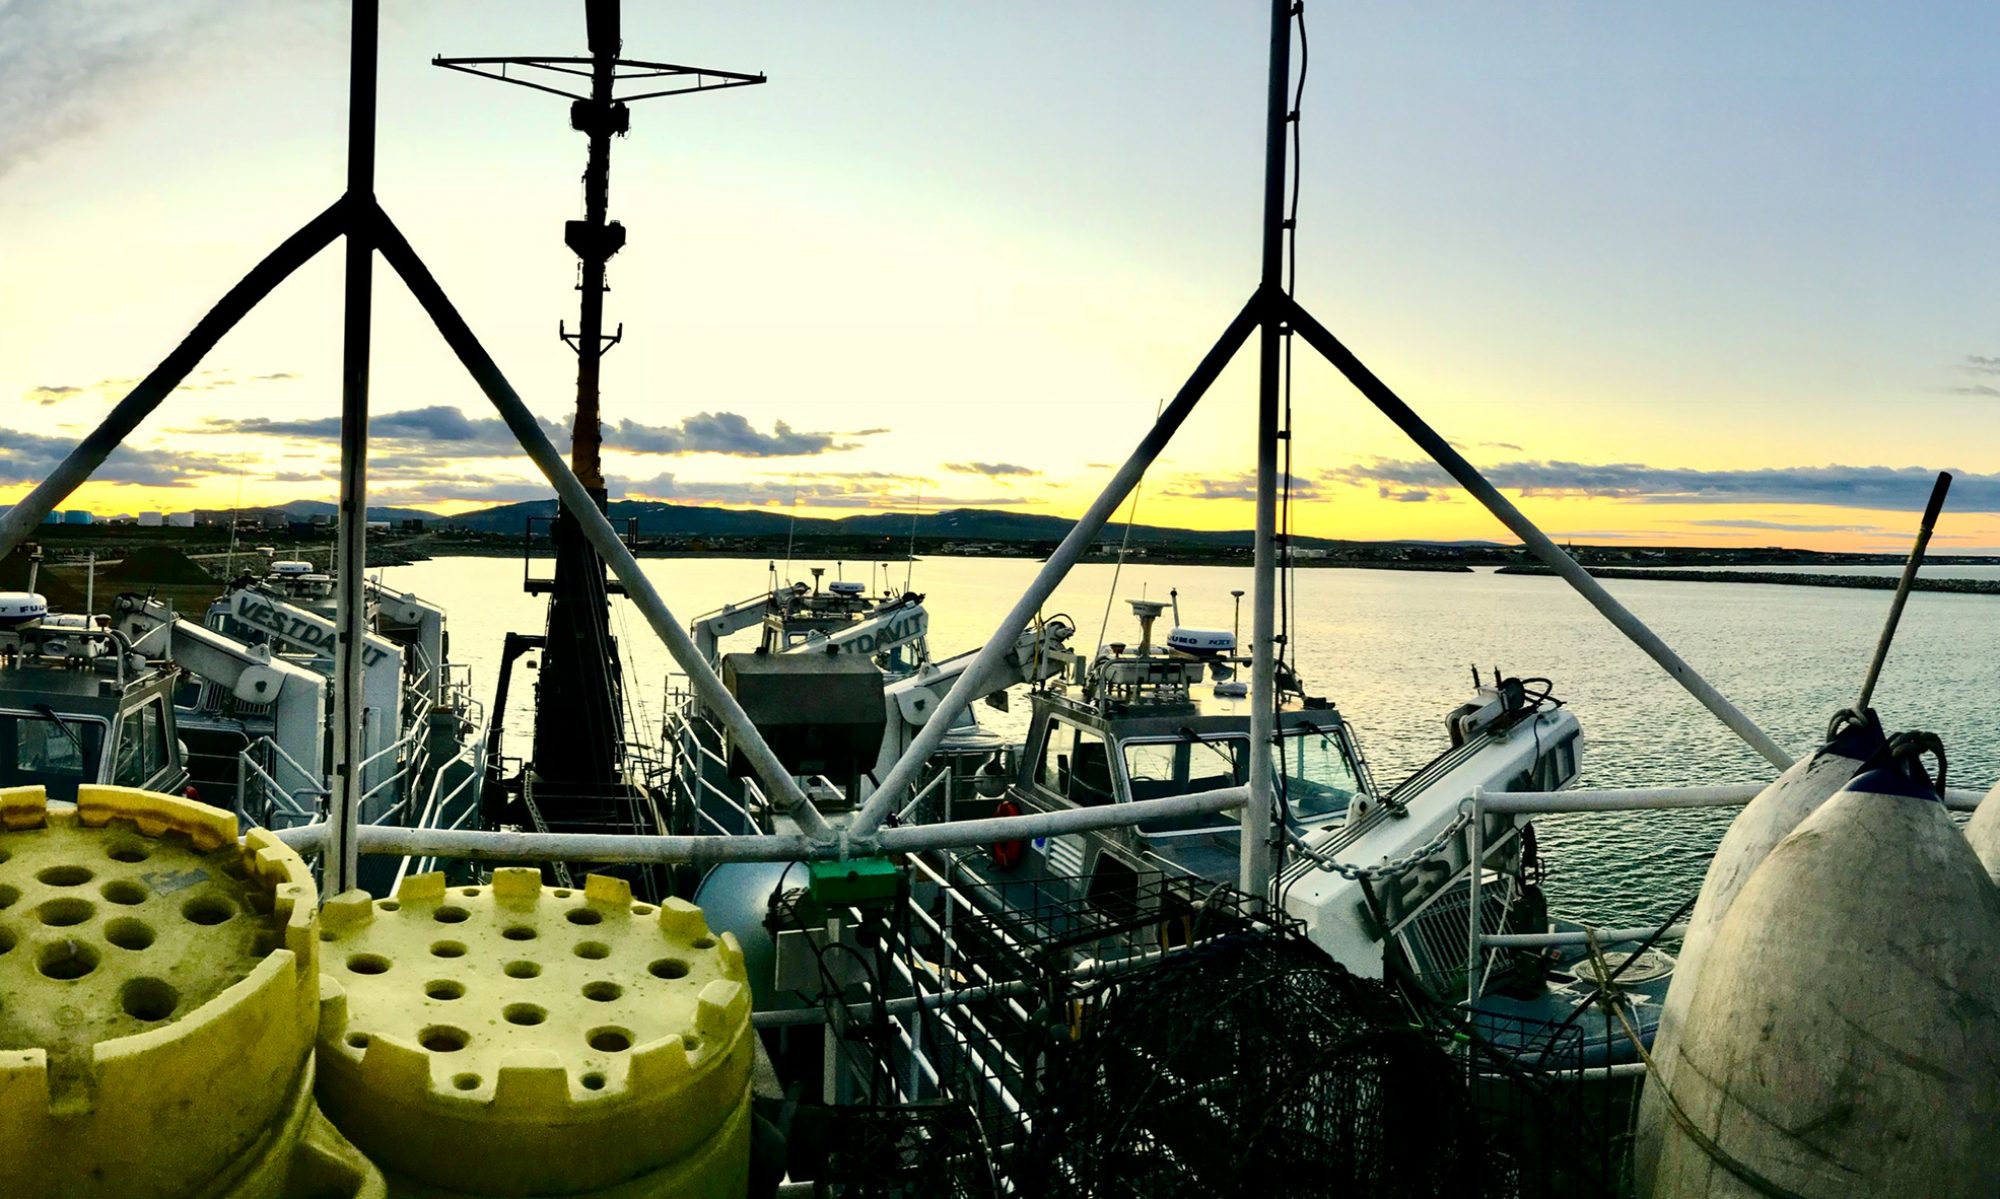
Christy Garvin, June 7, 2005

NOAA Teacher at Sea
Christy Garvin
Onboard NOAA Ship Rainier
June 1 – 8, 2005

Mission: Hydrographic Survey
Geographical Area: Aleutian Islands, AK
Date: June 7, 2005

Weather from the Bridge

Latitude:56 deg 59 min N
Longitude: 135 deg 17 min W
Visibility: 11 nautical miles
Wind Direction: 290 deg
Wind Speed: 10 kts
Sea Wave Height: 0-1 ft
Sea Water Temperature: 50deg F
Sea Level Pressure: 1011.7 mb

Science and Technology Log 

Although we have been parked in protected Aleutkina Bay for most of the leg, yesterday afternoon we pulled anchor and the ship was underway.  Because of weather conditions, it was determined that the ship would run hydro in deep water, while the launches continued protected shoreline work.

The ship is equipped with a Seabeam 1050 MKII; it is a dual frequency echosounder with 50KHz and 180KHz operating frequency. When operating at the 180 KHz frequency a maximum depth of 620 meters can be surveyed.  This depth can be increased by switching to the 50 KHz frequency, which can reach depths of 3,100 meters.  The Seabeam 1050 has a wide horizontal scan area that is covered by 126 adjacent beams and a 150-degree swath width; it has high resolution due to the narrow beams it uses.

While the ship is doing hydro, the crew transitions into 24-7 watches.  The ship runs survey lines all night, so people are needed to steer the ship, serve as lookouts, and run the survey equipment.  The watches are four hours each, and crewmembers work two watches a day. The three shifts are 12:00-4:00, 4:00-8:00, and 8:00-12:00; people are sleeping at different times, so everyone makes an effort to be quiet during the day.

One of the highlights of today was an in-depth tour of the ship by the CO, John Humphrey.  I was able to see the engine room with the two main engines, the after steerage (where the rudder and emergency steering are located), and the evaporator unit that processes salt water into potable fresh water.  We also went into the large refrigerators and freezers that hold the ship’s stores and climbed down into the bowels of the ship to see the fire prevention carbon dioxide system.

Personal Log 

It is interesting trying to sleep while the ship is underway. Although the seas aren’t very rough, the ship still moves quite a bit.  I haven’t been seasick (I’m very thankful for that), but I rolled all over my bunk last night.  It felt like I was trying to hold myself in the bed as I slept.

Christy Garvin, June 6, 2005

NOAA Teacher at Sea
Christy Garvin
Onboard NOAA Ship Rainier
June 1 – 8, 2005

Mission: Hydrographic Survey
Geographical Area: Aleutian Islands, AK
Date: June 6, 2005

Weather from the Bridge

Latitude:56 deg 59 min N
Longitude: 135 deg 17 min W
Visibility: 11 nautical miles
Wind Direction: 290 deg
Wind Speed: 10 kts
Sea Wave Height: 0-1 ft
Swell Wave Height: 0 ft (we are in a protected bay)
Sea Water Temperature: 50deg F
Sea Level Pressure: 1011.7 mb

Science and Technology Log 

My assignment today was to work on launch RA-2 taking bottom samples and running “holiday lines.”  A holiday line is an area where previously drawn survey lines did not provide 100% coverage of the ocean floor, in other words, a small hole in the data.  Our launch was working on sheet R in Leesoffskaia Bay and Aleutkina Bay.  These bays are near Emengton, Long, and Baranoff Islands. Taking bottom samples is a very simple but important task.  The information gathered allows boaters to know where good anchorage locations are and fishermen to figure out probable fish habitats and increase their yield.

In order to take a bottom sample, survey techs pre-select specific locations to be sampled.  Once in the launch, the target is selected on the computer, and the coxswain drives to that location. The survey tech then takes a depth sounding to record the exact location and depth where the bottom sample is being taken.  A device called a clam is attached to a rope and thrown overboard; when the clam hits the bottom a spring releases causing the “mouth” to shut and capture sediments on the ocean floor.  The clam is then pulled to the surface and opened so that the survey tech can record the type of sediment or rock present. Later, this data is added to nautical charts as an aid to boaters.

Personal Log 

Last night the crew of the RAINIER had a nice beach party.  A nearby island was chosen, and crewmembers were ferried over to stretch their legs, hike around the island, and enjoy a bonfire. It was a nice surprise to end the weekend.

Christy Garvin, June 5, 2005

NOAA Teacher at Sea
Christy Garvin
Onboard NOAA Ship Rainier
June 1 – 8, 2005

Mission: Hydrographic Survey
Geographical Area: Aleutian Islands, AK
Date: June 5, 2005

Weather from the Bridge

Latitude: 56 deg 59 min N
Longitude: 135 deg 17 min W
Visibility:12 nautical miles
Wind Direction: 275 deg
Wind Speed: 10 kts
Sea Wave Height: 1-2 ft
Swell Wave Height: 0 ft
Sea Water Temperature: 54deg F
Sea Level Pressure: 1016 mb

Science and Technology Log 

Instead of running survey lines on a launch today, I was assigned to the plot and holograph rooms to learn what happens to the survey data when launches return to the RAINIER each evening.  Depending on the weather conditions, launches return to the ship each afternoon between 1630 (4:30 p.m.) and 1730 (5:30) p.m. Once they have been raised out of the water with the gravity falls davits, the survey techs plug the launch’s computer system into the main system on RAINIER.  At this time, the data is pushed (or downloaded) to the ship’s main network.

Two different software programs are used in the process; the launches use a program called ISIS to run the sonar, while the GPS mapping software onboard is Caris.  Therefore, the data collected on the launches must be converted into a form that can be read by Caris. During the conversion process, data corrections are made based on predicted tides, the sound velocity curve created by the CTD, filtering out the outer, less reliable sonar beams, and total propagated error (a statistical compilation of error based on the specific error inherent within each system).

Once the data has been converted, the survey techs go through each line individually and clean the line by removing random sonar reflections.  These reflections can be due to kelp beds, schools of fish, the boat’s motor, or internal timing of the sonar.  Once all of the lines on a sheet are complete, the sheet is sent to PHB (Pacific Hydro Branch) where the data is used to make nautical charts that are used by the fishing and cruise industries, as well as by any others who navigate these waters.

Personal Log 

The CO of the RAINIER took me out on a skiff for a couple of hours today to see some of the bays near Sitka. We saw a harbor seal, a sea otter, and lots of bald eagles; the mountains seem to rise right out of the water, and they are absolutely breathtaking with their snow-capped tips.

Christy Garvin, June 4, 2005

NOAA Teacher at Sea
Christy Garvin
Onboard NOAA Ship Rainier
June 1 – 8, 2005

Mission: Hydrographic Survey
Geographical Area: Aleutian Islands, AK
Date: June 4, 2005

Weather from the Bridge

Latitude: 56 deg 59 min N
Longitude: 135 deg 17 min W
Visibility: 5 nautical miles
Wind Direction: 300 deg
Wind Speed: 10 kts
Sea Wave Height: 0-1 ft
Swell Wave Height: 0 ft (we are in a protected bay)
Sea Water Temperature: 53deg F
Sea Level Pressure: 1009.8 mb

Science and Technology Log 

On the RAINIER, the crew works right through the weekend, so the workday began at 0800; again, four launches were deployed to run survey lines and take bottom samples.  I was assigned to launch RA-3, and we worked an area on survey sheet Y.

Launch RA-3 ran approximately 40 miles of hydrography using the Sea Bat 8101 Multibeam Echosounder.  The Sea Bat is a 240kHz echosounder that measures the relative water depths across a wide swath that is perpendicular to the launch’s track.  The system is comprised of 5 main parts: the sonar processor, the sonar head, the sonar processor to sonar head signal and control cable, a color monitor, and a computer mouse.  The transmit array, which is a projector section of the sonar head, transmits a pulse of sound energy that travels through the water and is reflected by the sea floor or any object in its path. The reflected signal is received by the hydrophone section of the sonar head, digitized, and then sent to the sonar processor for beamforming.  The processor then generates a video display of the ocean floor that can be viewed on the color monitor.  The Sea Bat can “see” approximately 300 meters, but it is more accurate in depths of 150 meters or less.

The physical process of running survey lines with the Sea Bat is nicknamed “mowing the grass;” this is because the launch actually follows the parallel lines drawn by the survey techs and the launch’s path resembles an individual mowing a lawn.  The survey lines are displayed on a computer screen so the survey tech can highlight a given line for the coxswain to follow. As the launch approaches the line, the survey tech logs the computer data for each line.  Lines vary in length from a few meters to several kilometers.

Personal log 

I learned to drive the launch today, and it was a lot of fun.  I was able to “mow the grass” for about an hour, and I also drove during a man overboard drill.

Previous question of the day:  What is refraction? 

Answer: Refraction is the bending of a sound wave.  In the case of sound traveling through water, different temperatures and pressures cause sound to travel at different speeds; this in turn causes the waves to bend.

Christy Garvin, June 3, 2005

NOAA Teacher at Sea
Christy Garvin
Onboard NOAA Ship Rainier
June 1 – 8, 2005

Mission: Hydrographic Survey
Geographical Area: Aleutian Islands, AK
Date: June 3, 2005

Sea otters drifting amidst the kelp

Weather from the Bridge

Latitude: 56 deg 59 min N
Longitude: 135 deg 17 min W
Visibility:12 nautical miles
Wind Direction: 275 deg
Wind Speed: 10 kts
Sea Wave Height: 1-2 ft
Swell Wave Height: 0 ft (we are in a protected bay)
Sea Water Temperature: 54deg F
Sea Level Pressure: 1016 mb

Science and Technology Log 

Today work began at 0800; four launches were deployed to run survey lines and take bottom samples.  I was assigned to launch RA2, a jet propulsion boat.  We worked an area on survey sheet Z near Low Island and Kruzof; this area is northwest of Sitka near the base of the volcano Edgecomb.

As was discussed yesterday, running survey lines is one of the most important tasks accomplished by the RAINIER.  After technicians have completed all of the preparation work in the plot room, it is time for the launch to be deployed. Many different people play a part in preparing the launch for a day of work.  Deck hands make sure the boat is fueled and has necessary supplies, engineers check the engines and electrical equipment, and the kitchen staff prepares lunch, snacks, and beverages for the crew to take aboard.  At 0745 the deck crew meets the survey crew on the fantail (back deck) of the ship.  The deck crew then lowers the launch using the gravity falls davit, and the survey crew climbs aboard their launch.  Once underway, each launch calls the bridge to inform the officer on watch that the launch is underway with all assigned crewmembers on board.

When the launch reaches its work area, the first thing that must be accomplished is a CTD cast. A CTD is a device that measures the conductivity, temperature, and depth of the water. This information is used to create a sound profile that shows how fast sound travels in the water at various depths.  This is extremely important to know, because the different refractions must be accounted for when data is processed.

The procedure for casting a CTD is relatively simple.  First, the CTD is attached to a rope and turned on for a 3-minute warm-up period.  During this time, the CTD is being calibrated to the air pressure. When the 3-minute warm-up is complete, the CTD is submerged just under the surface of the water for 2 minutes; this allows the machine to calibrate to the water temperature at the surface.  Finally, the device is lowered to the ocean floor and the raised back to the surface.  Once at the surface, the data is downloaded from the CTD to the specialized computer software used aboard the launches. Once this procedure is complete, it is time to begin running survey lines.

Personal Log 

One of the neatest things that happened today was a sea otter spotting. As we were working survey lines around some kelp beds, we noticed 10-15 sea otters playing in the beds. They were very cute, and it was an excellent opportunity to observe them in the wild.

Question of the day: What is refraction? 

Previous question of the day: What is a CTD? Answer: A CTD is a device that measures conductivity, temperature, and depth.  Before a launch uses its SWMB (Shallow Water Multi Beam), the crew must cast a CTD to gather information about how sound waves are being diffracted due to the pressure and temperature at various depths.