Kristin Joivell, June 22, 2009

NOAA Teacher at Sea
Kristin Joivell
Onboard NOAA Ship Fairweather
June 15 – July 1, 2009 

Mission: Hydrographic Survey
Geographical area of cruise: Shumagin Islands, Alaska
Date: June 21-22, 2009

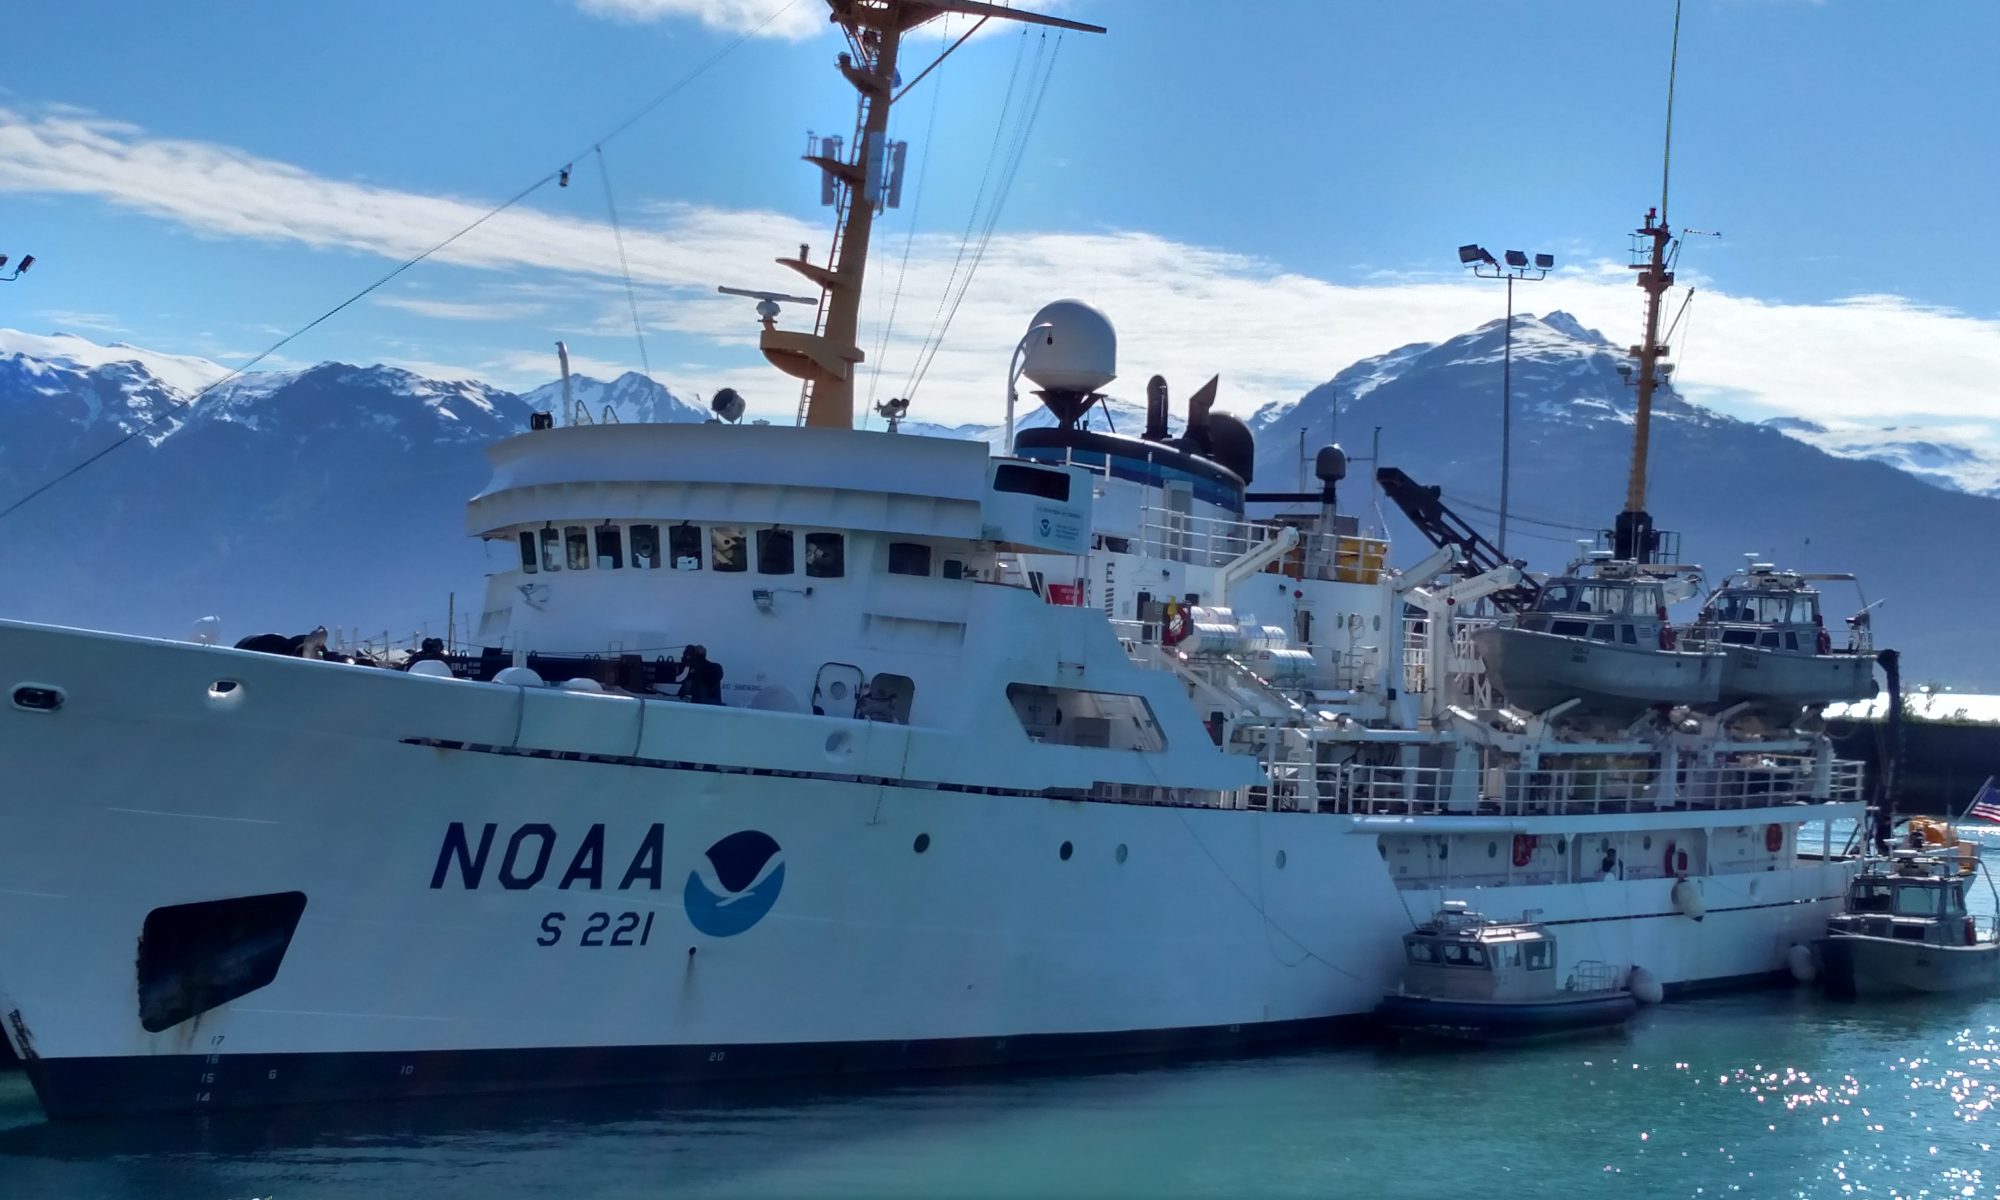
The Fairweatherrests at anchor in Northwest Harbor.

Weather Data from the Bridge   
Position: Northwest Harbor
Clouds: Mostly Clear
Visibility: 10+ miles
Wind: 13 knots
Waves: less than 1 foot
Temperature: 8.2 dry bulb
Temperature: 7.2 wet bulb
Barometer: 1007.0

Science and Technology Log 

Launches are excellent for collecting data near the shoreline, but the Fairweather is better at open water data collection. The polygons are larger, but the ship must still be traveling at approximately 6 knots for optimum results.  The ship also uses the multibeam to sweep the ocean floor, just like the launches.  Of course, multiple computer screens are again necessary to monitor data collection on the ship. Also similar to the launches and their CTD’s, the ship uses a device called a Moving Vessel Profile (MVP) that collects information about sound velocity as it is dropped through the water. It is commonly called the “fish” since it is dropped into the water and manipulated to “swim” at different depths for data collection.

Here I am dislplaying the MVP or “fish” that will be deployed periodically throughout data collection to measure sound velocity, temperature, and pressure of the water.

A definite advantage of the MVP is that the fish can be deployed while the ship is moving; however, the launch must be stopped to use the CTD.  Additionally, the MVP measures sound velocity directly where as the CTD collects data that must be plugged into a formula to calculate the measurement for sound velocity. Data collected from both the launches and the ship must be processed and converted.  Much of the data processing involves moving data uploaded from launches into networked folders.  At times while I watched data processing, there were too many folders open on multiple computer screens for me to personally keep track of.  Also, I noticed certain data sets being converted from one form to another.  Sometimes, the data conversion takes a long time so computers must be marked so nobody interrupts the conversion process.  Patience, computer literacy, and organization skills are a must for working on data processing!

In this picture I’m attempting to clean “dirty” data.  The screen on the left shows a 3D image of the ocean floor.  The screen on the right shows a 2D image of the ocean floor that is color coded based on depth. As you can see, dirty dishes also tend to collect when cleaning dirty data!
In this picture I’m attempting to clean “dirty” data. The screen on the left shows a 3D image of the ocean floor. The screen on the right shows a 2D image of the ocean floor that is color coded based on depth. As you can see, dirty dishes also tend to collect when cleaning dirty data!

Another part of working with data collected from the launches and the ship involves cleaning “dirty” data.  Even through the best efforts to collect data, pings are sometimes lost or interference occurs. Perhaps the speed of the vessel exceeded 6 knots or maybe there was a section of the water with an unusual density. So, a software program called Caris is used to work with the data on a dual screen computer. The ocean floor that is color coded by depth can be viewed on one screen. Then, the person working with the data selects small segments of the ocean floor to view on the other screen.  The plane of the ocean floor and all of the pings are shown in a variety of color scales. Data that is very accurate at a high confidence level can be shown in violet, but the lower the confidence level gets, the further up the spectrum the colors are shown.  Many people choose to show different lines of pings in different colors to make it easier to see how many times the same section of the ocean floor was swept.

The person working on the computer can choose to delete certain pings, especially if they were located at the far end of the multibeam.  These pings are more likely to be lost or misrepresent the depth. Additionally, a measurement can be taken on the screen with a ruler tool to determine if a group of pings are within specification limits.  If they are not, a segment of data can be designated for further investigation.  The person working on this must make many decisions, so it is important to be able to infer information from data as you work.

Personal Log 

Paddling my kayak in the ocean through Northwest Harbor in the Shumagin Islands

I went sea kayaking a few years ago in Mexico, but sea kayaking in Alaska is by far more dangerous. Even though the kayaks are paddled the same way and I could keep the boat balanced relatively easily, the danger of flipping over and freezing to death in the sea water is a constant thought. The beauty of the islands as I paddled near them was mesmerizing.  The Shumagin Islands look like something out of a prehistoric world.  I keep expecting to see a dinosaur walking up one of the rocky hillsides. I didn’t see any prehistoric creatures on the kayak, but I did see some puffins, a seal, and a wide variety of other seabirds too far away for identification.  Kelp was also floating around in abundance. I should mention that I was sea kayaking from about 8:30 to 11:00pm, but it was still daylight the whole time.  It is near the summer solstice, so daylight lasts for about 18 hours or so each day. Right now, the sun is rising at about 6:00am each morning and setting at about 11:30 each night. It is really unusual to be out on a sea kayak in bright daylight in the middle of the night!

Create Your Own NOAA Experiment at Home 
You can use simple items from your kitchen to see how cold the water in Alaska feels. You will need some ice water, a thermometer, and a bowl. First, put the ice in the bowl and pour the water over it. Next, place the thermometer in the bowl with the ice water.  Wait until the temperature goes down to about 45 degrees Fahrenheit.  Now, place your bare hand in the ice water. How does it feel? Try it with a glove on.  Do you feel a difference?  Remember, your body temperature is about 98 degrees Fahrenheit, so you are putting your hand into water that is about half your body temperature. Can you imagine how it would feel to fall into this water?

Jill Stephens, June 18, 2009

NOAA Teacher at Sea
Jill Stephens
Onboard NOAA Vessel Rainier 
June 15 – July 2, 2009 

Mission: Hydrographic Survey
Geographical area of cruise: Pavlov Islands, AK
Date: June 18, 2009

Weather Data from the Bridge 
Position 55° 10.089’N 161° 52.801’W
Broken cloud cover
Wind variable and light
Pressure 995.9
Temperature: Sea; 6.1°C;  Dry Bulb; 8.3°C; Wet Bulb; 7.8°C

The Reson monitor displays the sonar return captured by the receiver on the bottom of the boat.

Science and Technology Log 

The launch leaves the ship every day to go to spots within the survey area to collect data regarding the bottom for depth, possible anchorage sites and potential navigational hazards.  Our boat was responsible for covering the long area referred to as the fairway, which is necessary in this uncharted area so that the launches can transit to and from the working areas safely, and move on to another area upon completion.

The chart of the area is “painted” with color depicting the depth of the area based upon the return form the sonar.  The goal is to “paint” your assigned area.  The numbers in the lower right of the screen indicate the depth in meters.
The chart of the area is “painted” with color depicting the depth of the area based upon the return form the sonar. The goal is to “paint” your assigned area. The numbers in the lower right of the screen indicate the depth in meters.

The inside of the cabin of the launch reminds me of Star Wars. There are pieces of electronic equipment everywhere!  One of the survey team members sits in the command center to monitor and control the Reson collection and additional software that displays a 3-D image of the sea floor surface. As the coxswain pilots the boat over the surface of the water, low frequency sonar is emitted from the transducers.  The sonar hits the sea floor and is then bounced back to a receiver on the underside of the boat.  The pings are recorded by the equipment and stored in the computer. 

The CTD is attached to a cable operated by a winch.  The CTD acclimates to the water surface temperature before being lowered steadily to the bottom.  The equipment is raised to the surface using the winch and then brought aboard.  The CTD is connected to the computer for data retrieval.
The CTD is attached to a cable operated by a winch. The CTD acclimates to the water surface temperature before being lowered steadily to the bottom. The equipment is raised to the surface using the winch and then brought aboard. The CTD is connected to the computer for data retrieval.

There are factors that affect the accuracy and quality of the information.  Boat speed, conductivity of the water, pitch and roll, yaw, and tides must be accounted for in order obtain usable data. There is equipment on board that collects the pitch, roll, yaw, and geographic position information to correct merge with the data to make corrections.  The CTD apparatus is placed into the water while the boat is stopped. The cast of the CTD will collect salinity, temperature, and pressure information at depths from the surface to the bottom. This information is also sent to the computer to provide a more accurate reading of the sonar data received by the Reson system.  Casts of the CTD must be made a minimum of every four hours to account for any changes between points in the survey area.

Personal Log 

Here I am manning the computers onboard the launch used to collect sonar depth and bottom information in the Pavlof Islands, Alaska.

Shawn, Todd, and Dennis were on my launch today. Once the equipment was powered up and the software programs selected, I was able to sit at command center and control collection and storage of data. The raw data is merged with the corrective information and submitted to Caris, another software program that also creates models of the findings. We were using a laptop to merge the data and begin field processing of the data. I was able to assist with this process too.

Two whales surfaced near the survey launch early in the morning near Bluff Point in the Pavlof Islands.

Animal Sightings 

This morning was a great day to see whales!! We spotted 5 blows!  We were then able to see the whales breach the surface at a distance.  Three of the whales moved closer to us. There were two adults and a juvenile. The juvenile was very playful and kept poking his head above the surface.  The two adults came closer to the launch and we were able to get some great shots of their bodies!! On the way back to the ship, we saw four more blows. Total sightings of whales: 9 Puffins as always are out there. They are very strange, somewhat silly birds…. 

New Vocabulary Gain: how hard an object is listening to the sound emitted by the sonar Sound Speed: speed at which sound is able to travel (This will vary in water depending upon the factors like salinity and temperature.)

Absorption: refers to how much of the sound is absorbed by the medium and varies with the medium’s composition and other factors including temperature. 

Jill Stephens, June 17, 2009

NOAA Teacher at Sea
Jill Stephens
Onboard NOAA Vessel Rainier 
June 15 – July 2, 2009 

Mission: Hydrographic Survey
Geographical area of cruise: Pavlov Islands, AK
Date: June 17, 2009

Weather Data from the Bridge 
Position: Anchored, Bluff Point, AK; 53° 10.087’ N, 161° 52.801’ W
Visibility 10 nautical miles
Wind 060 at 6 knots
Temperature 8.3° C dry bulb, 7.8° C wet bulb
Barometric pressure 995.7
Sea Temperature 5.6° C

Science and Technology Log 

This morning everyone was abuzz with excitement because today we were to send out the launches and begin to survey the area in the Pavlof Islands that has not yet been charted! The data that we will be collecting during this survey, such as depths and hazards to navigation, will eventually end up on nautical charts.

Here I am driving the launch.  It is essential to hold a steady course while collecting data for the surveys and tests.
Here I am driving the launch. It is essential to hold a steady course while collecting data for the surveys and tests.

Deploying the launches is a fascinating thing to watch. The davits on our ship rely upon gravity, (Newton’s Laws in action…).  The boats are attached with cables and the weight of the launch is used to lower it to the water. As the cable is slowly released, deckhands man lines to assist in guiding the launches slowly toward the water. The crew and their gear are loaded from one of the lower decks and then the launch is lowered the rest of the way to the cold Alaskan water.  Once the launch is in the water, the cables are released from the launch.

The launch that I went out on was running patch tests and collecting Reson data.  The patch tests are necessary to calibrate the multibeam sonar and measure any physical offsets that may induce errors into the acquired data. In order to accomplish this test, we collected data with the sonar by running lines over an area that was surveyed last year.  The sonar that is used to collect information about the depth and underwater objects can be either high or low frequency.  It was important for our boat to test both frequencies.  The frequency used depends upon factors such as the depth of the water.

Personal Log 

Having been on board ship for two days already, I am getting the feel for where everything is located and how meals work.  Now, I have also been introduced to the routine of launching and conducting surveys. Our coxswain allowed me to pilot the boat for one of the runs during our testing. My time on boats at home and on sailing excursions is paying off.

When I visited the bridge to write down the weather information, the officer on bridge watch, Ensign Andvick, was preparing to collect the hourly weather information.  I assisted in the collection of the required data and was excited to be able to learn where the weather instruments are located on the bridge.  I enjoy data collection, so I will time my visits to coincide with the hourly check of the weather, which becomes a part of the ship’s log.  While on the bridge, I also learned that there is some difficulty communicating by radio from the ship to launches in this area. The islands in this area are very high and mountainous, but in similar areas this difficulty has not been noticed. One possibility for the communications issue is that the mountains here have a higher concentration of iron that interferes with the signal.  (Sounds like an idea for a science fair project….). The launches have other methods to communicate with the ship and other launches such as satellite phones.

I had the opportunity to spend time in the plot room with fellow teacher at sea, Mary Patterson while the night processors were working on the data collected during the day.  We continue to meet and work with interesting and fabulous people.

New Vocabulary 

Coxswain: boat driver/operator — The coxswain is responsible for the operation of the boat and the safety of all occupants and equipment.

Patricia Donahue, August 22, 2008

NOAA Teacher at Sea
Patricia Donahue
Onboard NOAA Ship Rainier 
August 19-23, 2008

Mission: Hydrographic Survey of Bear Cove, AK
Geographical Area: Kachemak Bay, Alaska, 59.43.7 N, 151.02.9 W
Date
: August 22, 2008

One of the Rainier’s small boats, also called a launch

Science and Technology Log 

Much of today had to do with technology. The small boat I went out on, pictured to the right, was filled with computer equipment. Each day at the survey technology department meetings, I’ve listened but not entirely understood the reports of computer issues on the small boats.  This morning I witnessed one such incident. Something didn’t work. Fortunately, there was a work-around and the data collection proceeded smoothly.

I was reminded of the early 18th century efforts to determine longitude. The problem was so pressing that kings of various countries offered rewards for the development of a clock that could keep time at sea. In 1772, James Cook, for whom Cook Inlet in Alaska is named, sailed with the first marine chronometer. The chronometer was a clock that kept accurate time for the home port. On board Cook’s ship, Resolution, there was another clock that kept local time.

Sonar equipment is lowered into the water.

Since the Earth turns 15 degrees of longitude each hour, by using the difference between the two clocks, seamen would know how far east or west they had traveled. They already knew how to determine latitude with an instrument called a sextant so by using the marine chronometer they could actually plot their coordinates. Now, of course, we take GPS for granted. Many people even have GPS in their cars. These devices and the hand held ones I use with my students at school are accurate to within 4 to 10 meters. Well, the boat I was on today has DGPS, which is even better. It is accurate to within 5 centimeters! With this high-tech equipment, NOAA is able to take very accurate measurements and make very accurate maps.

This graph depicts the velocity of sound through water.

The boat I was on today used multi-beam sonar to determine the depth of the ocean floor. This is similar in concept to the single beam in that ping return-times are used. The multi-beam uses a lot more pings, sometimes as many as 200 per second. In the picture above, the sonar equipment is being lowered into the ocean. I learned that salinity, temperature and depth (which is another way of saying pressure) determine the electrical conductivity and density of the water. These two factors then determine the sound velocity.  In the graph, depth is on the Y axis and velocity is on the X axis. Notice the bulge in the plotted line. This represents an area nearer the surface where glacial melt water and ocean water are mixing. The velocity of sound through this water is slower than deeper down where it’s mostly salt water.

This graph displays the pitch, roll, and heave of the boat.

Measurements of salinity, temperature, electrical conductivity, depth and density were taken 27 times today. This data will be used to adjust the sound velocity to get the most accurate picture of the ocean bottom. The movement of the boat also has an effect on the sonar equipment. NOAA is using the moving vessel profiler or MVP to eliminate the interference caused by the boat’s movement. A boat has a pitch, roll and heave. The computer screen to the left shows graphs of these three types of movement. What do you think was happening on the boat at about halfway across the graph? Remember, the boat is “mowing the lawn” as it collects data. Lastly, the tides also affect the data. Upon return to Rainier, the data is processed and also corrected for the effect of the tides.

TAS Donahue gets a chance to drive the launch.

Personal Log 

Several crewmembers have tried fishing from the boat and we’ve seen many small boats with fishermen aboard but no one has caught anything. Using the binoculars aboard the small boat today I watched someone land a fish. I think it was a halibut, which makes sense since we’re in Halibut Cove. The most exciting part of the day was driving the small boat. Data was not collected from a small piece of sea bottom so the boat had to make one last pass over it with the sonar equipment. I’ve driven many different vehicles, even a motorcycle, but a boat is different. I couldn’t make it stay straight!

The scariest thing that happened today didn’t happen to us at all. The United States Coast Guard broadcast a message all afternoon over the marine radio. The message would also start with “pan, pan, pan,” which is the appropriate way to begin a distress call. Most of us have heard of “may day” calls. Those are used when there is immediate danger. A “pan” call is more similar to a warning. A boat carrying two adults and one child had not returned as expected and was missing. The Coast Guard was asking all other boaters to keep an eye out for them. I hope they’ve been found and that everyone is okay.

Animals Seen Today 

A raft of otters, Common Murres, Marbled Murrelets, and Barrow’s Goldeneye

Vocabulary of the Day 

The coxswain is the person who drives the boat.

Challenge Yourself What is 5 cm in inches? What types of movements are pitch, roll and heave?


Terry Welch, July 1, 2008

NOAA Teacher at Sea
Terry Welch
Onboard NOAA Ship Rainier
June 23-July 3, 2008

Mission: Hydrographic Survey
Geographical Area: Pavlov Islands, Gulf of Alaska
Date: July 1, 2008

Weather Data from the Bridge 
Wind: S/SE 15-20
Precipitation: clearing
Temperature:  High 47 Seas 1-3’

NOAA Teacher at Sea, Terry Welch, at the helm of the RAINIER

Science and Technology Log 

Today, we are in transit to Seward after surveying the Pavlof Island area for the past week.  We cut our surveying down a day due to incoming weather.  The RAINIER made good headway and we stayed ahead of the storm.  The seas never seemed all that bad in the last 12 hours and today we have sun! I spent some time observing what the ensigns (ENS) and crew do on the bridge while underway. There are always 2-4 people on a “watch” and they continually monitor navigation instruments, weather, and look for any possible obstructions like boats out there. A “watch” lasts four hours.

The RAINIER uses two different kinds of radar to track vessels or land around us. The ensigns also observe through binoculars a lot.  When I was at the bridge, there were two larger fishing vessels ahead of us. The radar tracks how far a boat is in nautical miles from us, their speed and direction headed.  Many larger boats and ships carry an AIS (Automatic Identification System), which allows the exchange of ship data such as identification, position, course and speed, with nearby ships. GPS (Global Positioning System) plays an important role in their navigation also and is tied into theequipment.

RADAR on the bridge of the RAINIER

The ensigns and captain also plan out our routes using maps, compasses, and straight edges.  Plotting our course is done the old fashioned way – paper and pencil. Below is ENS Schultz plotting our course. I spent a little time in the plotting room, where the hydrographic crew cleans up the data that has been collected during the day. I mentioned in an earlier log that the Multibeam SONAR system collects sounds waves, casually called “pings” that are bounced off the ocean floor and are sent back to the system.  How well these transmissions are sent and received depends on several physical factors of the water including water depth, temperature, salinity and conductivity.  I was a little stumped on how all of these factors play a roll in understanding the data and Ian, the Hydrographer Tech, reminded me about Snell’s Law, which describes how waves refract differently through different mediums.  There are a couple of short QuickTime movies on the NOAA education website that show Multibeam sonar at work.  Click here.

ENS Christie Schultz plots the RAINIER’s course with old fashioned pencil and paper.

The “casts” we took every few hours with the CTD (Conductivity-Temperature-Depth) instrument help the software determine the speed of sound by applying Snell’s Law, more or less, and make corrections for the differences in the water layers. It’s interesting to note that the first layer of water may have much less salinity than deeper water due to stream flow into the ocean.  In a column of water:  as the temperature increases, sound speed increases; as the pressure increases, sound speed increases; and as salinity increases, sound speed increases.  For more info on Snell’s Law and sound waves, go here.

Personal Log 

The CTD instrument
The CTD instrument

The sun came out for most of the day today, which enabled me to see the wonderful mountains around here.  We are transiting through the Shelikof Straight just north of Kodiak and south of the Alaska Peninsula.  We should be in Seward in the morning.

Questions of the Day: 

  1.  How do sounds waves travel through water differ from light waves?
  2. What is the speed of light and speed of sound?
  3. Is the speed of sound different in salt water rather than fresh water?

Animals Seen Today: Porpoises along the bow

The magnificent mountains surrounding Shelikof Straight