Scott Donnelly, April 24, 2008

NOAA Teacher at Sea
Scott Donnelly
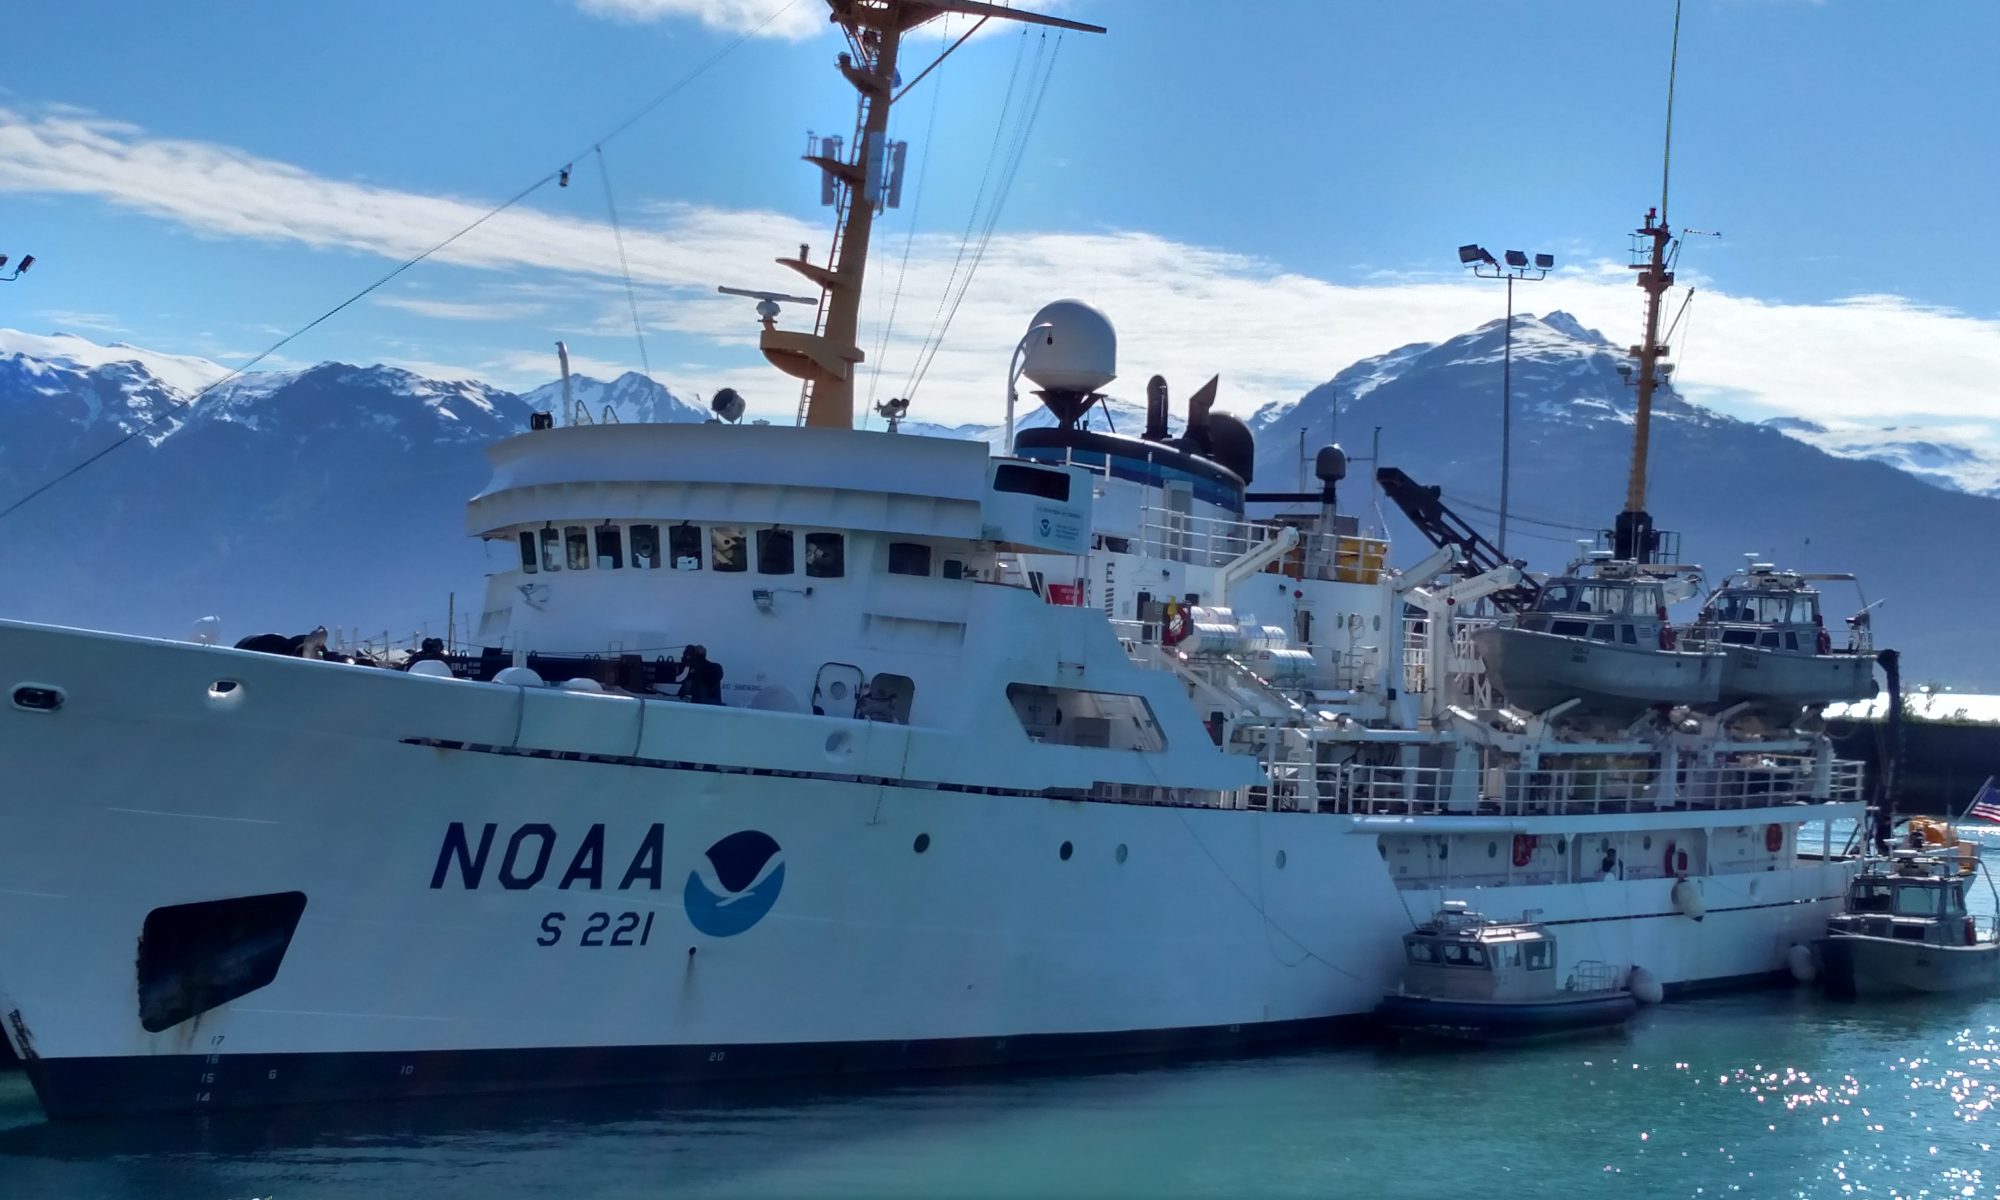
Onboard NOAA Ship McArthur II
April 20-27, 2008

Mission: Assembly of Science Team and Movement of Science Gear/Equipment
Geographical Area: Coos Bay to Astoria, Oregon
Date: April 24, 2008

Water collection from Niskin bottles

Weather Data from the Bridge 
Sunrise: 0620 Sunset: 2010
Wind: 10 kts
Seas: 2 ft
Light rain showers possible

Science and Technology Log 

As forecasted for Wednesday night the turbulent seas have calmed and the howling winds coming from all directions have subsided. On occasion a large wave smashes into the ship broadside. But, for the most part, it seems like the storm has moved onto land. Sampling operations restarted around 2000 (8pm) last night. This morning from 0100 to 0500 is my sixth 4-hour shift. Today nearshore and offshore CTD and biological sampling continues at different longitudes 124O29’W to 125O15’W but constant latitude 43O07’N. This is called a longitudinal sampling survey. The latitude and longitude coordinates align with the westward flow of water from Coos Bay estuary in Coos Bay, OR. Along these coordinates CTD deployment will reach depths as shallow as 50m (164ft) to as deep as ~2,800m (~9,200ft)! Round-trip CTD measurements will take more time due to progressively greater depths with increasing distance from the OR coast. On my morning shift we collected samples at two stations. At the second station 30 miles from the coast the CTD was deployed to a depth of 600m (1,970 feet).

Monitoring CTD data
Monitoring CTD data

During Thursday’s afternoon shift (my seventh 4-hour shift) the CTD was lowered to a  depth of ~2,700m (~8,860 feet) located 50 miles from the coast. At this distance out at  sea, the coastal landmass drops below the horizon due to the curvature of the earth and the up and down wave action. The round-trip CTD deployment and retrieval to such great depths take about two hours to complete. The dissolved oxygen (DO) probe measurements indicate a secondary DO layer in deep water.  So how are the continuous data measured by the CTD organized? What are the trends in data? In science graphs are used to organize numerical data into a visual representation that’s easier to analyze and to see trends. Below is a representative drawing of how CTD and wet lab data are organized and presented in the same visual space. Note the generous use of colors to focus the eyes and show the differences in data trends.

Screen shot 2013-04-20 at 4.55.48 AMWhat are some trends that can be inferred from the graph above? First, with increasing depth, seawater becomes colder (maroon line) until below a certain depth the water temperature is more or less at a constant or uniformly cold temperature (compared to the surface). Second, the amount of dissolved oxygen (DO) in seawater (green line) is greatest near the surface and decreases, at first slightly then abruptly, with increasing depth below the surface. Third, salinity (red line), which is directly related to conductivity, increases with increasing depth. Furthermore, in general seawater pH (blue line) becomes more acidic (and conversely, less basic) with increasing depth. Last, marine photosynthetic activity as measured by chlorophyll a in phytoplankton (purple line) is limited to the ocean’s upper water column called the photic zone. Below this depth, sunlight’s penetrating ability in seawater is significantly reduced below levels for photosynthesis to be carried out efficiently and without a great expense of energy.

The consistently low (acidic) pH measurements of deep water collected by the Niskin bottles and analyzed on deck in the wet lab are a concern since calcium carbonate (CaCO3) solubility is pH dependent. On this cruise the pH measurements between surface and deep waters show a difference of two orders of magnitude or a 100 fold difference. Roughly, pH = 8 for surface water versus pH = 6 for deep water offshore. This difference in two pH units (ΔpH = 2) is considerable as it indicates that the deep water samples are 100 times more acidic than the surface water. pH is a logarithmic base ten relationship, i.e. pH  = -log [acid] where the brackets indicate the concentration of acid present in a seawater sample. A mathematical difference in two pH units (ΔpH = 2) translates into a 100 fold (10ΔpH = 102) difference in acid concentration. Refer to the Saturday, April 19 log for a discussion concerning the importance of CaCO3 in the marine environment and the net acidification of seawater.

Personal Log 

Screen shot 2013-04-20 at 4.56.10 AMAfter the morning shift but before a hearty breakfast of eggs, hashed browns, sausage, bacon, and juice, I hung out on the ship’s port side to watch the sunrise, a memorable mix of red, yellow, and orange painting the sky. It was one of the best sunrises I remember and that’s saying a lot since I live in southern Arizona, where the sunrises and sunsets are the stuff of legends. With the low pressure system having moved over land, the sea was calm and the temperature considerably warmer with no clouds positioned between it and the ocean.  Perhaps surprisingly, I haven’t sighted a whale or a whale spout, even in shallower, more nutrient-rich coastal waters. It’s not that I haven’t looked as each day I’ve visited the flying bridge (observation deck) above the operations bridge enjoying the immensity of the vast Pacific.

A flock of albatross have begun following the ship I suspect in hopes of getting a fish meal, mistakenly thinking that the McARTHUR II is a trawler.  I saw trash, which I couldn’t identify without binoculars, floating on the surface. Sadly, even the vast, deep oceans and its inhabitants are not immune from humanity’s detritus. The history of humanity and its civilizations are intimately linked to the world’s oceans. This will not change. Humanity’s future as well is linked to its maritime heritage. The oceans have fed us well and have unselfishly given its resources without complaint.  Perhaps it’s time we return the compliment and lessen our impact.


Scott Donnelly, April 23, 2008

NOAA Teacher at Sea
Scott Donnelly
Onboard NOAA Ship McArthur II
April 20-27, 2008

Mission: Assembly of Science Team and Movement of Science Gear/Equipment
Geographical Area: Coos Bay to Astoria, Oregon
Date: April 23, 2008

Weather Data from the Bridge 
Sunrise: 0620 Sunset: 2010
Wind: 10 kts, 30 kt gusts
Seas: 4-7 ft
Light rain showers

Low resolution radar image of the storm system that postponed cruise operations

Science and Technology Log 

My fourth (0100 to 0500, 1am to 5am) and fifth (1300 to 1700, 1pm to 5pm) 4-hour shifts are postponed due to the continued inclement weather. Seas are turbulent (combined seas 16 feet) and the winds blow non-stop (30 knots with gusts near 40 knots) from all directions it seems. Standing on deck both port and starboard, the howling wind throws sharp sea spray darts at my unprotected face. For a seasoned mariner these conditions are probably routine, if not prosaic. But for a newbie like me, with a little more than 48 hours of sea time experience, they are impressive and awe-inspiring, especially so given that I’m watching

it all from in the midst of the storm and not from the relative safety of the shore as I’ve done at times in San Diego. I climb the stairs to the ship’s bridge to watch and videotape this grand spectacle. The captain is calm and seems unimpressed with the temperamental, chaotic happenings outside. As I make my way to the bridge’s front viewing window he says to me, “Crummy weather isn’t it.” Without thinking, I nod my head in agreement. Also, a gale warning remains in effect until 1400 (2pm) this afternoon. A gale force wind  has sustained surface speeds greater than 34 knots (39mph).

CTD deployment and biological sampling with the nets are postponed until the weather subsides and is more conducive to on deck activity. If the weather cooperates and the night forecast is accurate, the plan is to resume water sampling with the CTD and collection of marine organisms around 2000 (8pm) tonight. In the meantime the CTD has been securely fastened to the fantail deck. The coordinates for today’s postponed longitudinal sampling (constant latitude, changes in longitude) are 43O07’N, 124O29’W to 125O15’W.

With the postponement in work activity in today’s log I’ll discuss a number of topics. In the following paragraphs I’ll discuss some of the nautical terms used in marine weather conditions as found in today’s forecast (see beginning of log, top) and what a low pressure system is. In yesterday’s log I described what a bongo net is and how it works. Today I’ll talk about the marine organisms that a bongo net collects and also describe the other three zooplankton nets used on this cruise- the Manta, ring, and HAB nets. Let’s begin with nautical terms used in marine weather forecasts.

Winds are identified with respect to the direction from which the wind originates. Surface water currents on the other hand are identified with respect to the direction they are flowing. So for example, today’s morning forecasted southeast (SE) winds originate from the southeast and blow toward the northwest (NW) since in general winds travel in a straight line path when not disrupted. Conversely, today’s forecasted morning southwest (SW) swells are traveling in the southwest direction. Marine wind and ship speeds are measured in terms of knots (kts). One knot (one nautical mile per hour, nm/hr) equals 1.15 statuary (or land) miles per hour, mph. Today’s forecasted morning wind speed of 25kts then equals 29mph, with morning gusts (G) forecasted at 30kts or 35mph and subsiding by mid-afternoon.

A change in winds from the SE to the E and then NW as forecasted from AM to PM indicates that the storm system is moving in a northeast direction onto land.

What is a swell? A swell is a mature wind wave of a given wavelength (distance between successive wave crests, i.e. the highest point of a wave) that forms orderly undulations seen on the ocean surface. Swells are described with respect to their height and period. Wave height is self-explanatory. What about wave period? Notice in the weather forecast that a wave period is defined in terms of time (typically seconds). Let’s use a hypothetical situation to explain a wave period. Suppose you are standing on deck, looking out across the vast sea, and a wave passes across your line of sight. Seven seconds later another wave crosses your line of sight, which remains unchanged. Seven seconds later another wave passes; your line of sight is still unchanged. The wave period then is the time elapsed for successive waves to pass a fixed point. In general, the longer the period, the calmer the sea.

Dense krill “soup”
Dense krill “soup”

Since my arrival in Oregon on Friday, April 18 a low pressure system has been positioned off the Oregon coast bringing clouds and precipitation. Today’s stormy seas are a result of a low pressure system. The winds and clouds in a low pressure system rotate in a counter-clockwise direction when viewed from satellites above. So if the winds blow from the southeast (SE) and are sustained, this indicates that the northern region of the low pressure system is south of the observer. In yesterday’s log I wrote briefly about how a bongo net is deployed and its function. So what marine organisms are collected in a bongo net? On this cruise at the depths the bongo net is deployed, it’s mostly a thumb-sized, shrimplike crustacean called krill. Krill are an important and central component of the oceans’ food chains and webs. In the northeastern Pacific the predominant species of krill is Euphausia pacifica. They are prolific consumers of microscopic marine organisms too small to see with the naked eye. But they too are consumed in enormous quantities by seabirds, squid, fishes, whales, and more recently, humans.    

As seen in the upper right photo Euphausia pacifica krill have red “spots” along the entire length of their transparent, tubular bodies. These “spots” are photophores (light emitting organs) that emit blue light when a krill is agitated. During the 0100 to 0500 shift when it’s relatively dark on deck, one can see the blue emitted light from individual krill (but not all simultaneously) when the detached cod end of the bongo net is shaken. The emission of light from living organisms is called bioluminescence.  Remember the scene in the 2003 Academy Award winning, computer-animated family film Finding Nemo when Nemo’s iconic clownfish father, Marlin, and his absent-minded blue tang friend Dory descend into the pitch-black deep water to find the scuba mask dropped when Marlin’s colorful, curious son Nemo was captured by the scuba diver. Dory is mesmerized by a glowing light that suddenly appears. Both eventually escape becoming a meal for a deep water fish that uses bioluminescence to attract and then eat unsuspecting prey.

Euphausia pacifica
Euphausia pacifica

A sub-category of bioluminescence is chemiluminescence, which refers to the emission of visible light on account of a chemical reaction. In the krill’s photophores is a creatively named molecule called luciferin, which combines with its complementary enzyme called luciferase, to emit blue light. Of all the known bioluminescence in the natural, biological world, an overwhelming majority is found in marine organisms, especially those found in deep water where light from the sun does not penetrate.

In yesterday’s log I wrote briefly about the function of a bongo net in collecting marine organisms (zooplankton) in a horizontal water column below the ocean’s surface. How are the nearly weightless, free-floating zooplankton found at the ocean’s surface and a few inches below collected? In the following paragraphs I’ll answer this question and also describe the nets used to collect marine organisms in a water column vertical (or perpendicular) to the surface.

Manta net in action
Manta net in action

A Manta net (also called a Neuston net) collects zooplankton at and a few inches below the ocean’s surface. Like a bongo net it too collects marine organisms found in a horizontal column of seawater. This requires the ship to be moving forward. Since a Manta net collects marine organisms at the surface and a few inches below, weights are not attached to the Manta net’s metal rectangular frame which also serves as its mouth. Floats are permanently attached to the right and left of the net’s mouth. A rotary flowmeter is suspended in the net’s mouth so the water volume can be determined. Like a bongo net the biomass density (number of organisms per volume water) then can be estimated. For our cruise the Manta net was deployed starboard once every shift for a total of ten minutes for each cast.

NOAA TAS Scott Donnelly (green helmet)  retrieving a Manta net
Scott Donnelly (green helmet) retrieving a Manta net

Two other nets used on this cruise are a ring net and a HAB (Harmful Algal Bloom) net, both of which are used to collect samples in a column of water vertical or perpendicular to the ocean surface. Consequently, the ship must not be moving and the net weighted for vertical sampling of a water column to occur since the nets themselves are not dense enough to sink. Deployment and retrieval of both nets are simple enough. Basically, the net is attached to a winch cable and a weight, is slowly lowered into the water to the desired depth and kept there for the desired time before it’s slowly lifted upward through the water, brought alongside the ship and suspended, washed with seawater, lifted onto the ship’s deck, and the collected sample removed from the cod end. The organisms collected represent those found in the vertical column of water through which the net ascended. On account of their small, compact size and weight, both the ring and HAB nets can be managed with one person, thereby freeing the other to take care of other sampling tasks.

Manta net skimming the surface for zooplankton

What is Harmful Algal Bloom (HAB)? HAB is caused by the elevated levels of toxins produced by certain marine algae that proliferate when seawater conditions are favorable for increased rates of reproduction. The microscopic algae are consumed by the ocean’s voracious eaters called phytoplankton. One of the toxins released by these certain marine algae is domoic acid, which accumulates in the phytoplankton that consume the algae. The phytoplankton are eaten by shellfish and fish such as anchovies and sardines. Domoic acid is poisonous to the shellfish and other fish thereby increasing mortality rates. If the toxin levels are elevated, massive die-offs occur, beaches are closed, and the sale and human consumption of shellfish, etc. are prohibited. The biological, social, and economic impacts are painful.

Personal Log 

In spite of the ship’s constant pitching and rolling in these unsettled, stormy seas, I slept well Tuesday night, taking two hour catnaps, waking for ten minutes or so, and then falling back to sleep for another two hours or so before waking after midnight to get ready for the 1am shift. About mid-morning I made a visit to the bridge where ship operations are carried out. According to ship’s radar the low pressure system and local squalls causing the inclement weather shows signs of letting up.

HAB net deployment as seen from above Ring net deployment
HAB net deployment as seen from above

Almost three full days on the ship and I have shown no indications or symptoms of sea sickness in spite of the constantly changing seas. According to the NOAA crew I’ve earned my sea legs and it’s not likely that I’ll get sea sick. So much for all the tablets of Dramamine I brought.  I took some memorable video from the bridge (both inside and outside) of the ship’s bow rising and falling between waves, some of them smashing violently into the McARTHUR’s bow on both the port (left) and starboard (right) sides, sending seawater spray up to the bridge window and all about the bow’s deck. I felt like a true mariner. Still no sightings of whales, orca, or the Black Pearl of Pirates of the Caribbean film fame.


Scott Donnelly, April 22, 2008

NOAA Teacher at Sea
Scott Donnelly
Onboard NOAA Ship McArthur II
April 20-27, 2008

Mission: Assembly of Science Team and Movement of Science Gear/Equipment
Geographical Area: Coos Bay to Astoria, Oregon
Date: April 22, 2008

Weather Data from the Bridge 
Sunrise: 0620 Sunset: 2010
Wind: 10 kts, 25 kts gusts
Seas: 4-7 ft
Rain showers possible

Open Niskin bottles on CTD platform

Science and Technology Log 

What’s the significance of the NH Line (Newport Hydrographic, 44O39’N)? Water and biotic data acquisition at the NH Line began over 40 years ago. The NH Line then is significant on account of the long-term historical sample collection and data sets that it provides. Consequently, temporal (time) comparisons involving water and biotic data can be made over decades as opposed to shorter lengths of time such as years or months. It’s my understanding that nearshore and offshore sampling along the Oregon Continental Shelf (OCS) always includes the NH Line. My second 4-hour shift began at 0100 and ended shortly after 0500. Regardless of time of day each shift sets up and collects water samples from each of the twelve Niskin bottles on the CTD rosette. Typically, three water samples are collected at a particular depth. How does remote sub-surface water sampling work? When the CTD is deployed from the ship’s fantail, initially the top and bottom lids on all twelve Niskin bottles are open as shown in the photo below.

The CTD is lowered into the water and once the desired depth is reached the requisite number of Niskin bottles are closed electronically from the ship by whoever is in the control room. For my shift it’s team leader Ali Helms. After that is done, the CTD then is lowered or raised to another depth where another “firing” takes place and more water samples at a different depth are collected. When sampling is complete, the CTD is raised to the surface and onto the ship where it is secured to the fantail deck. The water in each Niskin bottle is collected and taken to the ship’s wet lab where each water sample collected at a particular depth is analyzed for other water quality parameters not measured by the CTD.

YSI datalogger
YSI datalogger

Other water parameters measured on this cruise in the wet lab include: total dissolved solids (TDS), pH, and turbidity (how transparent, or conversely cloudy, is the water). A YSI 6600 datalogger interfaced with a multi-sensor water quality probe (sonde) is used to measure the aforementioned water parameters. See photos below. The CTD and Niskin bottles then are hosed down with freshwater and reset for the next sampling site.  After the CTD is reset for the next sampling site, then it’s time to collect biotic samples from the surface and at different depths. Biological sampling always follows a CTD cast. On this cruise biological sampling is carried out on the ship’s starboard side just fore of the fantail. Collection of marine invertebrate (boneless) organisms uses nets that vary in size, shape, density of net mesh (number of threads per inch), and volume of detachable sample collection container (called a cod end). Sampling nets are conical in shape and typically are made from Dacron or nylon threads that are woven in a consistent, interlocking pattern. Each specifically designed net is attached to a wire cable and deployed from the starboard side. If collection/sampling is done below the water’s surface (also called sub-surface), a weight is attached to the net’s metal frame.  A bongo net is an example of a net used for the collection of invertebrate marine organisms at some defined depth below the surface (see photos below).

Multi-sensor water sonde

A bongo net collects organisms by water flowing into the net, which is parallel or horizontal to the water surface at some depth below the surface. Consequently, use of a bongo net requires that the ship moves forward. Deployment of a bongo net requires the use of trigonometry, a favorite math course of mine in high school a long time ago. The length of cable let out by the NOAA deckhand operating the winch with cable does not equal the depth that the bongo net is lowered below the surface. (This would be true if the net was simply dropped straight down over the side of the ship.) Let’s use the drawing below to illustrate this.

Suppose sample collection is to be done at 100m (328 feet) below the water’s surface. More than 100m of cable needs to be let out in order to lower the bongo net to 100m below the water’s surface. How much cable beyond 100m is let out (x) depends on the angle (θ) of the net (and hence cable) to the water’s surface. The angle θ is measured by a protractor attached to the cable and pulley at the position identified with the blue star in the drawing. The angle θ in turn depends on the ship’s forward speed. To calculate the length of cable that needs to be let out, the following trigonometric formula involving right triangles is used: sin θ = cos-1θ = 100mx. The calculated value x is communicated to the NOAA deckhand, who controls the winch that lets out the desired length of cable. When this cable length is reached, retrieval of the bongo net begins.

Duel sampling bongo nets ready for retrieval

The volume of water that contains the marine organisms and that flows through the bongo net is recorded by a torpedo-shaped rotary flowmeter (left photo below), which is suspended by wires or thick fishing line in the middle of the net’s mouth. As water moves past the meter’s end, it smacks into and transfers its momentum to the flowmeter’s propeller, which rotates or spins. The propeller’s shaft in turn is linked to a mechanical counter inside the meter’s body (right photo below). A complete revolution of the propeller equates to a certain number of counts and that is related to a certain volume of water that has flowed past the meter.  The mathematical difference between the two numbers recorded before the net’s deployment and after the net’s retrieval is plugged into a mathematical formula to obtain the estimated total volume of water that flowed through the net’s mouth during the time of collection. Consequently, the weight or number of biomass collected by the net can be related to the volume of water in which the biomass was found. This gives an idea about the density of biomass (weight or number of biomass units per volume seawater, g/m3) in a horizontal column of seawater at a given depth and site. In tomorrow’s log I’ll talk about what marine organisms a bongo net collects (including photos) and also discuss and describe the three other nets used on this cruise to collect marine invertebrates.

Mechanical counter in flowmeter

Personal Log 

So far after one full day at sea, I haven’t experienced any indications of sea sickness in spite of rough seas (see weather forecast at beginning of log). Four other science team members haven’t been as fortunate. I didn’t witness any visible bioluminescent surface events on the early morning shift (0100 to 0500). I walked to the ship’s bow since this would likely be the best place to witness bioluminescence given all the agitation of seawater there. I left a bit disappointed but there are still five days remaining. The CTD and both the DO and chlorophyll probes (sensors) operated without any problems.

Bob and I communicate well and have similar personalities and intellectual interests. Before carrying out a task we discuss how it’s to be done and then agree to do it as discussed and in the order discussed. Communication is critical because when sampling for biological organisms for example, the nets have large, heavy weights attached so once the net is lifted from the ship’s deck for deployment the weight is airborne so to speak and free to move without resistance. Getting clobbered in the head or chest obviously would not be pleasant. The bongo net uses a 75 pound weight and the net’s solid metal frame must weigh another 25 pounds. Caution and paying attention are paramount once 100 pounds are lifted from the deck, suspended from a cable free to move about with the rolling and pitching of the ship with only air providing any sort of resistance against its movement.

 Rotary flowmeter
Rotary flowmeter

Bob and I have delegated certain tasks between us. We agreed that when a net is deployed, he will always control the net’s upper halve where the net’s “mouth” and weight are located; I in turn will control the net’s bottom halve where the netting and sample containers or cod ends are located. When the net is ready to be lifted from the sea and returned to the ship’s deck, the tasks for retrieval are the same as for deployment, though in reverse order from deployment. Before the net is lifted shipboard, it’s washed or rinsed top to bottom with seawater from a garden hose that gets seawater pumped directly from the Pacific. Washing is necessary because the collected marine organisms adhere to the net’s mesh so in order to get them into the sample container (cod end) at net’s end they must be “forced” down into the cod end. Once the net is shipboard, the cod end and collected organisms are emptied into a sample jar, sample preservative is added, and the container is labeled appropriately.

Screen shot 2013-04-20 at 4.51.18 AM

Scott Donnelly, April 21, 2008

NOAA Teacher at Sea
Scott Donnelly
Onboard NOAA Ship McArthur II
April 20-27, 2008

Mission: Assembly of Science Team and Movement of Science Gear/Equipment
Geographical Area: Coos Bay to Astoria, Oregon
Date: April 21, 2008

Weather Data from the Bridge 
Sunrise: 0620 Sunset: 2010
Wind: 10 kts
Seas: 4-7 ft
Rain showers

Cape Disappointment Lighthouse where the mighty Columbia River collides with the Pacific Ocean

Science and Technology Log

With childlike anticipation and excitement I waited for the McARTHUR II to be freed from its berth and be given the freedom to sail towards the ocean world ruled by Neptune, the god of water and sea in Roman mythology. The time had finally arrived and with the captain’s decision we pulled away from the dock, turned 180O, and set “sail” due west to where the water worlds of the Columbia River and Pacific Ocean collide. After exiting the Columbia and entering the Pacific, the McARTHUR II would turn south and set a heading toward the first sampling station located about nine miles offshore due west of Cape Falcon. ETA (Estimated Time of Arrival) is early afternoon. In the meantime I enjoyed the rugged, coastal scenery of the far southwestern tip of the state of Washington on the northern shore of the Columbia River. Before long I was officially an ocean mariner. An important question was soon to be answered: How long would it take for me to obtain my sea legs? 

It was time to get to work. Before reaching the first sampling site the science team met in the lounge to try on thermal survival suits to determine if they fit properly. It was cumbersome putting on the heavy red suit; I looked liked the cartoon character Gumby (but red rather than green) but it gave me a bit of peace of mind. Hopefully, that’s the last I’ll see of that suit. Next, we met on the ship’s fantail (back lower working deck of the ship). The Chief Bos’n discussed shipboard operations that are carried out on and safety issues associated with the fantail, the working section of the ship. Hardhats and a working vest are mandatory. We then learned how to operate the “A” frame that aids in deployment and retrieval of the heavy, bulky CTD platform, how to properly attach the Niskin bottles’ cables to the triggering latch at the top of the CTD, and lastly how to correctly deliver the water collected inside the Niskin bottles to a sample container for analysis in the ship’s wet lab.

From the fantail we moved to the main deck on the starboard side aft of the ship’s middle section to learn how to deploy, retrieve, and collect samples from the four types of zooplankton nets, each of which also requires recording certain kinds of data about the cast. I’ll discuss biological sampling in more detail later. Admittedly, when it was all done I was a bit overwhelmed but figured that after a station or two when I developed a rhythm and familiarity with the equipment and time scale for collecting samples, I would get the hang of it.

It was 1500 (3pm) and the McARTHUR II had rendezvoused with the first nearshore sampling site about 10 miles west of Cape Falcon (45O46’N, 124O10’W). Preparations were complete and now it was time to begin 24 hour non-stop operations. I put on rain gear and rubber boots, found some dry gloves, and adjusted my hardhat and workvest. With that, Bob Sleeth and I made our way to the “A” frame to prepare for the first CTD deployment.

Personal Log 

Winch (foreground left) and “A” frame (background) used to deploy and retrieve the CTD platform

My first full day at sea. We departed early morning on schedule from the Astoria dock. As expected we met rough waters where the Columbia River and Pacific Ocean meet. The day was overcast as is typical for this region of the U.S. this time of year, and cold. It snowed during the trip out to sea. Along the Columbia I was treated to the gorgeous coastal cliffs of Cape Disappointment to the north and the snow capped mountains south of Astoria. The swells subsided once the McARTHUR II reached water depths >200 feet. I’ve been out to sea for over twelve hours now and I’ve experienced no signs of sea sickness though the waters have been relatively calm. I am still earning my “sea legs” but I suppose by cruise’s end I won’t run into the hallway walls, the hallway water fountain, or my bed as often.

The overcast, gray skies ruined any chance in witnessing a marine sunset. I was still energized and excited like a kid on a “candy high” when I crawled into my lower bunk bed at 1900 (7pm). With my first shift complete I looked forward to my second shift at 0100 (1am). I figured though that I wouldn’t sleep with it being a new environment, new sounds, new smells, and the ship pitching and rolling. For the next five hours I went back and forth between sleep and semi-sleep where you’re relaxed but at the same time fully aware of the surroundings. Half past midnight I rolled out of bed, got dressed, and went to the dry lab to prepare for the 0100 to 0500 shift. 

Scott Donnelly, April 20, 2008

NOAA Teacher at Sea
Scott Donnelly
Onboard NOAA Ship McArthur II
April 20-27, 2008

Mission: Assembly of Science Team and Movement of Science Gear/Equipment
Geographical Area: Coos Bay to Astoria, Oregon
Date: April 20, 2008

NOAA TAS Scott Donnelly (green helmet) and fellow science team member Bob Sleeth collecting zooplankton

Science and Technology Log 

The start of the cruise has been delayed one day due to the rough, unpredictable, and potentially dangerous waters where the mighty eastward flowing Columbia River and its massive volume of freshwater collides head on with the cold, salty water of the vast Pacific Ocean. Where this water slugfest happens, sands bars shift repeatedly this way and that way as the pushing and shoving between the massive volumes of sea and freshwater continues without interruption. At low tide the sand bars are easily seen; they are numerous and of great area and irregular in shape.

On account of the delay, most of the day was spent making sure instruments worked properly and non-instrument equipment was organized to maximize efficiency. Perhaps though more importantly, the delay gave the eleven science team members— most of them complete strangers to one another—extra time to get to know one another. This is important because all of us will be shipboard for eight days confined to quaint sleeping quarters, working, eating, relaxing, playing, and interacting with each other. There’s no escaping once the ship moves away from the dock and goes out to sea. It also gave science team members time to get to know the ship’s crew, who themselves play a key role in the overall success of the mission.

Science team meeting in the dry lab aboard NOAA ship McARTHUR II

Communication is a two-way street. From the science team perspective we have to communicate with each other and also with the crew in order to be productive and minimize mistakes. Ocean science truly is an interdisciplinary endeavor that relies on the talents and work ethic of the people involved. This brings me to my next topic. Science is a uniquely human pursuit; good science relies on people. Modern scientific inquiry is all about assembling the best minds and talent possible into a highly productive team. It’s not just about brains though. Personalities and people skills matter too. In fact, they matter a lot. They can make or break a scientific mission. All it takes is an individual with a 60-grit sandpaper personality to upset the ebb and flow of human group dynamics.

Ocean science is all about teamwork!  

In a few hours I’ll see how such dynamics work out on this cruise with this assemblage of people, the youngest being an undergraduate science major and the oldest a retired Silicon Valley engineer. Four of the eleven science team members (myself included) have never been at sea. We don’t know what to expect or, for that matter, think about with respect to what lies ahead this next full week.

After lunch we met as a group with the NOAA Corps officers and reviewed the ship’s rules and regulations. We then had a science team meeting whereby the cruise’s Chief Scientist, Dr. Steven Rumrill, gave a brief overview of the cruise’s scientific mission, discussed shipboard operations, the cruise’s plans and objectives, and the itinerary and the logistics associated with sample collection and data acquisition.

In summary, the science team will measure a number of salient water quality parameters (see my log April 19, 2008) and collect samples of marine invertebrates (boneless organisms) along the Oregon Continental Shelf (OCS) at varying depths and distances from the coast over the period of 20-27 April 2008. This time of year was chosen because it precedes the development of an upwelling/hypoxia event that is anticipated to develop later in the summer of 2008. (The oceanographic terms upwelling and hypoxia will be discussed later in this log.) Water and biological sampling will continue non-stop for 24hrs per day, every day of the cruise except the last day when preparations are made for eventual docking.

Each work shift is four hours in length and is followed by an eight hour rest & relaxation (R&R) period. My assigned shift mate is Bob Sleeth and the team leader Ali Helms, a research cruise veteran who works full-time under Chief Scientist Steve Rumrill at South Slough National Estuarine Research Reserve (SSNERR). Ali will work the CTD controls in the dry lab while Bob and I will collect water samples from the CTD Niskin bottles and also zooplankton and phytoplankton using specially designed nets deployed starboard (right side of ship) to various depths and eventually retrieved after a certain length of time. Our daily shift schedule is from 0100 to 0500 (1am to 5am) and 1300 to 1700 (1pm to 5pm) with an eight hour R&R period in between each shift. Once started operations will continue on a 24-hour basis without interruption unless for inclement weather or seas.

The map to the right shows the major geographical regions where sampling will occur along the continental shelf of Oregon between Astoria (46O10’N, 123O50’W) and Cape Blanco (42O51’N, 124O41’W). At each sampling site biological (phytoplankton and zooplankton) samples will be collected at varying depths using special collection nets of varying mesh and design.

The operating area for this cruise is the nearshore region of the Oregon Continental Shelf (OCS), between Astoria (Cape Falcon 45o46’N, 124o40’W) and Cape Blanco (42o51’N, 124o41’W) at sites or stations ranging from 3 to 55 miles off the coast. Multiple sampling stations are scheduled along the Newport Hydrographic (NH) Line (maroon line), the Umpqua Estuary Line (green line), the Coos Bay Line (blue line), and the Coquille Estuary Line (orange line). The number of sampling stations is indicated by the number adjacent each colored line. Sampling also will take place at multiple sites (26 total) south of the Columbia River-Pacific Ocean interface and north of the NH Line as indicated by the purple circle on the map at right. Weather permitting, in total there are 59 sites where chemical and biological characterization of the water column will be carried out.

Previously I mentioned the oceanographic terms upwelling. So what is upwelling? A short definition is that upwelling is a vertical water circulation pattern in which deep, cold and typically nutrient- rich seawater moves upward to the ocean surface. Upwelling occurs in a number of places around the world on the western side of continents. It is caused either by strong, consistent winds blowing parallel to the shore as is the case on the Oregon coast in the summer months, or by deep, cold ocean currents smashing into the continental landmass and having no where to go but up as is the case in the southern hemisphere off southern Chile (South America) and Namibia (southwestern Africa). During summer in the northeastern Pacific, a clockwise rotating, high-pressure air system is positioned off the Washington-Oregon coast. Strong northerly winds blow south parallel to the Washington-Oregon coasts pushing the surface water towards the equator. At the southernmost region of the high pressure air system the water is pushed out to sea, away from the Oregon coast. As the surface water is pushed south toward the equator, deep, cold water from below upwells and thereby replaces the warmer, less dense surface water displaced to the south by winds of the high-pressure air system.

Hypoxia describes seawater that is low in dissolved oxygen gas (DO). Generally, the accepted concentration value for waters deemed hypoxic is less than (<) 1.5mg O2/L seawater. Marine organisms vary in their oxygen demand. The more active and larger swimming marine organisms such as tuna and mackerel typically require more oxygen per body weight in order to generate the metabolic activity necessary to supply their dense muscles with the requisite energy to slice through the water oftentimes counter to the current. So an active fish that moves into hypoxic waters decreases its chance of survival.

Oregon coast
Oregon coast

Personal Log 

As expected I didn’t sleep well last night, the first night on the ship. It wasn’t because of the ship’s movement either. It hardly moved as the Columbia River was calm with the wind blowing weakly. It’s a given that more often than not I sleep poorly in a new environment whether it’s a hotel, my in-laws home, or camping. Even if dead tired at best I’ll catnap for 1.5 hour intervals at the most, if lucky.

I was assigned to share living-sleeping quarters with three other science team members. The cabin contained two bunk bed units (top and bottom) separated by a wall, two small desks in the corners, ample storage space below each lower bunk bed and all along three of the four walls of the room, a (very) small lavatory with a hot/cold water shower and toilet, and a sink with hot/cold water to freshen up in the morning or before bed. In spite of the room’s relatively small size (~12ft x ~12ft), the storage capacity was more than enough to accommodate the personal gear of four people for simple, Spartan living. Every square inch of wall space was utilized for storage or some other useful, practical function. Basically, no space was wasted. Wall hooks were everywhere to hang jackets. Each bed had its own reading light, a full-length curtain for privacy (relatively speaking), and a side bumper so that when the ship rolled one didn’t roll out of bed onto the floor. Overall, it was a good example of efficient use of space for simple, practical, but productive living.

The mission delay provided more time for me to talk to and get to know members of science team, particularly my assigned shift mate Bob Sleeth, a retired Silicon Valley electronics engineer. After a hearty breakfast we spent Sunday morning exploring the quiet Astoria waterfront. Bob and a friend sailed in a 35 foot yacht from San Diego to French Polynesia in the South Pacific, spending a year sailing to and from the small islands that constitute the vast archipelago of beautiful islands including Bora Bora and Tahiti.

Cargo ship arriving at Astoria port

After lunch I spent a considerable amount of time studying the wrestling match between the ebb and flow of the high and low tides of the Columbia River. Salt water vs. fresh water. Bob gave me a few pointers on how wave structure gives a clue about the subtle changes in wind direction and speed at the water’s surface. This led to a lengthy conversation about how the nameless but intrepid mariners of ancient times, the Vikings, and those of the Age of Maritime Discovery of the European Renaissance (Ferdinand Magellan, Christopher Columbus, James Cook and many more) used their observational powers to chart the vast oceans without the aid of longitudinal coordinates. For example, the appearance of a certain bird over water, marine organism, or the change in surface water color or texture possibly meant that land or an island, yet unseen over the curvature of the earth’s surface, lay just below the horizon.

Throughout the day a number of cargo ships loaded with goods made their way slowly into port. That led to a discussion about how a seemingly small decrease in water volume translates into cargo ships having to shed weight else they run aground. Early tomorrow morning we start the mission and head out to the intimidating, deep waters of the Pacific Ocean.